List of Tables
Table 1. Global Embedded Financial Solutions Market Size Growth Rate by Type (US$ Million): 2021 vs 2025 vs 2032
Table 2. Key Players of Embedded Payments
Table 3. Key Players of Embedded Loans
Table 4. Key Players of Others
Table 5. Global Embedded Financial Solutions Market Size Growth Rate by Regulatory Powers and Responsibilities (US$ Million): 2021 vs 2025 vs 2032
Table 6. Key Players of Licensed Institution-Led Model
Table 7. Key Players of Fintech-Enabled Model
Table 8. Key Players of Joint Venture/Deep Partnership Model
Table 9. Global Embedded Financial Solutions Market Size Growth Rate by Technology Integration (US$ Million): 2021 vs 2025 vs 2032
Table 10. Key Players of API Integration
Table 11. Key Players of SDK/White Label Solutions
Table 12. Key Players of Platform as a Service
Table 13. Key Players of Other
Table 14. Global Embedded Financial Solutions Market Size Growth by Application (US$ Million): 2021 vs 2025 vs 2032
Table 15. Global Embedded Financial Solutions Market Size by Region (US$ Million): 2021 vs 2025 vs 2032
Table 16. Global Embedded Financial Solutions Market Size by Region (US$ Million), 2021–2026
Table 17. Global Embedded Financial Solutions Market Share by Region (2021–2026)
Table 18. Global Embedded Financial Solutions Forecasted Market Size by Region (US$ Million), 2027–2032
Table 19. Global Embedded Financial Solutions Market Share by Region (2027–2032)
Table 20. Embedded Financial Solutions Market Trends
Table 21. Embedded Financial Solutions Market Drivers
Table 22. Embedded Financial Solutions Market Challenges
Table 23. Embedded Financial Solutions Market Restraints
Table 24. Global Embedded Financial Solutions Revenue by Players (US$ Million), 2021–2026
Table 25. Global Embedded Financial Solutions Market Share by Players (2021–2026)
Table 26. Global Top Embedded Financial Solutions Players by Tier (Tier 1, Tier 2, and Tier 3), based on Embedded Financial Solutions Revenue, 2025
Table 27. Ranking of Global Top Embedded Financial Solutions Companies by Revenue (US$ Million) in 2025
Table 28. Global 5 Largest Players Market Share by Embedded Financial Solutions Revenue (CR5 and HHI), 2021–2026
Table 29. Global Key Players of Embedded Financial Solutions, Headquarters and Area Served
Table 30. Global Key Players of Embedded Financial Solutions, Products and Applications
Table 31. Global Key Players of Embedded Financial Solutions, Date of General Availability (GA)
Table 32. Mergers and Acquisitions, Expansion Plans
Table 33. Global Embedded Financial Solutions Market Size by Type (US$ Million), 2021–2026
Table 34. Global Embedded Financial Solutions Revenue Market Share by Type (2021–2026)
Table 35. Global Embedded Financial Solutions Forecasted Market Size by Type (US$ Million), 2027–2032
Table 36. Global Embedded Financial Solutions Revenue Market Share by Type (2027–2032)
Table 37. Global Embedded Financial Solutions Market Size by Application (US$ Million), 2021–2026
Table 38. Global Embedded Financial Solutions Revenue Market Share by Application (2021–2026)
Table 39. Global Embedded Financial Solutions Forecasted Market Size by Application (US$ Million), 2027–2032
Table 40. Global Embedded Financial Solutions Revenue Market Share by Application (2027–2032)
Table 41. North America Embedded Financial Solutions Market Size Growth Rate by Country (US$ Million): 2021 vs 2025 vs 2032
Table 42. North America Embedded Financial Solutions Market Size by Country (US$ Million), 2021–2026
Table 43. North America Embedded Financial Solutions Market Size by Country (US$ Million), 2027–2032
Table 44. Europe Embedded Financial Solutions Market Size Growth Rate by Country (US$ Million): 2021 vs 2025 vs 2032
Table 45. Europe Embedded Financial Solutions Market Size by Country (US$ Million), 2021–2026
Table 46. Europe Embedded Financial Solutions Market Size by Country (US$ Million), 2027–2032
Table 47. Asia-Pacific Embedded Financial Solutions Market Size Growth Rate by Region (US$ Million): 2021 vs 2025 vs 2032
Table 48. Asia-Pacific Embedded Financial Solutions Market Size by Region (US$ Million), 2021–2026
Table 49. Asia-Pacific Embedded Financial Solutions Market Size by Region (US$ Million), 2027–2032
Table 50. Latin America Embedded Financial Solutions Market Size Growth Rate by Country (US$ Million): 2021 vs 2025 vs 2032
Table 51. Latin America Embedded Financial Solutions Market Size by Country (US$ Million), 2021–2026
Table 52. Latin America Embedded Financial Solutions Market Size by Country (US$ Million), 2027–2032
Table 53. Middle East & Africa Embedded Financial Solutions Market Size Growth Rate by Country (US$ Million): 2021 vs 2025 vs 2032
Table 54. Middle East & Africa Embedded Financial Solutions Market Size by Country (US$ Million), 2021–2026
Table 55. Middle East & Africa Embedded Financial Solutions Market Size by Country (US$ Million), 2027–2032
Table 56. Pipe Company Details
Table 57. Pipe Business Overview
Table 58. Pipe Embedded Financial Solutions Product
Table 59. Pipe Revenue in Embedded Financial Solutions Business (US$ Million), 2021–2026
Table 60. Pipe Recent Development
Table 61. Mambu Company Details
Table 62. Mambu Business Overview
Table 63. Mambu Embedded Financial Solutions Product
Table 64. Mambu Revenue in Embedded Financial Solutions Business (US$ Million), 2021–2026
Table 65. Mambu Recent Development
Table 66. Marqeta Company Details
Table 67. Marqeta Business Overview
Table 68. Marqeta Embedded Financial Solutions Product
Table 69. Marqeta Revenue in Embedded Financial Solutions Business (US$ Million), 2021–2026
Table 70. Marqeta Recent Development
Table 71. Unit Company Details
Table 72. Unit Business Overview
Table 73. Unit Embedded Financial Solutions Product
Table 74. Unit Revenue in Embedded Financial Solutions Business (US$ Million), 2021–2026
Table 75. Unit Recent Development
Table 76. Stripe Company Details
Table 77. Stripe Business Overview
Table 78. Stripe Embedded Financial Solutions Product
Table 79. Stripe Revenue in Embedded Financial Solutions Business (US$ Million), 2021–2026
Table 80. Stripe Recent Development
Table 81. Inswitch Company Details
Table 82. Inswitch Business Overview
Table 83. Inswitch Embedded Financial Solutions Product
Table 84. Inswitch Revenue in Embedded Financial Solutions Business (US$ Million), 2021–2026
Table 85. Inswitch Recent Development
Table 86. Worldpay Company Details
Table 87. Worldpay Business Overview
Table 88. Worldpay Embedded Financial Solutions Product
Table 89. Worldpay Revenue in Embedded Financial Solutions Business (US$ Million), 2021–2026
Table 90. Worldpay Recent Development
Table 91. OpenPayd Company Details
Table 92. OpenPayd Business Overview
Table 93. OpenPayd Embedded Financial Solutions Product
Table 94. OpenPayd Revenue in Embedded Financial Solutions Business (US$ Million), 2021–2026
Table 95. OpenPayd Recent Development
Table 96. SDK.finance Company Details
Table 97. SDK.finance Business Overview
Table 98. SDK.finance Embedded Financial Solutions Product
Table 99. SDK.finance Revenue in Embedded Financial Solutions Business (US$ Million), 2021–2026
Table 100. SDK.finance Recent Development
Table 101. Edenred Payment Solutions Company Details
Table 102. Edenred Payment Solutions Business Overview
Table 103. Edenred Payment Solutions Embedded Financial Solutions Product
Table 104. Edenred Payment Solutions Revenue in Embedded Financial Solutions Business (US$ Million), 2021–2026
Table 105. Edenred Payment Solutions Recent Development
Table 106. SAP Fioneer Company Details
Table 107. SAP Fioneer Business Overview
Table 108. SAP Fioneer Embedded Financial Solutions Product
Table 109. SAP Fioneer Revenue in Embedded Financial Solutions Business (US$ Million), 2021–2026
Table 110. SAP Fioneer Recent Development
Table 111. Weavr Company Details
Table 112. Weavr Business Overview
Table 113. Weavr Embedded Financial Solutions Product
Table 114. Weavr Revenue in Embedded Financial Solutions Business (US$ Million), 2021–2026
Table 115. Weavr Recent Development
Table 116. Checkout.com Company Details
Table 117. Checkout.com Business Overview
Table 118. Checkout.com Embedded Financial Solutions Product
Table 119. Checkout.com Revenue in Embedded Financial Solutions Business (US$ Million), 2021–2026
Table 120. Checkout.com Recent Development
Table 121. Engine by MoneyLion Company Details
Table 122. Engine by MoneyLion Business Overview
Table 123. Engine by MoneyLion Embedded Financial Solutions Product
Table 124. Engine by MoneyLion Revenue in Embedded Financial Solutions Business (US$ Million), 2021–2026
Table 125. Engine by MoneyLion Recent Development
Table 126. Railsr Company Details
Table 127. Railsr Business Overview
Table 128. Railsr Embedded Financial Solutions Product
Table 129. Railsr Revenue in Embedded Financial Solutions Business (US$ Million), 2021–2026
Table 130. Railsr Recent Development
Table 131. Research Programs/Design for This Report
Table 132. Key Data Information from Secondary Sources
Table 133. Key Data Information from Primary Sources
Table 134. Authors List of This Report
List of Figures
Figure 1. Embedded Financial Solutions Picture
Figure 2. Global Embedded Financial Solutions Market Size Comparison by Type (US$ Million), 2021–2032
Figure 3. Global Embedded Financial Solutions Market Share by Type: 2025 vs 2032
Figure 4. Embedded Payments Features
Figure 5. Embedded Loans Features
Figure 6. Others Features
Figure 7. Global Embedded Financial Solutions Market Size Comparison by Regulatory Powers and Responsibilities (US$ Million), 2021–2032
Figure 8. Licensed Institution-Led Model Features
Figure 9. Fintech-Enabled Model Features
Figure 10. Joint Venture/Deep Partnership Model Features
Figure 11. Global Embedded Financial Solutions Market Size Comparison by Technology Integration (US$ Million), 2021–2032
Figure 12. API Integration Features
Figure 13. SDK/White Label Solutions Features
Figure 14. Platform as a Service Features
Figure 15. Other Features
Figure 16. Global Embedded Financial Solutions Market Size by Application (US$ Million), 2021–2032
Figure 17. Global Embedded Financial Solutions Market Share by Application: 2025 vs 2032
Figure 18. Large Enterprises Case Studies
Figure 19. Small and Medium Enterprises Case Studies
Figure 20. Embedded Financial Solutions Report Years Considered
Figure 21. Global Embedded Financial Solutions Market Size (US$ Million), Year-over-Year: 2021–2032
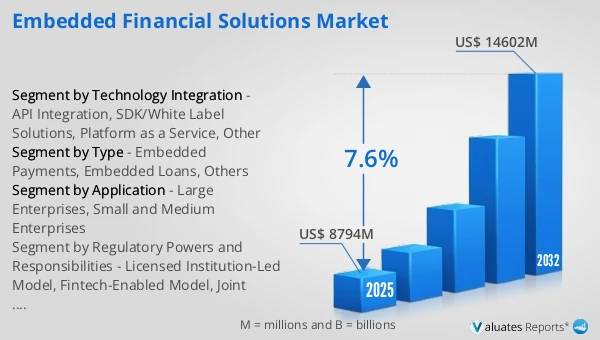
Figure 22. Global Embedded Financial Solutions Market Size, (US$ Million), 2021 vs 2025 vs 2032
Figure 23. Global Embedded Financial Solutions Market Share by Region: 2025 vs 2032
Figure 24. Global Embedded Financial Solutions Market Share by Players in 2025
Figure 25. Global Embedded Financial Solutions Market Share by Company Type (Tier 1, Tier 2, and Tier 3)
Figure 26. The Top 10 and 5 Players Market Share by Embedded Financial Solutions Revenue in 2025
Figure 27. North America Embedded Financial Solutions Market Size YoY Growth (US$ Million), 2021–2032
Figure 28. North America Embedded Financial Solutions Market Share by Country (2021–2032)
Figure 29. United States Embedded Financial Solutions Market Size YoY Growth (US$ Million), 2021–2032
Figure 30. Canada Embedded Financial Solutions Market Size YoY Growth (US$ Million), 2021–2032
Figure 31. Europe Embedded Financial Solutions Market Size YoY Growth (US$ Million), 2021–2032
Figure 32. Europe Embedded Financial Solutions Market Share by Country (2021–2032)
Figure 33. Germany Embedded Financial Solutions Market Size YoY Growth (US$ Million), 2021–2032
Figure 34. France Embedded Financial Solutions Market Size YoY Growth (US$ Million), 2021–2032
Figure 35. U.K. Embedded Financial Solutions Market Size YoY Growth (US$ Million), 2021–2032
Figure 36. Italy Embedded Financial Solutions Market Size YoY Growth (US$ Million), 2021–2032
Figure 37. Russia Embedded Financial Solutions Market Size YoY Growth (US$ Million), 2021–2032
Figure 38. Ireland Embedded Financial Solutions Market Size YoY Growth (US$ Million), 2021–2032
Figure 39. Asia-Pacific Embedded Financial Solutions Market Size YoY Growth (US$ Million), 2021–2032
Figure 40. Asia-Pacific Embedded Financial Solutions Market Share by Region (2021–2032)
Figure 41. China Embedded Financial Solutions Market Size YoY Growth (US$ Million), 2021–2032
Figure 42. Japan Embedded Financial Solutions Market Size YoY Growth (US$ Million), 2021–2032
Figure 43. South Korea Embedded Financial Solutions Market Size YoY Growth (US$ Million), 2021–2032
Figure 44. Southeast Asia Embedded Financial Solutions Market Size YoY Growth (US$ Million), 2021–2032
Figure 45. India Embedded Financial Solutions Market Size YoY Growth (US$ Million), 2021–2032
Figure 46. Australia & New Zealand Embedded Financial Solutions Market Size YoY Growth (US$ Million), 2021–2032
Figure 47. Latin America Embedded Financial Solutions Market Size YoY Growth (US$ Million), 2021–2032
Figure 48. Latin America Embedded Financial Solutions Market Share by Country (2021–2032)
Figure 49. Mexico Embedded Financial Solutions Market Size YoY Growth (US$ Million), 2021–2032
Figure 50. Brazil Embedded Financial Solutions Market Size YoY Growth (US$ Million), 2021–2032
Figure 51. Middle East & Africa Embedded Financial Solutions Market Size YoY Growth (US$ Million), 2021–2032
Figure 52. Middle East & Africa Embedded Financial Solutions Market Share by Country (2021–2032)
Figure 53. Israel Embedded Financial Solutions Market Size YoY Growth (US$ Million), 2021–2032
Figure 54. Saudi Arabia Embedded Financial Solutions Market Size YoY Growth (US$ Million), 2021–2032
Figure 55. UAE Embedded Financial Solutions Market Size YoY Growth (US$ Million), 2021–2032
Figure 56. Pipe Revenue Growth Rate in Embedded Financial Solutions Business (2021–2026)
Figure 57. Mambu Revenue Growth Rate in Embedded Financial Solutions Business (2021–2026)
Figure 58. Marqeta Revenue Growth Rate in Embedded Financial Solutions Business (2021–2026)
Figure 59. Unit Revenue Growth Rate in Embedded Financial Solutions Business (2021–2026)
Figure 60. Stripe Revenue Growth Rate in Embedded Financial Solutions Business (2021–2026)
Figure 61. Inswitch Revenue Growth Rate in Embedded Financial Solutions Business (2021–2026)
Figure 62. Worldpay Revenue Growth Rate in Embedded Financial Solutions Business (2021–2026)
Figure 63. OpenPayd Revenue Growth Rate in Embedded Financial Solutions Business (2021–2026)
Figure 64. SDK.finance Revenue Growth Rate in Embedded Financial Solutions Business (2021–2026)
Figure 65. Edenred Payment Solutions Revenue Growth Rate in Embedded Financial Solutions Business (2021–2026)
Figure 66. SAP Fioneer Revenue Growth Rate in Embedded Financial Solutions Business (2021–2026)
Figure 67. Weavr Revenue Growth Rate in Embedded Financial Solutions Business (2021–2026)
Figure 68. Checkout.com Revenue Growth Rate in Embedded Financial Solutions Business (2021–2026)
Figure 69. Engine by MoneyLion Revenue Growth Rate in Embedded Financial Solutions Business (2021–2026)
Figure 70. Railsr Revenue Growth Rate in Embedded Financial Solutions Business (2021–2026)
Figure 71. Bottom-up and Top-down Approaches for This Report
Figure 72. Data Triangulation
Figure 73. Key Executives Interviewed