List of Tables
Table 1. Global Triangular Bandage Market Value Comparison by Type (2024 VS 2031) & (US$ Million)
Table 2. Global Triangular Bandage Market Value by Application (2024 VS 2031) & (US$ Million)
Table 3. Global Triangular Bandage Market Competitive Situation by Manufacturers in 2024
Table 4. Global Triangular Bandage Sales (K Units) of Key Manufacturers (2020-2025)
Table 5. Global Triangular Bandage Sales Market Share by Manufacturers (2020-2025)
Table 6. Global Triangular Bandage Revenue (US$ Million) by Manufacturers (2020-2025)
Table 7. Global Triangular Bandage Revenue Share by Manufacturers (2020-2025)
Table 8. Global Market Triangular Bandage Average Price (US$/Unit) of Key Manufacturers (2020-2025)
Table 9. Global Key Players of Triangular Bandage, Industry Ranking, 2022 VS 2023 VS 2024
Table 10. Global Key Manufacturers of Triangular Bandage, Manufacturing Sites & Headquarters
Table 11. Global Key Manufacturers of Triangular Bandage, Product Type & Application
Table 12. Global Key Manufacturers of Triangular Bandage, Date of Enter into This Industry
Table 13. Global Manufacturers Market Concentration Ratio (CR5 and HHI)
Table 14. Global Triangular Bandage by Company Type (Tier 1, Tier 2, and Tier 3) & (based on the Revenue in Triangular Bandage as of 2024)
Table 15. Manufacturers Mergers & Acquisitions, Expansion Plans
Table 16. Global Triangular Bandage Market Size by Region (US$ Million): 2020 VS 2024 VS 2031
Table 17. Global Triangular Bandage Sales by Region (2020-2025) & (K Units)
Table 18. Global Triangular Bandage Sales Market Share by Region (2020-2025)
Table 19. Global Triangular Bandage Sales by Region (2026-2031) & (K Units)
Table 20. Global Triangular Bandage Sales Market Share by Region (2026-2031)
Table 21. Global Triangular Bandage Revenue by Region (2020-2025) & (US$ Million)
Table 22. Global Triangular Bandage Revenue Market Share by Region (2020-2025)
Table 23. Global Triangular Bandage Revenue by Region (2026-2031) & (US$ Million)
Table 24. Global Triangular Bandage Revenue Market Share by Region (2026-2031)
Table 25. North America Triangular Bandage Revenue by Country: 2020 VS 2024 VS 2031 (US$ Million)
Table 26. North America Triangular Bandage Sales by Country (2020-2025) & (K Units)
Table 27. North America Triangular Bandage Sales by Country (2026-2031) & (K Units)
Table 28. North America Triangular Bandage Revenue by Country (2020-2025) & (US$ Million)
Table 29. North America Triangular Bandage Revenue by Country (2026-2031) & (US$ Million)
Table 30. Europe Triangular Bandage Revenue by Country: 2020 VS 2024 VS 2031 (US$ Million)
Table 31. Europe Triangular Bandage Sales by Country (2020-2025) & (K Units)
Table 32. Europe Triangular Bandage Sales by Country (2026-2031) & (K Units)
Table 33. Europe Triangular Bandage Revenue by Country (2020-2025) & (US$ Million)
Table 34. Europe Triangular Bandage Revenue by Country (2026-2031) & (US$ Million)
Table 35. Asia Pacific Triangular Bandage Revenue by Region: 2020 VS 2024 VS 2031 (US$ Million)
Table 36. Asia Pacific Triangular Bandage Sales by Region (2020-2025) & (K Units)
Table 37. Asia Pacific Triangular Bandage Sales by Region (2026-2031) & (K Units)
Table 38. Asia Pacific Triangular Bandage Revenue by Region (2020-2025) & (US$ Million)
Table 39. Asia Pacific Triangular Bandage Revenue by Region (2026-2031) & (US$ Million)
Table 40. Latin America Triangular Bandage Revenue by Country: 2020 VS 2024 VS 2031 (US$ Million)
Table 41. Latin America Triangular Bandage Sales by Country (2020-2025) & (K Units)
Table 42. Latin America Triangular Bandage Sales by Country (2026-2031) & (K Units)
Table 43. Latin America Triangular Bandage Revenue by Country (2020-2025) & (US$ Million)
Table 44. Latin America Triangular Bandage Revenue by Country (2026-2031) & (US$ Million)
Table 45. Middle East and Africa Triangular Bandage Revenue by Country: 2020 VS 2024 VS 2031 (US$ Million)
Table 46. Middle East and Africa Triangular Bandage Sales by Country (2020-2025) & (K Units)
Table 47. Middle East and Africa Triangular Bandage Sales by Country (2026-2031) & (K Units)
Table 48. Middle East and Africa Triangular Bandage Revenue by Country (2020-2025) & (US$ Million)
Table 49. Middle East and Africa Triangular Bandage Revenue by Country (2026-2031) & (US$ Million)
Table 50. Global Triangular Bandage Sales (K Units) by Type (2020-2025)
Table 51. Global Triangular Bandage Sales (K Units) by Type (2026-2031)
Table 52. Global Triangular Bandage Sales Market Share by Type (2020-2025)
Table 53. Global Triangular Bandage Sales Market Share by Type (2026-2031)
Table 54. Global Triangular Bandage Revenue (US$ Million) by Type (2020-2025)
Table 55. Global Triangular Bandage Revenue (US$ Million) by Type (2026-2031)
Table 56. Global Triangular Bandage Revenue Market Share by Type (2020-2025)
Table 57. Global Triangular Bandage Revenue Market Share by Type (2026-2031)
Table 58. Global Triangular Bandage Price (US$/Unit) by Type (2020-2025)
Table 59. Global Triangular Bandage Price (US$/Unit) by Type (2026-2031)
Table 60. Global Triangular Bandage Sales (K Units) by Application (2020-2025)
Table 61. Global Triangular Bandage Sales (K Units) by Application (2026-2031)
Table 62. Global Triangular Bandage Sales Market Share by Application (2020-2025)
Table 63. Global Triangular Bandage Sales Market Share by Application (2026-2031)
Table 64. Global Triangular Bandage Revenue (US$ Million) by Application (2020-2025)
Table 65. Global Triangular Bandage Revenue (US$ Million) by Application (2026-2031)
Table 66. Global Triangular Bandage Revenue Market Share by Application (2020-2025)
Table 67. Global Triangular Bandage Revenue Market Share by Application (2026-2031)
Table 68. Global Triangular Bandage Price (US$/Unit) by Application (2020-2025)
Table 69. Global Triangular Bandage Price (US$/Unit) by Application (2026-2031)
Table 70. Reliance Medical Company Information
Table 71. Reliance Medical Description and Business Overview
Table 72. Reliance Medical Triangular Bandage Sales (K Units), Revenue (US$ Million), Price (US$/Unit) and Gross Margin (2020-2025)
Table 73. Reliance Medical Triangular Bandage Product
Table 74. Reliance Medical Recent Developments/Updates
Table 75. EverReady First Aid Company Information
Table 76. EverReady First Aid Description and Business Overview
Table 77. EverReady First Aid Triangular Bandage Sales (K Units), Revenue (US$ Million), Price (US$/Unit) and Gross Margin (2020-2025)
Table 78. EverReady First Aid Triangular Bandage Product
Table 79. EverReady First Aid Recent Developments/Updates
Table 80. First Aid Only Company Information
Table 81. First Aid Only Description and Business Overview
Table 82. First Aid Only Triangular Bandage Sales (K Units), Revenue (US$ Million), Price (US$/Unit) and Gross Margin (2020-2025)
Table 83. First Aid Only Triangular Bandage Product
Table 84. First Aid Only Recent Developments/Updates
Table 85. GF Health Products Company Information
Table 86. GF Health Products Description and Business Overview
Table 87. GF Health Products Triangular Bandage Sales (K Units), Revenue (US$ Million), Price (US$/Unit) and Gross Margin (2020-2025)
Table 88. GF Health Products Triangular Bandage Product
Table 89. GF Health Products Recent Developments/Updates
Table 90. North American Rescue Company Information
Table 91. North American Rescue Description and Business Overview
Table 92. North American Rescue Triangular Bandage Sales (K Units), Revenue (US$ Million), Price (US$/Unit) and Gross Margin (2020-2025)
Table 93. North American Rescue Triangular Bandage Product
Table 94. North American Rescue Recent Developments/Updates
Table 95. Cardinal Health Company Information
Table 96. Cardinal Health Description and Business Overview
Table 97. Cardinal Health Triangular Bandage Sales (K Units), Revenue (US$ Million), Price (US$/Unit) and Gross Margin (2020-2025)
Table 98. Cardinal Health Triangular Bandage Product
Table 99. Cardinal Health Recent Developments/Updates
Table 100. Dynarex Company Information
Table 101. Dynarex Description and Business Overview
Table 102. Dynarex Triangular Bandage Sales (K Units), Revenue (US$ Million), Price (US$/Unit) and Gross Margin (2020-2025)
Table 103. Dynarex Triangular Bandage Product
Table 104. Dynarex Recent Developments/Updates
Table 105. McKesson Medical Company Information
Table 106. McKesson Medical Description and Business Overview
Table 107. McKesson Medical Triangular Bandage Sales (K Units), Revenue (US$ Million), Price (US$/Unit) and Gross Margin (2020-2025)
Table 108. McKesson Medical Triangular Bandage Product
Table 109. McKesson Medical Recent Developments/Updates
Table 110. Curaplex(Bound Tree Medical) Company Information
Table 111. Curaplex(Bound Tree Medical) Description and Business Overview
Table 112. Curaplex(Bound Tree Medical) Triangular Bandage Sales (K Units), Revenue (US$ Million), Price (US$/Unit) and Gross Margin (2020-2025)
Table 113. Curaplex(Bound Tree Medical) Triangular Bandage Product
Table 114. Curaplex(Bound Tree Medical) Recent Developments/Updates
Table 115. Aero Healthcare Company Information
Table 116. Aero Healthcare Description and Business Overview
Table 117. Aero Healthcare Triangular Bandage Sales (K Units), Revenue (US$ Million), Price (US$/Unit) and Gross Margin (2020-2025)
Table 118. Aero Healthcare Triangular Bandage Product
Table 119. Aero Healthcare Recent Developments/Updates
Table 120. St John Ambulance Company Information
Table 121. St John Ambulance Description and Business Overview
Table 122. St John Ambulance Triangular Bandage Sales (K Units), Revenue (US$ Million), Price (US$/Unit) and Gross Margin (2020-2025)
Table 123. St John Ambulance Triangular Bandage Product
Table 124. St John Ambulance Recent Developments/Updates
Table 125. Performance Health Company Information
Table 126. Performance Health Description and Business Overview
Table 127. Performance Health Triangular Bandage Sales (K Units), Revenue (US$ Million), Price (US$/Unit) and Gross Margin (2020-2025)
Table 128. Performance Health Triangular Bandage Product
Table 129. Performance Health Recent Developments/Updates
Table 130. Sentry Medical Company Information
Table 131. Sentry Medical Description and Business Overview
Table 132. Sentry Medical Triangular Bandage Sales (K Units), Revenue (US$ Million), Price (US$/Unit) and Gross Margin (2020-2025)
Table 133. Sentry Medical Triangular Bandage Product
Table 134. Sentry Medical Recent Developments/Updates
Table 135. A.D.I. Medical Company Information
Table 136. A.D.I. Medical Description and Business Overview
Table 137. A.D.I. Medical Triangular Bandage Sales (K Units), Revenue (US$ Million), Price (US$/Unit) and Gross Margin (2020-2025)
Table 138. A.D.I. Medical Triangular Bandage Product
Table 139. A.D.I. Medical Recent Developments/Updates
Table 140. Safecross Company Information
Table 141. Safecross Description and Business Overview
Table 142. Safecross Triangular Bandage Sales (K Units), Revenue (US$ Million), Price (US$/Unit) and Gross Margin (2020-2025)
Table 143. Safecross Triangular Bandage Product
Table 144. Safecross Recent Developments/Updates
Table 145. Safety First Aid Company Information
Table 146. Safety First Aid Description and Business Overview
Table 147. Safety First Aid Triangular Bandage Sales (K Units), Revenue (US$ Million), Price (US$/Unit) and Gross Margin (2020-2025)
Table 148. Safety First Aid Triangular Bandage Product
Table 149. Safety First Aid Recent Developments/Updates
Table 150. MedSource Company Information
Table 151. MedSource Description and Business Overview
Table 152. MedSource Triangular Bandage Sales (K Units), Revenue (US$ Million), Price (US$/Unit) and Gross Margin (2020-2025)
Table 153. MedSource Triangular Bandage Product
Table 154. MedSource Recent Developments/Updates
Table 155. Healthium Medtech Company Information
Table 156. Healthium Medtech Description and Business Overview
Table 157. Healthium Medtech Triangular Bandage Sales (K Units), Revenue (US$ Million), Price (US$/Unit) and Gross Margin (2020-2025)
Table 158. Healthium Medtech Triangular Bandage Product
Table 159. Healthium Medtech Recent Developments/Updates
Table 160. Steroplast Healthcare Company Information
Table 161. Steroplast Healthcare Description and Business Overview
Table 162. Steroplast Healthcare Triangular Bandage Sales (K Units), Revenue (US$ Million), Price (US$/Unit) and Gross Margin (2020-2025)
Table 163. Steroplast Healthcare Triangular Bandage Product
Table 164. Steroplast Healthcare Recent Developments/Updates
Table 165. Multigate Company Information
Table 166. Multigate Description and Business Overview
Table 167. Multigate Triangular Bandage Sales (K Units), Revenue (US$ Million), Price (US$/Unit) and Gross Margin (2020-2025)
Table 168. Multigate Triangular Bandage Product
Table 169. Multigate Recent Developments/Updates
Table 170. Clicks Company Information
Table 171. Clicks Description and Business Overview
Table 172. Clicks Triangular Bandage Sales (K Units), Revenue (US$ Million), Price (US$/Unit) and Gross Margin (2020-2025)
Table 173. Clicks Triangular Bandage Product
Table 174. Clicks Recent Developments/Updates
Table 175. BSN Medical(Essity) Company Information
Table 176. BSN Medical(Essity) Description and Business Overview
Table 177. BSN Medical(Essity) Triangular Bandage Sales (K Units), Revenue (US$ Million), Price (US$/Unit) and Gross Margin (2020-2025)
Table 178. BSN Medical(Essity) Triangular Bandage Product
Table 179. BSN Medical(Essity) Recent Developments/Updates
Table 180. USL Medical Company Information
Table 181. USL Medical Description and Business Overview
Table 182. USL Medical Triangular Bandage Sales (K Units), Revenue (US$ Million), Price (US$/Unit) and Gross Margin (2020-2025)
Table 183. USL Medical Triangular Bandage Product
Table 184. USL Medical Recent Developments/Updates
Table 185. Qualicare Company Information
Table 186. Qualicare Description and Business Overview
Table 187. Qualicare Triangular Bandage Sales (K Units), Revenue (US$ Million), Price (US$/Unit) and Gross Margin (2020-2025)
Table 188. Qualicare Triangular Bandage Product
Table 189. Qualicare Recent Developments/Updates
Table 190. Dukal Company Information
Table 191. Dukal Description and Business Overview
Table 192. Dukal Triangular Bandage Sales (K Units), Revenue (US$ Million), Price (US$/Unit) and Gross Margin (2020-2025)
Table 193. Dukal Triangular Bandage Product
Table 194. Dukal Recent Developments/Updates
Table 195. Medicom Company Information
Table 196. Medicom Description and Business Overview
Table 197. Medicom Triangular Bandage Sales (K Units), Revenue (US$ Million), Price (US$/Unit) and Gross Margin (2020-2025)
Table 198. Medicom Triangular Bandage Product
Table 199. Medicom Recent Developments/Updates
Table 200. Formedica Ltée Company Information
Table 201. Formedica Ltée Description and Business Overview
Table 202. Formedica Ltée Triangular Bandage Sales (K Units), Revenue (US$ Million), Price (US$/Unit) and Gross Margin (2020-2025)
Table 203. Formedica Ltée Triangular Bandage Product
Table 204. Formedica Ltée Recent Developments/Updates
Table 205. Ecolab Company Information
Table 206. Ecolab Description and Business Overview
Table 207. Ecolab Triangular Bandage Sales (K Units), Revenue (US$ Million), Price (US$/Unit) and Gross Margin (2020-2025)
Table 208. Ecolab Triangular Bandage Product
Table 209. Ecolab Recent Developments/Updates
Table 210. Paramedic Company Information
Table 211. Paramedic Description and Business Overview
Table 212. Paramedic Triangular Bandage Sales (K Units), Revenue (US$ Million), Price (US$/Unit) and Gross Margin (2020-2025)
Table 213. Paramedic Triangular Bandage Product
Table 214. Paramedic Recent Developments/Updates
Table 215. Allied Medical Company Information
Table 216. Allied Medical Description and Business Overview
Table 217. Allied Medical Triangular Bandage Sales (K Units), Revenue (US$ Million), Price (US$/Unit) and Gross Margin (2020-2025)
Table 218. Allied Medical Triangular Bandage Product
Table 219. Allied Medical Recent Developments/Updates
Table 220. Johnson & Johnson Company Information
Table 221. Johnson & Johnson Description and Business Overview
Table 222. Johnson & Johnson Triangular Bandage Sales (K Units), Revenue (US$ Million), Price (US$/Unit) and Gross Margin (2020-2025)
Table 223. Johnson & Johnson Triangular Bandage Product
Table 224. Johnson & Johnson Recent Developments/Updates
Table 225. 3M Company Information
Table 226. 3M Description and Business Overview
Table 227. 3M Triangular Bandage Sales (K Units), Revenue (US$ Million), Price (US$/Unit) and Gross Margin (2020-2025)
Table 228. 3M Triangular Bandage Product
Table 229. 3M Recent Developments/Updates
Table 230. Medline Industries Company Information
Table 231. Medline Industries Description and Business Overview
Table 232. Medline Industries Triangular Bandage Sales (K Units), Revenue (US$ Million), Price (US$/Unit) and Gross Margin (2020-2025)
Table 233. Medline Industries Triangular Bandage Product
Table 234. Medline Industries Recent Developments/Updates
Table 235. Hartmann Company Information
Table 236. Hartmann Description and Business Overview
Table 237. Hartmann Triangular Bandage Sales (K Units), Revenue (US$ Million), Price (US$/Unit) and Gross Margin (2020-2025)
Table 238. Hartmann Triangular Bandage Product
Table 239. Hartmann Recent Developments/Updates
Table 240. Derma Sciences Company Information
Table 241. Derma Sciences Description and Business Overview
Table 242. Derma Sciences Triangular Bandage Sales (K Units), Revenue (US$ Million), Price (US$/Unit) and Gross Margin (2020-2025)
Table 243. Derma Sciences Triangular Bandage Product
Table 244. Derma Sciences Recent Developments/Updates
Table 245. Smith & Nephew Company Information
Table 246. Smith & Nephew Description and Business Overview
Table 247. Smith & Nephew Triangular Bandage Sales (K Units), Revenue (US$ Million), Price (US$/Unit) and Gross Margin (2020-2025)
Table 248. Smith & Nephew Triangular Bandage Product
Table 249. Smith & Nephew Recent Developments/Updates
Table 250. Andover Healthcare Company Information
Table 251. Andover Healthcare Description and Business Overview
Table 252. Andover Healthcare Triangular Bandage Sales (K Units), Revenue (US$ Million), Price (US$/Unit) and Gross Margin (2020-2025)
Table 253. Andover Healthcare Triangular Bandage Product
Table 254. Andover Healthcare Recent Developments/Updates
Table 255. Key Raw Materials Lists
Table 256. Raw Materials Key Suppliers Lists
Table 257. Triangular Bandage Distributors List
Table 258. Triangular Bandage Customers List
Table 259. Triangular Bandage Market Trends
Table 260. Triangular Bandage Market Drivers
Table 261. Triangular Bandage Market Challenges
Table 262. Triangular Bandage Market Restraints
Table 263. Research Programs/Design for This Report
Table 264. Key Data Information from Secondary Sources
Table 265. Key Data Information from Primary Sources
Table 266. Authors List of This Report
List of Figures
Figure 1. Product Picture of Triangular Bandage
Figure 2. Global Triangular Bandage Market Value Comparison by Type (2020-2031) & (US$ Million)
Figure 3. Global Triangular Bandage Market Share by Type: 2024 & 2031
Figure 4. Sterile Triangular Bandage Product Picture
Figure 5. Non-Sterile Triangular Bandage Product Picture
Figure 6. Global Triangular Bandage Market Value by Application (2020-2031) & (US$ Million)
Figure 7. Global Triangular Bandage Market Share by Application: 2024 & 2031
Figure 8. Limb Supporting
Figure 9. Dressing Fixing
Figure 10. Others
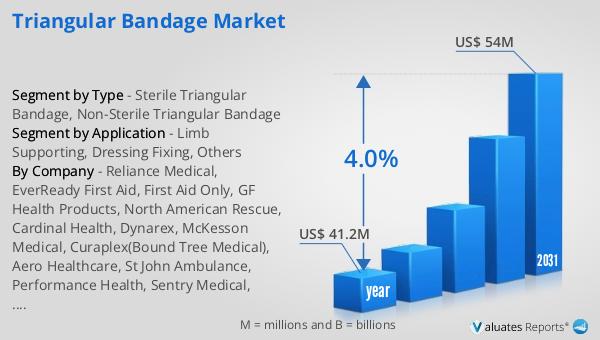
Figure 11. Global Triangular Bandage Revenue, (US$ Million), 2020 VS 2024 VS 2031
Figure 12. Global Triangular Bandage Market Size (2020-2031) & (US$ Million)
Figure 13. Global Triangular Bandage Sales (2020-2031) & (K Units)
Figure 14. Global Triangular Bandage Average Price (US$/Unit) & (2020-2031)
Figure 15. Triangular Bandage Report Years Considered
Figure 16. Triangular Bandage Sales Share by Manufacturers in 2024
Figure 17. Global Triangular Bandage Revenue Share by Manufacturers in 2024
Figure 18. Global 5 and 10 Largest Triangular Bandage Players: Market Share by Revenue in Triangular Bandage in 2024
Figure 19. Triangular Bandage Market Share by Company Type (Tier 1, Tier 2, and Tier 3): 2020 VS 2024
Figure 20. Global Triangular Bandage Market Size by Region (US$ Million): 2020 VS 2024 VS 2031
Figure 21. North America Triangular Bandage Sales Market Share by Country (2020-2031)
Figure 22. North America Triangular Bandage Revenue Market Share by Country (2020-2031)
Figure 23. United States Triangular Bandage Revenue Growth Rate (2020-2031) & (US$ Million)
Figure 24. Canada Triangular Bandage Revenue Growth Rate (2020-2031) & (US$ Million)
Figure 25. Europe Triangular Bandage Sales Market Share by Country (2020-2031)
Figure 26. Europe Triangular Bandage Revenue Market Share by Country (2020-2031)
Figure 27. Germany Triangular Bandage Revenue Growth Rate (2020-2031) & (US$ Million)
Figure 28. France Triangular Bandage Revenue Growth Rate (2020-2031) & (US$ Million)
Figure 29. U.K. Triangular Bandage Revenue Growth Rate (2020-2031) & (US$ Million)
Figure 30. Italy Triangular Bandage Revenue Growth Rate (2020-2031) & (US$ Million)
Figure 31. Russia Triangular Bandage Revenue Growth Rate (2020-2031) & (US$ Million)
Figure 32. Asia Pacific Triangular Bandage Sales Market Share by Region (2020-2031)
Figure 33. Asia Pacific Triangular Bandage Revenue Market Share by Region (2020-2031)
Figure 34. China Triangular Bandage Revenue Growth Rate (2020-2031) & (US$ Million)
Figure 35. Japan Triangular Bandage Revenue Growth Rate (2020-2031) & (US$ Million)
Figure 36. South Korea Triangular Bandage Revenue Growth Rate (2020-2031) & (US$ Million)
Figure 37. India Triangular Bandage Revenue Growth Rate (2020-2031) & (US$ Million)
Figure 38. Australia Triangular Bandage Revenue Growth Rate (2020-2031) & (US$ Million)
Figure 39. China Taiwan Triangular Bandage Revenue Growth Rate (2020-2031) & (US$ Million)
Figure 40. Indonesia Triangular Bandage Revenue Growth Rate (2020-2031) & (US$ Million)
Figure 41. Thailand Triangular Bandage Revenue Growth Rate (2020-2031) & (US$ Million)
Figure 42. Malaysia Triangular Bandage Revenue Growth Rate (2020-2031) & (US$ Million)
Figure 43. Latin America Triangular Bandage Sales Market Share by Country (2020-2031)
Figure 44. Latin America Triangular Bandage Revenue Market Share by Country (2020-2031)
Figure 45. Mexico Triangular Bandage Revenue Growth Rate (2020-2031) & (US$ Million)
Figure 46. Brazil Triangular Bandage Revenue Growth Rate (2020-2031) & (US$ Million)
Figure 47. Argentina Triangular Bandage Revenue Growth Rate (2020-2031) & (US$ Million)
Figure 48. Middle East and Africa Triangular Bandage Sales Market Share by Country (2020-2031)
Figure 49. Middle East and Africa Triangular Bandage Revenue Market Share by Country (2020-2031)
Figure 50. Turkey Triangular Bandage Revenue Growth Rate (2020-2031) & (US$ Million)
Figure 51. Saudi Arabia Triangular Bandage Revenue Growth Rate (2020-2031) & (US$ Million)
Figure 52. UAE Triangular Bandage Revenue Growth Rate (2020-2031) & (US$ Million)
Figure 53. Global Sales Market Share of Triangular Bandage by Type (2020-2031)
Figure 54. Global Revenue Market Share of Triangular Bandage by Type (2020-2031)
Figure 55. Global Triangular Bandage Price (US$/Unit) by Type (2020-2031)
Figure 56. Global Sales Market Share of Triangular Bandage by Application (2020-2031)
Figure 57. Global Revenue Market Share of Triangular Bandage by Application (2020-2031)
Figure 58. Global Triangular Bandage Price (US$/Unit) by Application (2020-2031)
Figure 59. Triangular Bandage Value Chain
Figure 60. Channels of Distribution (Direct Vs Distribution)
Figure 61. Bottom-up and Top-down Approaches for This Report
Figure 62. Data Triangulation
Figure 63. Key Executives Interviewed