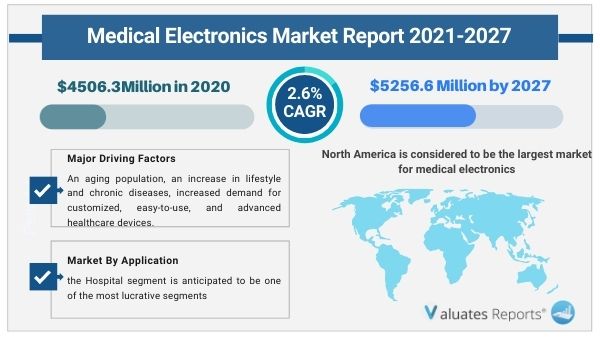
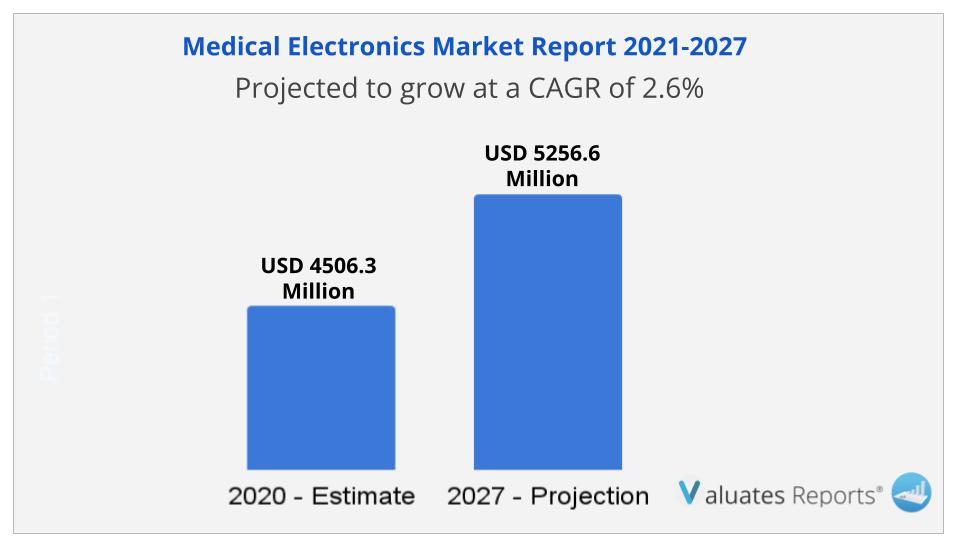
0
U.S. (TOLL FREE)
+1 (315) 215-3225
Automative

0
U.S. (TOLL FREE)
+1 (315) 215-3225
Global Medical Electronics Market Report, History and Forecast 2013-2025, Breakdown Data by Manufacturers, Key Regions, Types and Application
Published Date: January 2020
|
Report Code: QYRE-Othe-1G222
Home | Market Reports | Health
Medical Electronics Market
BUY CHAPTERS

Global Medical Electronics Market Report, History and Forecast 2013-2025, Breakdown Data by Manufacturers, Key Regions, Types and Application

Code: QYRE-Othe-1G222
Report
January 2020
Pages:128
QYResearch
Buy Now with 15% Discount
DESCRIPTION
TABLE OF CONTENT
TABLES & FIGURES

Medical Electronics Market 

The global Medical Electronics market was xx million US$ in 2017 and is expected to xx million US$ by the end of 2025, growing at a CAGR of xx% between 2018 and 2025.

This report studies the Medical Electronics market size (value and volume) by players, regions, product types and end industries, history data 2013-2017 and forecast data 2018-2025; This report also studies the global market competition landscape, market drivers and trends, opportunities and challenges, risks and entry barriers, sales channels, distributors and Porter's Five Forces Analysis.

The medical electronics market is expected to grow rapidly owing to factors such as rising ageing population and growing lifestyle diseases; rising demand for personalized, easy to use, and advanced healthcare devices.

Among all the geographic regions, North America is considered to be the largest market for medical electronics.

By Regions

  • North America (United States, Canada and Mexico)
  • Europe (Germany, UK, France, Italy, Russia and Turkey etc.)
  • Asia-Pacific (China, Japan, Korea, India, Australia, Indonesia, Thailand, Philippines, Malaysia and Vietnam)
  • South America (Brazil etc.)
  • Middle East and Africa (Egypt and GCC Countries)

Key Companies

  • Analog Devices
  • GE Healthcare
  • Texas Instruments
  • Stmicroelectronics
  • Nxp Semiconductors
  • Cypress Semiconductor
  • Fairchild Semiconductor International
  • Maxim Integrated Products
  • On Semiconductor
  • Renesas Electronics
  • Siemens
  • Philips Healthcare
  • Tekscan

By Product Type

  • Monitoring Equipment
  • Endoscopic
  • Heart Rate Regulator
  • Spinal Electrical Stimulation

By End Users

  • Diagnosis
  • Monitoring
  • Treatment

1 Medical Electronics Market Overview

    1.1 Medical Electronics Product Overview

    1.2 Medical Electronics Market Segment by Type

        1.2.1 Monitoring Equipment

        1.2.2 Endoscopic

        1.2.3 Heart Rate Regulator

        1.2.4 Spinal Electrical Stimulation

    1.3 Global Medical Electronics Market Size by Type

        1.3.1 Global Medical Electronics Sales and Growth by Type

        1.3.2 Global Medical Electronics Sales and Market Share by Type (2013-2018)

        1.3.3 Global Medical Electronics Revenue and Market Share by Type (2013-2018)

        1.3.4 Global Medical Electronics Price by Type (2013-2018)


2 Global Medical Electronics Market Competition by Company

    2.1 Global Medical Electronics Sales and Market Share by Company (2013-2018)

    2.2 Global Medical Electronics Revenue and Share by Company (2013-2018)

    2.3 Global Medical Electronics Price by Company (2013-2018)

    2.4 Global Top Players Medical Electronics Manufacturing Base Distribution, Sales Area, Product Types

    2.5 Medical Electronics Market Competitive Situation and Trends

        2.5.1 Medical Electronics Market Concentration Rate

        2.5.2 Global Medical Electronics Market Share of Top 5 and Top 10 Players

        2.5.3 Mergers & Acquisitions, Expansion


3 Medical Electronics Company Profiles and Sales Data

    3.1 Analog Devices

        3.1.1 Company Basic Information, Manufacturing Base and Competitors

        3.1.2 Medical Electronics Product Category, Application and Specification

        3.1.3 Analog Devices Medical Electronics Sales, Revenue, Price and Gross Margin(2013-2018)

        3.1.4 Main Business Overview

    3.2 GE Healthcare

        3.2.1 Company Basic Information, Manufacturing Base and Competitors

        3.2.2 Medical Electronics Product Category, Application and Specification

        3.2.3 GE Healthcare Medical Electronics Sales, Revenue, Price and Gross Margin(2013-2018)

        3.2.4 Main Business Overview

    3.3 Texas Instruments

        3.3.1 Company Basic Information, Manufacturing Base and Competitors

        3.3.2 Medical Electronics Product Category, Application and Specification

        3.3.3 Texas Instruments Medical Electronics Sales, Revenue, Price and Gross Margin(2013-2018)

        3.3.4 Main Business Overview

    3.4 Stmicroelectronics

        3.4.1 Company Basic Information, Manufacturing Base and Competitors

        3.4.2 Medical Electronics Product Category, Application and Specification

        3.4.3 Stmicroelectronics Medical Electronics Sales, Revenue, Price and Gross Margin(2013-2018)

        3.4.4 Main Business Overview

    3.5 Nxp Semiconductors

        3.5.1 Company Basic Information, Manufacturing Base and Competitors

        3.5.2 Medical Electronics Product Category, Application and Specification

        3.5.3 Nxp Semiconductors Medical Electronics Sales, Revenue, Price and Gross Margin(2013-2018)

        3.5.4 Main Business Overview

    3.6 Cypress Semiconductor

        3.6.1 Company Basic Information, Manufacturing Base and Competitors

        3.6.2 Medical Electronics Product Category, Application and Specification

        3.6.3 Cypress Semiconductor Medical Electronics Sales, Revenue, Price and Gross Margin(2013-2018)

        3.6.4 Main Business Overview

    3.7 Fairchild Semiconductor International

        3.7.1 Company Basic Information, Manufacturing Base and Competitors

        3.7.2 Medical Electronics Product Category, Application and Specification

        3.7.3 Fairchild Semiconductor International Medical Electronics Sales, Revenue, Price and Gross Margin(2013-2018)

        3.7.4 Main Business Overview

    3.8 Maxim Integrated Products

        3.8.1 Company Basic Information, Manufacturing Base and Competitors

        3.8.2 Medical Electronics Product Category, Application and Specification

        3.8.3 Maxim Integrated Products Medical Electronics Sales, Revenue, Price and Gross Margin(2013-2018)

        3.8.4 Main Business Overview

    3.9 On Semiconductor

        3.9.1 Company Basic Information, Manufacturing Base and Competitors

        3.9.2 Medical Electronics Product Category, Application and Specification

        3.9.3 On Semiconductor Medical Electronics Sales, Revenue, Price and Gross Margin(2013-2018)

        3.9.4 Main Business Overview

    3.10 Renesas Electronics

        3.10.1 Company Basic Information, Manufacturing Base and Competitors

        3.10.2 Medical Electronics Product Category, Application and Specification

        3.10.3 Renesas Electronics Medical Electronics Sales, Revenue, Price and Gross Margin(2013-2018)

        3.10.4 Main Business Overview

    3.11 Siemens

    3.12 Philips Healthcare

    3.13 Tekscan


4 Medical Electronics Market Status and Outlook by Regions

    4.1 Global Market Status and Outlook by Regions

        4.1.1 Global Medical Electronics Market Size and CAGR by Regions

        4.1.2 North America

        4.1.3 Asia-Pacific

        4.1.4 Europe

        4.1.5 South America

        4.1.6 Middle East and Africa

    4.2 Global Medical Electronics Sales and Revenue by Regions

        4.2.1 Global Medical Electronics Sales and Market Share by Regions (2013-2018)

        4.2.2 Global Medical Electronics Revenue and Market Share by Regions (2013-2018)

        4.2.3 Global Medical Electronics Sales, Revenue, Price and Gross Margin (2013-2018)

    4.3 North America Medical Electronics Sales, Revenue, Price and Gross Margin

        4.3.1 United States

        4.3.2 Canada

        4.3.3 Mexico

    4.4 Europe Medical Electronics Sales, Revenue, Price and Gross Margin

        4.4.1 Germany

        4.4.2 UK

        4.4.3 France

        4.4.4 Italy

        4.4.5 Russia

        4.4.6 Turkey

    4.5 Asia-Pacific Medical Electronics Sales, Revenue, Price and Gross Margin

        4.5.1 China

        4.5.2 Japan

        4.5.3 Korea

        4.5.4 Southeast Asia

            4.5.4.1 Indonesia

            4.5.4.2 Thailand

            4.5.4.3 Malaysia

            4.5.4.4 Philippines

            4.5.4.5 Vietnam

        4.5.5 India

        4.5.6 Australia

    4.6 South America Medical Electronics Sales, Revenue, Price and Gross Margin 

        4.6.1 Brazil

    4.7 Middle East and Africa Medical Electronics Sales, Revenue, Price and Gross Margin

        4.7.1 Egypt

        4.7.2 GCC Countries


5 Medical Electronics Application/End Users

    5.1 Medical Electronics Segment by Application

        5.1.1 Diagnosis

        5.1.2 Monitoring

        5.1.3 Treatment

    5.2 Global Medical Electronics Product Segment by Application

        5.2.1 Global Medical Electronics Sales by Application

        5.2.2 Global Medical Electronics Sales and Market Share by Application (2013-2018)


6 Global Medical Electronics Market Forecast

    6.1 Global Medical Electronics Sales, Revenue Forecast (2018-2025)

        6.1.1 Global Medical Electronics Sales and Growth Rate Forecast (2018-2025)

        6.1.1 Global Medical Electronics Revenue and Growth Rate Forecast (2018-2025)

    6.2 Global Medical Electronics Forecast by Regions

        6.2.1 North America Medical Electronics Sales and Revenue Forecast (2018-2025)

        6.2.2 Europe Medical Electronics Sales and Revenue Forecast (2018-2025)

        6.2.3 Asia-Pacific Medical Electronics Sales and Revenue Forecast (2018-2025)

            6.2.3.1 China

            6.2.3.2 Japan

            6.2.3.3 Korea

            6.2.3.4 Southeast Asia

            6.2.3.5 India

            6.2.3.6 Australia

        6.2.4 South America Medical Electronics Sales and Revenue Forecast (2018-2025)

        6.2.5 Middle East and Africa Medical Electronics Sales and Revenue Forecast (2018-2025)

            6.2.5.1 Egypt

            6.2.5.2 GCC Countries

    6.3 Medical Electronics Forecast by Type

        6.3.1 Global Medical Electronics Sales and Revenue Forecast by Type (2018-2025)

        6.3.2 Monitoring Equipment Gowth Forecast

        6.3.3 Endoscopic Gowth Forecast

    6.4 Medical Electronics Forecast by Application

        6.4.1 Global Medical Electronics Sales Forecast by Application (2018-2025)

        6.4.2 Global Medical Electronics Forecast in Diagnosis

        6.4.3 Global Medical Electronics Forecast in Monitoring


7 Medical Electronics Upstream Raw Materials

    7.1 Medical Electronics Key Raw Materials

        7.1.1 Key Raw Materials

        7.1.2 Key Raw Materials Price

        7.1.3 Raw Materials Key Suppliers 

    7.2 Manufacturing Cost Structure

        7.2.1 Raw Materials

        7.2.2 Labor Cost

        7.2.3 Manufacturing Expenses

    7.3 Medical Electronics Industrial Chain Analysis


8 Marketing Strategy Analysis, Distributors

    8.1 Marketing Channel

        8.1.1 Direct Marketing

        8.1.2 Indirect Marketing

        8.1.3 Marketing Channel Development Trend

    8.2 Distributors

    8.3 Downstream Customers


9 Research Findings and Conclusion


Appendix

    Methodology/Research Approach

        Research Programs/Design

        Market Size Estimation

        Market Breakdown and Data Triangulation

    Data Source

        Secondary Sources

        Primary Sources

    Disclaimer

Figure Medical Electronics Product Picture

Figure Global Medical Electronics Revenue (Million USD) Status and Outlook (2013-2025)

Figure Global Medical Electronics Sales (K Units) Status and Outlook (2013-2025)

Figure Product Picture of Monitoring Equipment

Table Major Players of Monitoring Equipment

Figure Global Monitoring Equipment Sales (K Units) and Growth Rate (%)(2013-2018)

Figure Product Picture of Endoscopic

Table Major Players of Endoscopic

Figure Global Endoscopic Sales (K Units) and Growth Rate (%)(2013-2018)

Figure Product Picture of Heart Rate Regulator

Table Major Players of Heart Rate Regulator

Figure Global Heart Rate Regulator Sales (K Units) and Growth Rate (%)(2013-2018)

Figure Product Picture of Spinal Electrical Stimulation

Table Major Players of Spinal Electrical Stimulation

Figure Global Spinal Electrical Stimulation Sales (K Units) and Growth Rate (%)(2013-2018)

Table Global Medical Electronics Sales (K Units) and Growth Rate (%) Comparison by Type

Table Global Medical Electronics Sales (K Units) by Type (2013-2018)

Table Global Medical Electronics Sales Share (%) by Type (2013-2018)

Figure Global Medical Electronics Sales Market Share (%) by Type (2013-2018)

Figure Global Medical Electronics Sales Market Share (%) by Type in 2017

Table Global Medical Electronics Revenue (Million USD) by Type (2013-2018)

Table Global Medical Electronics Revenue Share (%) by Type (2013-2018)

Figure Global Medical Electronics Revenue Share (%) by Type (2013-2018)

Figure 2017 Global Medical Electronics Revenue Market Share (%) by Type

Table Global Medical Electronics Price (USD/Unit) by Type (2013-2018)

Table Global Medical Electronics Sales (K Units) by Company (2013-2018)

Table Global Medical Electronics Sales Share (%) by Company (2013-2018)

Figure Global Medical Electronics Sales Share (%) by Company in 2017

Table Global Medical Electronics Revenue (Million USD) by Company (2013-2018)

Table Global Medical Electronics Revenue Share (%) by Company (2013-2018)

Figure Global Medical Electronics Revenue Share (%) by Company in 2017

Table Global Market Medical Electronics Average Price (USD/Unit) by Company (2013-2018)

Table Global Medical Electronics Top Players Manufacturing Base Distribution and Sales Area

Table Global Medical Electronics Top Players Product Category

Figure Global Medical Electronics Market Share (%) of Top 5 Players

Figure Global Medical Electronics Market Share (%) of Top 10 Players

Table Analog Devices Basic Information List

Table Analog Devices Medical Electronics Product Category, Application and Specification

Table Analog Devices Medical Electronics Sales (K Units), Revenue (Million USD), Price (USD/Unit) and Gross Margin (%)(2013-2018)

Figure Analog Devices Medical Electronics Sales Growth Rate (2013-2018)

Figure Analog Devices Medical Electronics Sales Global Market Share (%)(2013-2018)

Table GE Healthcare Basic Information List

Figure GE Healthcare Medical Electronics Product Category, Application and Specification

Table GE Healthcare Medical Electronics Sales (K Units), Revenue (Million USD), Price (USD/Unit) and Gross Margin (%)(2013-2018)

Figure GE Healthcare Medical Electronics Sales Growth Rate (2013-2018)

Figure GE Healthcare Medical Electronics Sales Global Market Share (%)(2013-2018)

Table Texas Instruments Basic Information List

Figure Texas Instruments Medical Electronics Product Category, Application and Specification

Table Texas Instruments Medical Electronics Sales (K Units), Revenue (Million USD), Price (USD/Unit) and Gross Margin (%)(2013-2018)

Figure Texas Instruments Medical Electronics Sales Growth Rate (2013-2018)

Figure Texas Instruments Medical Electronics Sales Global Market Share (%)(2013-2018)

Table Stmicroelectronics Basic Information List

Figure Stmicroelectronics Medical Electronics Product Category, Application and Specification

Table Stmicroelectronics Medical Electronics Sales (K Units), Revenue (Million USD), Price (USD/Unit) and Gross Margin (%)(2013-2018)

Figure Stmicroelectronics Medical Electronics Sales Growth Rate (2013-2018)

Figure Stmicroelectronics Medical Electronics Sales Global Market Share (%)(2013-2018)

Table Nxp Semiconductors Basic Information List

Figure Nxp Semiconductors Medical Electronics Product Category, Application and Specification

Table Nxp Semiconductors Medical Electronics Sales (K Units), Revenue (Million USD), Price (USD/Unit) and Gross Margin (%)(2013-2018)

Figure Nxp Semiconductors Medical Electronics Sales Growth Rate (2013-2018)

Figure Nxp Semiconductors Medical Electronics Sales Global Market Share (%)(2013-2018)

Table Cypress Semiconductor Basic Information List

Figure Cypress Semiconductor Medical Electronics Product Category, Application and Specification

Table Cypress Semiconductor Medical Electronics Sales (K Units), Revenue (Million USD), Price (USD/Unit) and Gross Margin (%)(2013-2018)

Figure Cypress Semiconductor Medical Electronics Sales Growth Rate (2013-2018)

Figure Cypress Semiconductor Medical Electronics Sales Global Market Share (%)(2013-2018)

Table Fairchild Semiconductor International Basic Information List

Figure Fairchild Semiconductor International Medical Electronics Product Category, Application and Specification

Table Fairchild Semiconductor International Medical Electronics Sales (K Units), Revenue (Million USD), Price (USD/Unit) and Gross Margin (%)(2013-2018)

Figure Fairchild Semiconductor International Medical Electronics Sales Growth Rate (2013-2018)

Figure Fairchild Semiconductor International Medical Electronics Sales Global Market Share (%)(2013-2018)

Table Maxim Integrated Products Basic Information List

Figure Maxim Integrated Products Medical Electronics Product Category, Application and Specification

Table Maxim Integrated Products Medical Electronics Sales (K Units), Revenue (Million USD), Price (USD/Unit) and Gross Margin (%)(2013-2018)

Figure Maxim Integrated Products Medical Electronics Sales Growth Rate (2013-2018)

Figure Maxim Integrated Products Medical Electronics Sales Global Market Share (%)(2013-2018)

Table On Semiconductor Basic Information List

Figure On Semiconductor Medical Electronics Product Category, Application and Specification

Table On Semiconductor Medical Electronics Sales (K Units), Revenue (Million USD), Price (USD/Unit) and Gross Margin (%)(2013-2018)

Figure On Semiconductor Medical Electronics Sales Growth Rate (2013-2018)

Figure On Semiconductor Medical Electronics Sales Global Market Share (%)(2013-2018)

Table Renesas Electronics Basic Information List

Figure Renesas Electronics Medical Electronics Product Category, Application and Specification

Table Renesas Electronics Medical Electronics Sales (K Units), Revenue (Million USD), Price (USD/Unit) and Gross Margin (%)(2013-2018)

Figure Renesas Electronics Medical Electronics Sales Growth Rate (2013-2018)

Figure Renesas Electronics Medical Electronics Sales Global Market Share (%)(2013-2018)

Table Siemens Basic Information List

Table Philips Healthcare Basic Information List

Table Tekscan Basic Information List

Table Global Medical Electronics Market Size Comparison by Regions (2013-2025)

Figure North America Medical Electronics Revenue (Million USD) and Growth Rate (%)(2013-2025)

Figure Asia-Pacific Medical Electronics Revenue (Million USD) and Growth Rate (%)(2013-2025)

Figure Europe Medical Electronics Revenue (Million USD) and Growth Rate (%)(2013-2025)

Figure South America Medical Electronics Revenue (Million USD) and Growth Rate (%)(2013-2025)

Figure Middle East and Africa Medical Electronics Revenue (Million USD) and Growth Rate (%)(2013-2025)

Table Global Medical Electronics Sales (K Units) by Regions (2013-2018)

Table Global Medical Electronics Sales Market Share (%) by Regions (2013-2018)

Figure Global Medical Electronics Sales Market Share (%) by Regions (2013-2018)

Figure 2017 Global Medical Electronics Sales Market Share (%) by Regions

Table Global Medical Electronics Revenue (Million USD) by Regions (2013-2018)

Table Global Medical Electronics Revenue Market Share (%) by Regions (2013-2018)

Figure Global Medical Electronics Revenue Market Share (%) by Regions (2013-2018)

Figure 2017 Global Medical Electronics Revenue Market Share (%) by Regions

Table Global Medical Electronics Sales (K Units), Revenue (Million USD), Price (USD/Unit) and Gross Margin (%)(2013-2018)

Figure North America Medical Electronics Sales Growth Rate

Table North America Medical Electronics Sales (K Units), Revenue (Million USD), Price (USD/Unit) and Gross Margin (%)(2013-2018)

Figure United States Medical Electronics Sales (K Units)(2013-2018)

Figure United States Medical Electronics Revenue (Million USD)(2013-2018)

Figure Canada Medical Electronics Sales (K Units)(2013-2018)

Figure Canada Medical Electronics Revenue (Million USD)(2013-2018)

Figure Mexico Medical Electronics Sales (K Units)(2013-2018)

Figure Mexico Medical Electronics Revenue (Million USD)(2013-2018)

Figure Europe Medical Electronics Sales Growth Rate

Table Europe Medical Electronics Sales (K Units), Revenue (Million USD), Price (USD/Unit) and Gross Margin (%)(2013-2018)

Figure Germany Medical Electronics Sales (K Units)(2013-2018)

Figure Germany Medical Electronics Revenue (Million USD) (2013-2018)

Figure UK Medical Electronics Sales (K Units)(2013-2018)

Figure UK Medical Electronics Revenue (Million USD)(2013-2018)

Figure France Medical Electronics Sales (K Units)(2013-2018)

Figure France Medical Electronics Revenue (Million USD)(2013-2018)

Figure Italy Medical Electronics Sales (K Units)(2013-2018)

Figure Italy Medical Electronics Revenue (Million USD)(2013-2018)

Figure Russia Medical Electronics Sales (K Units)(2013-2018)

Figure Russia Medical Electronics Revenue (Million USD)(2013-2018)

Figure Turkey Medical Electronics Sales (K Units)(2013-2018)

Figure Turkey Medical Electronics Revenue (Million USD)(2013-2018)

Figure Asia-Pacific Medical Electronics Sales Growth Rate

Table Asia-Pacific Medical Electronics Sales (K Units), Revenue (Million USD), Price (USD/Unit) and Gross Margin (%)(2013-2018)

Figure China Medical Electronics Sales (K Units)(2013-2018)

Figure China Medical Electronics Revenue (Million USD)(2013-2018)

Figure Japan Medical Electronics Sales (K Units)(2013-2018)

Figure Japan Medical Electronics Revenue (Million USD)(2013-2018)

Figure Korea Medical Electronics Sales (K Units)(2013-2018)

Figure Korea Medical Electronics Revenue (Million USD)(2013-2018)

Figure Southeast Asia Medical Electronics Sales (K Units)(2013-2018)

Figure Southeast Asia Medical Electronics Revenue (Million USD)(2013-2018)

Figure Indonesia Medical Electronics Sales (K Units)(2013-2018)

Figure Indonesia Medical Electronics Revenue (Million USD)(2013-2018)

Figure Thailand Medical Electronics Sales (K Units)(2013-2018)

Figure Thailand Medical Electronics Revenue (Million USD)(2013-2018)

Figure Malaysia Medical Electronics Sales (K Units)(2013-2018)

Figure Malaysia Medical Electronics Revenue (Million USD)(2013-2018)

Figure Philippines Medical Electronics Sales (K Units)(2013-2018)

Figure Philippines Medical Electronics Revenue (Million USD)(2013-2018)

Figure Vietnam Medical Electronics Sales (K Units)(2013-2018)

Figure Vietnam Medical Electronics Revenue (Million USD)(2013-2018)

Figure India Medical Electronics Sales (K Units)(2013-2018)

Figure India Medical Electronics Revenue (Million USD)(2013-2018)

Figure Australia Medical Electronics Sales (K Units)(2013-2018)

Figure Australia Medical Electronics Revenue (Million USD)(2013-2018)

Figure South America Medical Electronics Sales Growth Rate

Table South America Medical Electronics Sales (K Units), Revenue (Million USD), Price (USD/Unit) and Gross Margin (%)(2013-2018)

Figure Brazil Medical Electronics Sales (K Units)(2013-2018)

Figure Brazil Medical Electronics Revenue (Million USD)(2013-2018)

Figure Middle East and Africa Medical Electronics Sales Growth Rate

Table Middle East and Africa Medical Electronics Sales (K Units), Revenue (Million USD), Price (USD/Unit) and Gross Margin (%)(2013-2018)

Figure North Africa Medical Electronics Sales (K Units)(2013-2018)

Figure North Africa Medical Electronics Revenue (Million USD)(2013-2018)

Figure GCC Countries Medical Electronics Sales (K Units)(2013-2018)

Figure GCC Countries Medical Electronics Revenue (Million USD)(2013-2018)

Figure Diagnosis Examples

Figure Monitoring Examples

Figure Treatment Examples

Table Global Medical Electronics Sales (K Units) Comparison by Application (2013-2025)

Table Global Medical Electronics Sales (K Units) by Application (2013-2018)

Table Global Medical Electronics Sales Share (%) by Application (2013-2018)

Figure Global Medical Electronics Sales Market Share (%) by Application (2013-2018)

Figure Global Medical Electronics Sales Market Share (%) by Application in 2017

Figure Global Medical Electronics Sales (K Units) and Growth Rate (%) Forecast (2018-2025)

Figure Global Medical Electronics Revenue (Million USD) and Growth Rate (%) Forecast (2018-2025)

Table Global Medical Electronics Sales (K Units) Forecast by Regions (2018-2025)

Figure Global Medical Electronics Sales Market Share (%) Forecast by Regions (2018-2025)

Figure North America Medical Electronics Sales (K Units) and Growth Rate (%) Forecast (2018-2025)

Figure North America Medical Electronics Revenue and Growth Rate (%) Forecast (2018-2025)

Figure Europe Medical Electronics Sales (K Units) and Growth Rate (%) Forecast (2018-2025)

Figure Europe Medical Electronics Revenue and Growth Rate (%) Forecast (2018-2025)

Figure Asia-Pacific Medical Electronics Sales (K Units) and Growth Rate (%) Forecast (2018-2025)

Figure Asia-Pacific Medical Electronics Revenue and Growth Rate (%) Forecast (2018-2025)

Figure China Medical Electronics Sales (K Units) and Growth Rate (%) Forecast (2018-2025)

Figure China Medical Electronics Revenue and Growth Rate (%) Forecast (2018-2025)

Figure Japan Medical Electronics Sales (K Units) and Growth Rate (%) Forecast (2018-2025)

Figure Japan Medical Electronics Revenue and Growth Rate (%) Forecast (2018-2025)

Figure Korea Medical Electronics Sales (K Units) and Growth Rate (%) Forecast (2018-2025)

Figure Korea Medical Electronics Revenue and Growth Rate (%) Forecast (2018-2025)

Figure Southeast Asia Medical Electronics Sales (K Units) and Growth Rate (%) Forecast (2018-2025)

Figure Southeast Asia Medical Electronics Revenue and Growth Rate (%) Forecast (2018-2025)

Figure India Medical Electronics Sales (K Units) and Growth Rate (%) Forecast (2018-2025)

Figure India Medical Electronics Revenue and Growth Rate (%) Forecast (2018-2025)

Figure Australia Medical Electronics Sales (K Units) and Growth Rate (%) Forecast (2018-2025)

Figure Australia Medical Electronics Revenue and Growth Rate (%) Forecast (2018-2025)

Figure South America Medical Electronics Sales (K Units) and Growth Rate (%) Forecast (2018-2025)

Figure South America Medical Electronics Revenue and Growth Rate (%) Forecast (2018-2025)

Figure Middle East and Africa Medical Electronics Sales (K Units) and Growth Rate (%) Forecast (2018-2025)

Figure Middle East and Africa Medical Electronics Revenue and Growth Rate (%) Forecast (2018-2025)

Figure North Africa Medical Electronics Sales (K Units) and Growth Rate (%) Forecast (2018-2025)

Figure North Africa Medical Electronics Revenue and Growth Rate (%) Forecast (2018-2025)

Figure GCC Countries Medical Electronics Sales (K Units) and Growth Rate (%) Forecast (2018-2025)

Figure GCC Countries Medical Electronics Revenue and Growth Rate (%) Forecast (2018-2025)

Table Global Medical Electronics Sales (Million USD) Forecast by Type (2018-2025)

Figure Global Medical Electronics Sales Market Share (%) Forecast by Type (2018-2025)

Table Global Medical Electronics Revenue (Million USD) Forecast by Type (2018-2025)

Figure Global Medical Electronics Revenue Market Share (%) Forecast by Type (2018-2025)

Figure Monitoring Equipment Sales Growth Forecast

Figure Endoscopic Sales Growth Forecast

Table Global Medical Electronics Sales (K Units) Forecast by Application (2018-2025)

Figure Global Medical Electronics Sales Forecast by Application (2018-2025)

Figure Global Medical Electronics Sales (K Units) Forecast in Diagnosis

Figure Global Medical Electronics Sales (K Units) Forecast in Monitoring

Table Key Raw Materials Lists

Figure Key Raw Materials Price

Table Raw Materials Key Suppliers Lists

Figure Medical Electronics Manufacturing Cost Structure

Figure Medical Electronics Industrial Chain Analysis

Table Distributors List

Table Medical Electronics Downstream Customers

SELECT A FORMAT
Added to Cart
Electronic (PDF)

$3350

This license allows only one user to access the PDF.
Electronic (PDF)

$6700

This license allows users/teams in a same Enterprise to use this report, various departments within an enterpise can use this report
Add to Cart
Buy Now (15% Discount)

OUR CUSTOMER

Seventh Sense AI

SIMILAR REPORTS


RELATED REPORTS

Global Trolley-Mounted Colon Hydrotherapy Unit Market Research Report 2024

120 Pages
Type: Report
Code: QYRE-Auto-18J13482
Thu Mar 28 00:00:00 UTC 2024

Add to Cart

Global Paroxetine Hydrochloride Tablet Market Research Report 2024

120 Pages
Type: Report
Code: QYRE-Auto-36M7629
Thu Mar 28 00:00:00 UTC 2024

Add to Cart

Global Bacteria Test Kit Market Research Report 2024

120 Pages
Type: Report
Code: QYRE-Auto-26R7589
Thu Mar 28 00:00:00 UTC 2024

Add to Cart

Global Felodipine Sustained-Release Tablet Market Research Report 2024

120 Pages
Type: Report
Code: QYRE-Auto-36A7630
Thu Mar 28 00:00:00 UTC 2024

Add to Cart