List of Tables
Table 1. Global Hand Pump Market Value by Type (US$ Million), 2025 vs 2032
Table 2. Global Hand Pump Market Value by Application (US$ Million), 2025 vs 2032
Table 3. Global Hand Pump Production Capacity (K Units) by Manufacturers in 2025
Table 4. Global Hand Pump Production by Manufacturers (K Units), 2021–2026
Table 5. Global Hand Pump Production Market Share by Manufacturers (2021–2026)
Table 6. Global Hand Pump Production Value by Manufacturers (US$ Million), 2021–2026
Table 7. Global Hand Pump Production Value Share by Manufacturers (2021–2026)
Table 8. Global Key Players of Hand Pump, Industry Ranking, 2024 vs 2025
Table 9. Classification of Companies by Tier (Tier 1, Tier 2, Tier 3), based on Hand Pump Production Value, 2025
Table 10. Global Market Hand Pump Average Price by Manufacturers (USD/Unit), 2021–2026
Table 11. Global Key Manufacturers of Hand Pump, Manufacturing Footprints and Headquarters
Table 12. Global Key Manufacturers of Hand Pump, Product Offerings and Applications
Table 13. Global Key Manufacturers of Hand Pump, Date of Entry into the Industry
Table 14. Global Hand Pump Manufacturers Market Concentration Ratio (CR5 and HHI)
Table 15. Mergers & Acquisitions and Expansion Plans
Table 16. Global Hand Pump Production Value by Region: 2021 vs 2025 vs 2032 (US$ Million)
Table 17. Global Hand Pump Production Value (US$ Million) by Region (2021–2026)
Table 18. Global Hand Pump Production Value Market Share by Region (2021–2026)
Table 19. Global Hand Pump Production Value (US$ Million) Forecast by Region (2027–2032)
Table 20. Global Hand Pump Production Value Market Share Forecast by Region (2027–2032)
Table 21. Global Hand Pump Production Comparison by Region: 2021 vs 2025 vs 2032 (K Units)
Table 22. Global Hand Pump Production (K Units) by Region (2021–2026)
Table 23. Global Hand Pump Production Market Share by Region (2021–2026)
Table 24. Global Hand Pump Production (K Units) Forecast by Region (2027–2032)
Table 25. Global Hand Pump Production Market Share Forecast by Region (2027–2032)
Table 26. Global Hand Pump Market Average Price (USD/Unit) by Region (2021–2026)
Table 27. Global Hand Pump Market Average Price (USD/Unit) by Region (2027–2032)
Table 28. Global Hand Pump Consumption Growth Rate by Region: 2021 vs 2025 vs 2032 (K Units)
Table 29. Global Hand Pump Consumption by Region (K Units), 2021–2026
Table 30. Global Hand Pump Consumption Market Share by Region (2021–2026)
Table 31. Global Hand Pump Forecasted Consumption by Region (K Units), 2027–2032
Table 32. Global Hand Pump Forecasted Consumption Market Share by Region (2027–2032)
Table 33. North America Hand Pump Consumption Growth Rate by Country: 2021 vs 2025 vs 2032 (K Units)
Table 34. North America Hand Pump Consumption by Country (K Units), 2021–2026
Table 35. North America Hand Pump Consumption by Country (K Units), 2027–2032
Table 36. Europe Hand Pump Consumption Growth Rate by Country: 2021 vs 2025 vs 2032 (K Units)
Table 37. Europe Hand Pump Consumption by Country (K Units), 2021–2026
Table 38. Europe Hand Pump Consumption by Country (K Units), 2027–2032
Table 39. Asia Pacific Hand Pump Consumption Growth Rate by Region: 2021 vs 2025 vs 2032 (K Units)
Table 40. Asia Pacific Hand Pump Consumption by Region (K Units), 2021–2026
Table 41. Asia Pacific Hand Pump Consumption by Region (K Units), 2027–2032
Table 42. Latin America, Middle East & Africa Hand Pump Consumption Growth Rate by Country: 2021 vs 2025 vs 2032 (K Units)
Table 43. Latin America, Middle East & Africa Hand Pump Consumption by Country (K Units), 2021–2026
Table 44. Latin America, Middle East & Africa Hand Pump Consumption by Country (K Units), 2027–2032
Table 45. Global Hand Pump Production (K Units) by Type (2021–2026)
Table 46. Global Hand Pump Production (K Units) by Type (2027–2032)
Table 47. Global Hand Pump Production Market Share by Type (2021–2026)
Table 48. Global Hand Pump Production Market Share by Type (2027–2032)
Table 49. Global Hand Pump Production Value (US$ Million) by Type (2021–2026)
Table 50. Global Hand Pump Production Value (US$ Million) by Type (2027–2032)
Table 51. Global Hand Pump Production Value Market Share by Type (2021–2026)
Table 52. Global Hand Pump Production Value Market Share by Type (2027–2032)
Table 53. Global Hand Pump Price (USD/Unit) by Type (2021–2026)
Table 54. Global Hand Pump Price (USD/Unit) by Type (2027–2032)
Table 55. Global Hand Pump Production (K Units) by Application (2021–2026)
Table 56. Global Hand Pump Production (K Units) by Application (2027–2032)
Table 57. Global Hand Pump Production Market Share by Application (2021–2026)
Table 58. Global Hand Pump Production Market Share by Application (2027–2032)
Table 59. Global Hand Pump Production Value (US$ Million) by Application (2021–2026)
Table 60. Global Hand Pump Production Value (US$ Million) by Application (2027–2032)
Table 61. Global Hand Pump Production Value Market Share by Application (2021–2026)
Table 62. Global Hand Pump Production Value Market Share by Application (2027–2032)
Table 63. Global Hand Pump Price (USD/Unit) by Application (2021–2026)
Table 64. Global Hand Pump Price (USD/Unit) by Application (2027–2032)
Table 65. Gorman-Rupp Hand Pump Company Information
Table 66. Gorman-Rupp Hand Pump Specification and Application
Table 67. Gorman-Rupp Hand Pump Production (K Units), Value (US$ Million), Price (USD/Unit) and Gross Margin (2021–2026)
Table 68. Gorman-Rupp Main Business and Markets Served
Table 69. Gorman-Rupp Recent Developments/Updates
Table 70. Zep Hand Pump Company Information
Table 71. Zep Hand Pump Specification and Application
Table 72. Zep Hand Pump Production (K Units), Value (US$ Million), Price (USD/Unit) and Gross Margin (2021–2026)
Table 73. Zep Main Business and Markets Served
Table 74. Zep Recent Developments/Updates
Table 75. National Spencer Hand Pump Company Information
Table 76. National Spencer Hand Pump Specification and Application
Table 77. National Spencer Hand Pump Production (K Units), Value (US$ Million), Price (USD/Unit) and Gross Margin (2021–2026)
Table 78. National Spencer Main Business and Markets Served
Table 79. National Spencer Recent Developments/Updates
Table 80. ATD Tools Hand Pump Company Information
Table 81. ATD Tools Hand Pump Specification and Application
Table 82. ATD Tools Hand Pump Production (K Units), Value (US$ Million), Price (USD/Unit) and Gross Margin (2021–2026)
Table 83. ATD Tools Main Business and Markets Served
Table 84. ATD Tools Recent Developments/Updates
Table 85. GoatThroat Hand Pump Company Information
Table 86. GoatThroat Hand Pump Specification and Application
Table 87. GoatThroat Hand Pump Production (K Units), Value (US$ Million), Price (USD/Unit) and Gross Margin (2021–2026)
Table 88. GoatThroat Main Business and Markets Served
Table 89. GoatThroat Recent Developments/Updates
Table 90. Action Pump Hand Pump Company Information
Table 91. Action Pump Hand Pump Specification and Application
Table 92. Action Pump Hand Pump Production (K Units), Value (US$ Million), Price (USD/Unit) and Gross Margin (2021–2026)
Table 93. Action Pump Main Business and Markets Served
Table 94. Action Pump Recent Developments/Updates
Table 95. Tuthill Hand Pump Company Information
Table 96. Tuthill Hand Pump Specification and Application
Table 97. Tuthill Hand Pump Production (K Units), Value (US$ Million), Price (USD/Unit) and Gross Margin (2021–2026)
Table 98. Tuthill Main Business and Markets Served
Table 99. Tuthill Recent Developments/Updates
Table 100. Pump Hand Pump Company Information
Table 101. Pump Hand Pump Specification and Application
Table 102. Pump Hand Pump Production (K Units), Value (US$ Million), Price (USD/Unit) and Gross Margin (2021–2026)
Table 103. Pump Main Business and Markets Served
Table 104. Pump Recent Developments/Updates
Table 105. Graco Hand Pump Company Information
Table 106. Graco Hand Pump Specification and Application
Table 107. Graco Hand Pump Production (K Units), Value (US$ Million), Price (USD/Unit) and Gross Margin (2021–2026)
Table 108. Graco Main Business and Markets Served
Table 109. Graco Recent Developments/Updates
Table 110. Macnaught Hand Pump Company Information
Table 111. Macnaught Hand Pump Specification and Application
Table 112. Macnaught Hand Pump Production (K Units), Value (US$ Million), Price (USD/Unit) and Gross Margin (2021–2026)
Table 113. Macnaught Main Business and Markets Served
Table 114. Macnaught Recent Developments/Updates
Table 115. Jessberger Hand Pump Company Information
Table 116. Jessberger Hand Pump Specification and Application
Table 117. Jessberger Hand Pump Production (K Units), Value (US$ Million), Price (USD/Unit) and Gross Margin (2021–2026)
Table 118. Jessberger Main Business and Markets Served
Table 119. Jessberger Recent Developments/Updates
Table 120. Kyoritsu kiko Hand Pump Company Information
Table 121. Kyoritsu kiko Hand Pump Specification and Application
Table 122. Kyoritsu kiko Hand Pump Production (K Units), Value (US$ Million), Price (USD/Unit) and Gross Margin (2021–2026)
Table 123. Kyoritsu kiko Main Business and Markets Served
Table 124. Kyoritsu kiko Recent Developments/Updates
Table 125. GROVHAC Hand Pump Company Information
Table 126. GROVHAC Hand Pump Specification and Application
Table 127. GROVHAC Hand Pump Production (K Units), Value (US$ Million), Price (USD/Unit) and Gross Margin (2021–2026)
Table 128. GROVHAC Main Business and Markets Served
Table 129. GROVHAC Recent Developments/Updates
Table 130. AMBICA MACHINE Hand Pump Company Information
Table 131. AMBICA MACHINE Hand Pump Specification and Application
Table 132. AMBICA MACHINE Hand Pump Production (K Units), Value (US$ Million), Price (USD/Unit) and Gross Margin (2021–2026)
Table 133. AMBICA MACHINE Main Business and Markets Served
Table 134. AMBICA MACHINE Recent Developments/Updates
Table 135. Great Plains Hand Pump Company Information
Table 136. Great Plains Hand Pump Specification and Application
Table 137. Great Plains Hand Pump Production (K Units), Value (US$ Million), Price (USD/Unit) and Gross Margin (2021–2026)
Table 138. Great Plains Main Business and Markets Served
Table 139. Great Plains Recent Developments/Updates
Table 140. Vestil Hand Pump Company Information
Table 141. Vestil Hand Pump Specification and Application
Table 142. Vestil Hand Pump Production (K Units), Value (US$ Million), Price (USD/Unit) and Gross Margin (2021–2026)
Table 143. Vestil Main Business and Markets Served
Table 144. Vestil Recent Developments/Updates
Table 145. Pro Chem Hand Pump Company Information
Table 146. Pro Chem Hand Pump Specification and Application
Table 147. Pro Chem Hand Pump Production (K Units), Value (US$ Million), Price (USD/Unit) and Gross Margin (2021–2026)
Table 148. Pro Chem Main Business and Markets Served
Table 149. Pro Chem Recent Developments/Updates
Table 150. Toyo Hand Pump Company Information
Table 151. Toyo Hand Pump Specification and Application
Table 152. Toyo Hand Pump Production (K Units), Value (US$ Million), Price (USD/Unit) and Gross Margin (2021–2026)
Table 153. Toyo Main Business and Markets Served
Table 154. Toyo Recent Developments/Updates
Table 155. Groz Hand Pump Company Information
Table 156. Groz Hand Pump Specification and Application
Table 157. Groz Hand Pump Production (K Units), Value (US$ Million), Price (USD/Unit) and Gross Margin (2021–2026)
Table 158. Groz Main Business and Markets Served
Table 159. Groz Recent Developments/Updates
Table 160. Jaan-Huei Hand Pump Company Information
Table 161. Jaan-Huei Hand Pump Specification and Application
Table 162. Jaan-Huei Hand Pump Production (K Units), Value (US$ Million), Price (USD/Unit) and Gross Margin (2021–2026)
Table 163. Jaan-Huei Main Business and Markets Served
Table 164. Jaan-Huei Recent Developments/Updates
Table 165. New Zealand Hand Pump Company Information
Table 166. New Zealand Hand Pump Specification and Application
Table 167. New Zealand Hand Pump Production (K Units), Value (US$ Million), Price (USD/Unit) and Gross Margin (2021–2026)
Table 168. New Zealand Main Business and Markets Served
Table 169. New Zealand Recent Developments/Updates
Table 170. Alemite Hand Pump Company Information
Table 171. Alemite Hand Pump Specification and Application
Table 172. Alemite Hand Pump Production (K Units), Value (US$ Million), Price (USD/Unit) and Gross Margin (2021–2026)
Table 173. Alemite Main Business and Markets Served
Table 174. Alemite Recent Developments/Updates
Table 175. Xylem Hand Pump Company Information
Table 176. Xylem Hand Pump Specification and Application
Table 177. Xylem Hand Pump Production (K Units), Value (US$ Million), Price (USD/Unit) and Gross Margin (2021–2026)
Table 178. Xylem Main Business and Markets Served
Table 179. Xylem Recent Developments/Updates
Table 180. ENERPAC Hand Pump Company Information
Table 181. ENERPAC Hand Pump Specification and Application
Table 182. ENERPAC Hand Pump Production (K Units), Value (US$ Million), Price (USD/Unit) and Gross Margin (2021–2026)
Table 183. ENERPAC Main Business and Markets Served
Table 184. ENERPAC Recent Developments/Updates
Table 185. ITH Hand Pump Company Information
Table 186. ITH Hand Pump Specification and Application
Table 187. ITH Hand Pump Production (K Units), Value (US$ Million), Price (USD/Unit) and Gross Margin (2021–2026)
Table 188. ITH Main Business and Markets Served
Table 189. ITH Recent Developments/Updates
Table 190. SCHAAF Hand Pump Company Information
Table 191. SCHAAF Hand Pump Specification and Application
Table 192. SCHAAF Hand Pump Production (K Units), Value (US$ Million), Price (USD/Unit) and Gross Margin (2021–2026)
Table 193. SCHAAF Main Business and Markets Served
Table 194. SCHAAF Recent Developments/Updates
Table 195. Ralston Instruments Hand Pump Company Information
Table 196. Ralston Instruments Hand Pump Specification and Application
Table 197. Ralston Instruments Hand Pump Production (K Units), Value (US$ Million), Price (USD/Unit) and Gross Margin (2021–2026)
Table 198. Ralston Instruments Main Business and Markets Served
Table 199. Ralston Instruments Recent Developments/Updates
Table 200. Prince Manufacturing Hand Pump Company Information
Table 201. Prince Manufacturing Hand Pump Specification and Application
Table 202. Prince Manufacturing Hand Pump Production (K Units), Value (US$ Million), Price (USD/Unit) and Gross Margin (2021–2026)
Table 203. Prince Manufacturing Main Business and Markets Served
Table 204. Prince Manufacturing Recent Developments/Updates
Table 205. BRAND Hand Pump Company Information
Table 206. BRAND Hand Pump Specification and Application
Table 207. BRAND Hand Pump Production (K Units), Value (US$ Million), Price (USD/Unit) and Gross Margin (2021–2026)
Table 208. BRAND Main Business and Markets Served
Table 209. BRAND Recent Developments/Updates
Table 210. Werner Weitner Hand Pump Company Information
Table 211. Werner Weitner Hand Pump Specification and Application
Table 212. Werner Weitner Hand Pump Production (K Units), Value (US$ Million), Price (USD/Unit) and Gross Margin (2021–2026)
Table 213. Werner Weitner Main Business and Markets Served
Table 214. Werner Weitner Recent Developments/Updates
Table 215. Gardner Bender Hand Pump Company Information
Table 216. Gardner Bender Hand Pump Specification and Application
Table 217. Gardner Bender Hand Pump Production (K Units), Value (US$ Million), Price (USD/Unit) and Gross Margin (2021–2026)
Table 218. Gardner Bender Main Business and Markets Served
Table 219. Gardner Bender Recent Developments/Updates
Table 220. Zhongcheng Pump Industry Hand Pump Company Information
Table 221. Zhongcheng Pump Industry Hand Pump Specification and Application
Table 222. Zhongcheng Pump Industry Hand Pump Production (K Units), Value (US$ Million), Price (USD/Unit) and Gross Margin (2021–2026)
Table 223. Zhongcheng Pump Industry Main Business and Markets Served
Table 224. Zhongcheng Pump Industry Recent Developments/Updates
Table 225. Shanghai Bosheng Pumps Hand Pump Company Information
Table 226. Shanghai Bosheng Pumps Hand Pump Specification and Application
Table 227. Shanghai Bosheng Pumps Hand Pump Production (K Units), Value (US$ Million), Price (USD/Unit) and Gross Margin (2021–2026)
Table 228. Shanghai Bosheng Pumps Main Business and Markets Served
Table 229. Shanghai Bosheng Pumps Recent Developments/Updates
Table 230. Shanghai Yangguang Pump Hand Pump Company Information
Table 231. Shanghai Yangguang Pump Hand Pump Specification and Application
Table 232. Shanghai Yangguang Pump Hand Pump Production (K Units), Value (US$ Million), Price (USD/Unit) and Gross Margin (2021–2026)
Table 233. Shanghai Yangguang Pump Main Business and Markets Served
Table 234. Shanghai Yangguang Pump Recent Developments/Updates
Table 235. Hongyun Safetytools Hand Pump Company Information
Table 236. Hongyun Safetytools Hand Pump Specification and Application
Table 237. Hongyun Safetytools Hand Pump Production (K Units), Value (US$ Million), Price (USD/Unit) and Gross Margin (2021–2026)
Table 238. Hongyun Safetytools Main Business and Markets Served
Table 239. Hongyun Safetytools Recent Developments/Updates
Table 240. Shanghai Shangqiu Pump Hand Pump Company Information
Table 241. Shanghai Shangqiu Pump Hand Pump Specification and Application
Table 242. Shanghai Shangqiu Pump Hand Pump Production (K Units), Value (US$ Million), Price (USD/Unit) and Gross Margin (2021–2026)
Table 243. Shanghai Shangqiu Pump Main Business and Markets Served
Table 244. Shanghai Shangqiu Pump Recent Developments/Updates
Table 245. Key Raw Materials Lists
Table 246. Raw Materials Key Suppliers Lists
Table 247. Hand Pump Distributors List
Table 248. Hand Pump Customers List
Table 249. Hand Pump Market Trends
Table 250. Hand Pump Market Drivers
Table 251. Hand Pump Market Challenges
Table 252. Hand Pump Market Restraints
Table 253. Research Programs/Design for This Report
Table 254. Key Data Information from Secondary Sources
Table 255. Key Data Information from Primary Sources
Table 256. Authors List of This Report
List of Figures
Figure 1. Product Picture of Hand Pump
Figure 2. Global Hand Pump Market Value by Type (US$ Million), 2021–2032
Figure 3. Global Hand Pump Market Share by Type: 2025 vs 2032
Figure 4. Rotary Pump Product Picture
Figure 5. Lever Action Pump Product Picture
Figure 6. Piston Pump Product Picture
Figure 7. Drum Siphon Pump Product Picture
Figure 8. Hydraulic Hand Pump Product Picture
Figure 9. Global Hand Pump Market Value by Application (US$ Million), 2021–2032
Figure 10. Global Hand Pump Market Share by Application: 2025 vs 2032
Figure 11. Industrial
Figure 12. Civil
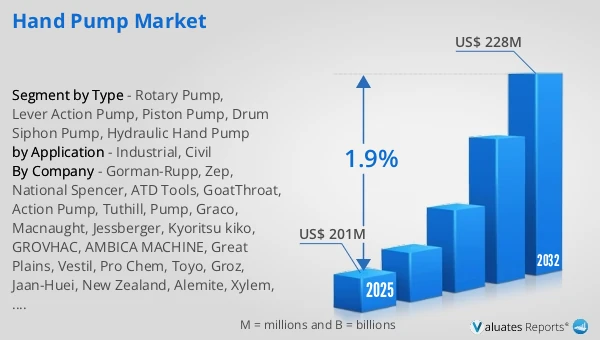
Figure 13. Global Hand Pump Production Value (US$ Million), 2021 vs 2025 vs 2032
Figure 14. Global Hand Pump Production Value (US$ Million), 2021–2032
Figure 15. Global Hand Pump Production Capacity (K Units), 2021–2032
Figure 16. Global Hand Pump Production (K Units), 2021–2032
Figure 17. Global Hand Pump Average Price (USD/Unit), 2021–2032
Figure 18. Hand Pump Report Years Considered
Figure 19. Hand Pump Production Share by Manufacturers in 2025
Figure 20. Global Hand Pump Production Value Share by Manufacturers (2025)
Figure 21. Hand Pump Market Share by Company Type (Tier 1, Tier 2, and Tier 3): 2021 vs 2025
Figure 22. Top 5 and Top 10 Global Players: Market Share by Hand Pump Revenue in 2025
Figure 23. Global Hand Pump Production Value by Region: 2021 vs 2025 vs 2032 (US$ Million)
Figure 24. Global Hand Pump Production Value Market Share by Region: 2021 vs 2025 vs 2032
Figure 25. Global Hand Pump Production Comparison by Region: 2021 vs 2025 vs 2032 (K Units)
Figure 26. Global Hand Pump Production Market Share by Region: 2021 vs 2025 vs 2032
Figure 27. North America Hand Pump Production Value (US$ Million) Growth Rate (2021–2032)
Figure 28. Europe Hand Pump Production Value (US$ Million) Growth Rate (2021–2032)
Figure 29. China Hand Pump Production Value (US$ Million) Growth Rate (2021–2032)
Figure 30. Japan Hand Pump Production Value (US$ Million) Growth Rate (2021–2032)
Figure 31. Global Hand Pump Consumption by Region: 2021 vs 2025 vs 2032 (K Units)
Figure 32. Global Hand Pump Consumption Market Share by Region: 2021 vs 2025 vs 2032
Figure 33. North America Hand Pump Consumption and Growth Rate (K Units), 2021–2032
Figure 34. North America Hand Pump Consumption Market Share by Country (2021–2032)
Figure 35. U.S. Hand Pump Consumption and Growth Rate (K Units), 2021–2032
Figure 36. Canada Hand Pump Consumption and Growth Rate (K Units), 2021–2032
Figure 37. Europe Hand Pump Consumption and Growth Rate (K Units), 2021–2032
Figure 38. Europe Hand Pump Consumption Market Share by Country (2021–2032)
Figure 39. Germany Hand Pump Consumption and Growth Rate (K Units), 2021–2032
Figure 40. France Hand Pump Consumption and Growth Rate (K Units), 2021–2032
Figure 41. U.K. Hand Pump Consumption and Growth Rate (K Units), 2021–2032
Figure 42. Italy Hand Pump Consumption and Growth Rate (K Units), 2021–2032
Figure 43. Russia Hand Pump Consumption and Growth Rate (K Units), 2021–2032
Figure 44. Asia Pacific Hand Pump Consumption and Growth Rate (K Units), 2021–2032
Figure 45. Asia Pacific Hand Pump Consumption Market Share by Region (2021–2032)
Figure 46. China Hand Pump Consumption and Growth Rate (K Units), 2021–2032
Figure 47. Japan Hand Pump Consumption and Growth Rate (K Units), 2021–2032
Figure 48. South Korea Hand Pump Consumption and Growth Rate (K Units), 2021–2032
Figure 49. China Taiwan Hand Pump Consumption and Growth Rate (K Units), 2021–2032
Figure 50. Southeast Asia Hand Pump Consumption and Growth Rate (K Units), 2021–2032
Figure 51. India Hand Pump Consumption and Growth Rate (K Units), 2021–2032
Figure 52. Latin America, Middle East & Africa Hand Pump Consumption and Growth Rate (K Units), 2021–2032
Figure 53. Latin America, Middle East & Africa Hand Pump Consumption Market Share by Country (2021–2032)
Figure 54. Mexico Hand Pump Consumption and Growth Rate (K Units), 2021–2032
Figure 55. Brazil Hand Pump Consumption and Growth Rate (K Units), 2021–2032
Figure 56. Turkey Hand Pump Consumption and Growth Rate (K Units), 2021–2032
Figure 57. GCC Countries Hand Pump Consumption and Growth Rate (K Units), 2021–2032
Figure 58. Global Production Market Share of Hand Pump by Type (2021–2032)
Figure 59. Global Production Value Market Share of Hand Pump by Type (2021–2032)
Figure 60. Global Hand Pump Price (USD/Unit) by Type (2021–2032)
Figure 61. Global Production Market Share of Hand Pump by Application (2021–2032)
Figure 62. Global Production Value Market Share of Hand Pump by Application (2021–2032)
Figure 63. Global Hand Pump Price (USD/Unit) by Application (2021–2032)
Figure 64. Hand Pump Value Chain
Figure 65. Channels of Distribution (Direct Vs Distribution)
Figure 66. Bottom-up and Top-down Approaches for This Report
Figure 67. Data Triangulation