List of Tables
Table 1. Peel Force Analyzer (Peel Force Tester) CAGR in Value, India VS Global, 2018 VS 2022 VS 2029
Table 2. Peel Force Analyzer (Peel Force Tester) Market Trends
Table 3. Peel Force Analyzer (Peel Force Tester) Market Drivers
Table 4. Peel Force Analyzer (Peel Force Tester) Market Challenges
Table 5. Peel Force Analyzer (Peel Force Tester) Market Restraints
Table 6. Global Peel Force Analyzer (Peel Force Tester) Sales Growth Rate (CAGR) by Type: 2018 VS 2022 VS 2029 (US$ Million)
Table 7. India Peel Force Analyzer (Peel Force Tester) Sales Growth Rate (CAGR) by Type: 2018 VS 2022 VS 2029 (US$ Million)
Table 8. Global Peel Force Analyzer (Peel Force Tester) Sales Growth Rate (CAGR) by Application: 2018 VS 2022 VS 2029 (US$ Million)
Table 9. India Peel Force Analyzer (Peel Force Tester) Sales Growth Rate (CAGR) by Application: 2018 VS 2022 VS 2029 (US$ Million)
Table 10. Global Key Manufacturers of Peel Force Analyzer (Peel Force Tester), Ranked by Revenue (2022) & (US$ Million)
Table 11. Global Peel Force Analyzer (Peel Force Tester) Revenue by Manufacturer, (US$ Million), 2018-2023
Table 12. Global Peel Force Analyzer (Peel Force Tester) Revenue Share by Manufacturer, 2018-2023
Table 13. Global Peel Force Analyzer (Peel Force Tester) Sales by Manufacturer, (Units), 2018-2023
Table 14. Global Peel Force Analyzer (Peel Force Tester) Sales Share by Manufacturer, 2018-2023
Table 15. Global Peel Force Analyzer (Peel Force Tester) Price by Manufacturer (2018-2023) & (US$/Unit)
Table 16. Global Peel Force Analyzer (Peel Force Tester) Manufacturers Market Concentration Ratio (CR5 and HHI)
Table 17. Global Peel Force Analyzer (Peel Force Tester) by Company Type (Tier 1, Tier 2, and Tier 3) & (based on the Revenue in Peel Force Analyzer (Peel Force Tester) as of 2022)
Table 18. Global Key Manufacturers of Peel Force Analyzer (Peel Force Tester), Manufacturing Base Distribution and Headquarters
Table 19. Global Key Manufacturers of Peel Force Analyzer (Peel Force Tester), Product Offered and Application
Table 20. Global Key Manufacturers of Peel Force Analyzer (Peel Force Tester), Date of Enter into This Industry
Table 21. Manufacturers Mergers & Acquisitions, Expansion Plans
Table 22. Key Players of Peel Force Analyzer (Peel Force Tester) in India, Ranked by Revenue (2022) & (US$ million)
Table 23. India Peel Force Analyzer (Peel Force Tester) Revenue by Players, (US$ Million), (2018-2023)
Table 24. India Peel Force Analyzer (Peel Force Tester) Revenue Share by Players, (2018-2023)
Table 25. India Peel Force Analyzer (Peel Force Tester) Sales by Players, (Units), (2018-2023)
Table 26. India Peel Force Analyzer (Peel Force Tester) Sales Share by Players, (2018-2023)
Table 27. Global Peel Force Analyzer (Peel Force Tester) Market Size Growth Rate (CAGR) by Region (US$ Million): 2018 VS 2022 VS 2029
Table 28. Global Peel Force Analyzer (Peel Force Tester) Sales in Volume by Region (2018-2023) & (Units)
Table 29. Global Peel Force Analyzer (Peel Force Tester) Sales in Volume Forecast by Region (2024-2029) & (Units)
Table 30. Global Peel Force Analyzer (Peel Force Tester) Sales in Value by Region (2018-2023) & (US$ Million)
Table 31. Global Peel Force Analyzer (Peel Force Tester) Sales in Value Forecast by Region (2024-2029) & (US$ Million)
Table 32. Americas Peel Force Analyzer (Peel Force Tester) Market Size Growth Rate (CAGR) by Country (US$ Million): 2018 VS 2022 VS 2029
Table 33. Americas Peel Force Analyzer (Peel Force Tester) Sales in Value by Country (2018-2023) & (US$ Million)
Table 34. Americas Peel Force Analyzer (Peel Force Tester) Sales in Value by Country (2024-2029) & (US$ Million)
Table 35. Americas Peel Force Analyzer (Peel Force Tester) Sales in Volume by Country (2018-2023) & (Units)
Table 36. Americas Peel Force Analyzer (Peel Force Tester) Sales in Volume by Country (2024-2029) & (Units)
Table 37. EMEA Peel Force Analyzer (Peel Force Tester) Market Size Growth Rate (CAGR) by Country (US$ Million): 2018 VS 2022 VS 2029
Table 38. EMEA Peel Force Analyzer (Peel Force Tester) Sales in Value by Country (2018-2023) & (US$ Million)
Table 39. EMEA Peel Force Analyzer (Peel Force Tester) Sales in Value by Country (2024-2029) & (US$ Million)
Table 40. EMEA Peel Force Analyzer (Peel Force Tester) Sales in Volume by Country (2018-2023) & (Units)
Table 41. EMEA Peel Force Analyzer (Peel Force Tester) Sales in Volume by Country (2024-2029) & (Units)
Table 42. APAC Peel Force Analyzer (Peel Force Tester) Market Size Growth Rate (CAGR) by Country (US$ Million): 2018 VS 2022 VS 2029
Table 43. APAC Peel Force Analyzer (Peel Force Tester) Sales in Value by Country (2018-2023) & (US$ Million)
Table 44. APAC Peel Force Analyzer (Peel Force Tester) Sales in Value by Country (2024-2029) & (US$ Million)
Table 45. APAC Peel Force Analyzer (Peel Force Tester) Sales in Volume by Country (2018-2023) & (Units)
Table 46. APAC Peel Force Analyzer (Peel Force Tester) Sales in Volume by Country (2024-2029) & (Units)
Table 47. V-TEK Company Information
Table 48. V-TEK Description and Business Overview
Table 49. V-TEK Peel Force Analyzer (Peel Force Tester) Sales (Units), Revenue (US$ Million), Price (US$/Unit) and Gross Margin (2018-2023)
Table 50. V-TEK Peel Force Analyzer (Peel Force Tester) Product
Table 51. V-TEK Recent Development
Table 52. APT Automation LLC Company Information
Table 53. APT Automation LLC Description and Business Overview
Table 54. APT Automation LLC Peel Force Analyzer (Peel Force Tester) Sales (Units), Revenue (US$ Million), Price (US$/Unit) and Gross Margin (2018-2023)
Table 55. APT Automation LLC Peel Force Analyzer (Peel Force Tester) Product
Table 56. APT Automation LLC Recent Development
Table 57. IMASS Inc Company Information
Table 58. IMASS Inc Description and Business Overview
Table 59. IMASS Inc Peel Force Analyzer (Peel Force Tester) Sales (Units), Revenue (US$ Million), Price (US$/Unit) and Gross Margin (2018-2023)
Table 60. IMASS Inc Peel Force Analyzer (Peel Force Tester) Product
Table 61. IMASS Inc Recent Development
Table 62. Labthink Instruments Company Information
Table 63. Labthink Instruments Description and Business Overview
Table 64. Labthink Instruments Peel Force Analyzer (Peel Force Tester) Sales (Units), Revenue (US$ Million), Price (US$/Unit) and Gross Margin (2018-2023)
Table 65. Labthink Instruments Peel Force Analyzer (Peel Force Tester) Product
Table 66. Labthink Instruments Recent Development
Table 67. Kyowa Interface Science Co.,Ltd Company Information
Table 68. Kyowa Interface Science Co.,Ltd Description and Business Overview
Table 69. Kyowa Interface Science Co.,Ltd Peel Force Analyzer (Peel Force Tester) Sales (Units), Revenue (US$ Million), Price (US$/Unit) and Gross Margin (2018-2023)
Table 70. Kyowa Interface Science Co.,Ltd Peel Force Analyzer (Peel Force Tester) Product
Table 71. Kyowa Interface Science Co.,Ltd Recent Development
Table 72. Presto Company Information
Table 73. Presto Description and Business Overview
Table 74. Presto Peel Force Analyzer (Peel Force Tester) Sales (Units), Revenue (US$ Million), Price (US$/Unit) and Gross Margin (2018-2023)
Table 75. Presto Peel Force Analyzer (Peel Force Tester) Product
Table 76. Presto Recent Development
Table 77. IMADA Company Information
Table 78. IMADA Description and Business Overview
Table 79. IMADA Peel Force Analyzer (Peel Force Tester) Sales (Units), Revenue (US$ Million), Price (US$/Unit) and Gross Margin (2018-2023)
Table 80. IMADA Peel Force Analyzer (Peel Force Tester) Product
Table 81. IMADA Recent Development
Table 82. Vanguard Systems Inc. Company Information
Table 83. Vanguard Systems Inc. Description and Business Overview
Table 84. Vanguard Systems Inc. Peel Force Analyzer (Peel Force Tester) Sales (Units), Revenue (US$ Million), Price (US$/Unit) and Gross Margin (2018-2023)
Table 85. Vanguard Systems Inc. Peel Force Analyzer (Peel Force Tester) Product
Table 86. Vanguard Systems Inc. Recent Development
Table 87. Mark-10 Coporation Company Information
Table 88. Mark-10 Coporation Description and Business Overview
Table 89. Mark-10 Coporation Peel Force Analyzer (Peel Force Tester) Sales (Units), Revenue (US$ Million), Price (US$/Unit) and Gross Margin (2018-2023)
Table 90. Mark-10 Coporation Peel Force Analyzer (Peel Force Tester) Product
Table 91. Mark-10 Coporation Recent Development
Table 92. Overtop Technology Co. Company Information
Table 93. Overtop Technology Co. Description and Business Overview
Table 94. Overtop Technology Co. Peel Force Analyzer (Peel Force Tester) Sales (Units), Revenue (US$ Million), Price (US$/Unit) and Gross Margin (2018-2023)
Table 95. Overtop Technology Co. Peel Force Analyzer (Peel Force Tester) Product
Table 96. Overtop Technology Co. Recent Development
Table 97. Dongguan Haida International Equipment Company Information
Table 98. Dongguan Haida International Equipment Description and Business Overview
Table 99. Dongguan Haida International Equipment Peel Force Analyzer (Peel Force Tester) Sales (Units), Revenue (US$ Million), Price (US$/Unit) and Gross Margin (2018-2023)
Table 100. Dongguan Haida International Equipment Peel Force Analyzer (Peel Force Tester) Product
Table 101. Dongguan Haida International Equipment Recent Development
Table 102. GPD Global Company Information
Table 103. GPD Global Description and Business Overview
Table 104. GPD Global Peel Force Analyzer (Peel Force Tester) Sales (Units), Revenue (US$ Million), Price (US$/Unit) and Gross Margin (2018-2023)
Table 105. GPD Global Peel Force Analyzer (Peel Force Tester) Product
Table 106. GPD Global Recent Development
Table 107. Kejian Instrument Company Information
Table 108. Kejian Instrument Description and Business Overview
Table 109. Kejian Instrument Peel Force Analyzer (Peel Force Tester) Sales (Units), Revenue (US$ Million), Price (US$/Unit) and Gross Margin (2018-2023)
Table 110. Kejian Instrument Peel Force Analyzer (Peel Force Tester) Product
Table 111. Kejian Instrument Recent Development
Table 112. ZIEGLER Industrie-Elektronik Company Information
Table 113. ZIEGLER Industrie-Elektronik Description and Business Overview
Table 114. ZIEGLER Industrie-Elektronik Peel Force Analyzer (Peel Force Tester) Sales (Units), Revenue (US$ Million), Price (US$/Unit) and Gross Margin (2018-2023)
Table 115. ZIEGLER Industrie-Elektronik Peel Force Analyzer (Peel Force Tester) Product
Table 116. ZIEGLER Industrie-Elektronik Recent Development
Table 117. K-TECH Electronic Vertriebs Company Information
Table 118. K-TECH Electronic Vertriebs Description and Business Overview
Table 119. K-TECH Electronic Vertriebs Peel Force Analyzer (Peel Force Tester) Sales (Units), Revenue (US$ Million), Price (US$/Unit) and Gross Margin (2018-2023)
Table 120. K-TECH Electronic Vertriebs Peel Force Analyzer (Peel Force Tester) Product
Table 121. K-TECH Electronic Vertriebs Recent Development
Table 122. Lihe Tengxin Technology Company Information
Table 123. Lihe Tengxin Technology Description and Business Overview
Table 124. Lihe Tengxin Technology Peel Force Analyzer (Peel Force Tester) Sales (Units), Revenue (US$ Million), Price (US$/Unit) and Gross Margin (2018-2023)
Table 125. Lihe Tengxin Technology Peel Force Analyzer (Peel Force Tester) Product
Table 126. Lihe Tengxin Technology Recent Development
Table 127. Key Raw Materials Lists
Table 128. Raw Materials Key Suppliers Lists
Table 129. Peel Force Analyzer (Peel Force Tester) Customers List
Table 130. Peel Force Analyzer (Peel Force Tester) Distributors List
Table 131. Research Programs/Design for This Report
Table 132. Key Data Information from Secondary Sources
Table 133. Key Data Information from Primary Sources
List of Figures
Figure 1. Peel Force Analyzer (Peel Force Tester) Product Picture
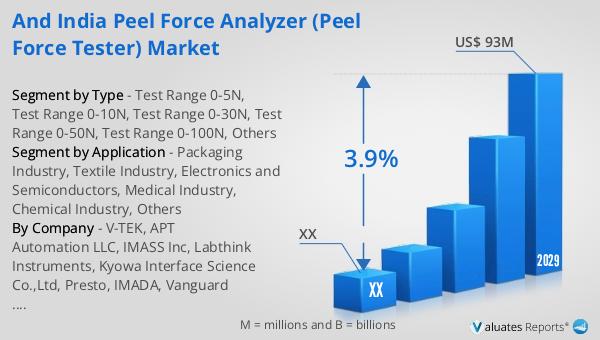
Figure 2. Global Peel Force Analyzer (Peel Force Tester) Revenue, (US$ Million), 2018 VS 2022 VS 2029
Figure 3. Global Peel Force Analyzer (Peel Force Tester) Market Size 2018-2029 (US$ Million)
Figure 4. Global Peel Force Analyzer (Peel Force Tester) Sales 2018-2029 (Units)
Figure 5. India Peel Force Analyzer (Peel Force Tester) Revenue, (US$ Million), 2018 VS 2022 VS 2029
Figure 6. India Peel Force Analyzer (Peel Force Tester) Market Size 2018-2029 (US$ Million)
Figure 7. India Peel Force Analyzer (Peel Force Tester) Sales 2018-2029 (Units)
Figure 8. India Peel Force Analyzer (Peel Force Tester) Market Share in Global, in Value (US$ Million) 2018-2029
Figure 9. India Peel Force Analyzer (Peel Force Tester) Market Share in Global, in Volume (Units) 2018-2029
Figure 10. Peel Force Analyzer (Peel Force Tester) Report Years Considered
Figure 11. Product Picture of Test Range 0-5N
Figure 12. Product Picture of Test Range 0-10N
Figure 13. Product Picture of Test Range 0-30N
Figure 14. Product Picture of Test Range 0-50N
Figure 15. Product Picture of Test Range 0-100N
Figure 16. Product Picture of Others
Figure 17. Global Peel Force Analyzer (Peel Force Tester) Market Share by Type in 2022 & 2029
Figure 18. Global Peel Force Analyzer (Peel Force Tester) Sales in Value by Type (2018-2029) & (US$ Million)
Figure 19. Global Peel Force Analyzer (Peel Force Tester) Sales Market Share in Value by Type (2018-2029)
Figure 20. Global Peel Force Analyzer (Peel Force Tester) Sales by Type (2018-2029) & (Units)
Figure 21. Global Peel Force Analyzer (Peel Force Tester) Sales Market Share in Volume by Type (2018-2029)
Figure 22. Global Peel Force Analyzer (Peel Force Tester) Price by Type (2018-2029) & (US$/Unit)
Figure 23. India Peel Force Analyzer (Peel Force Tester) Market Share by Type in 2022 & 2029
Figure 24. India Peel Force Analyzer (Peel Force Tester) Sales in Value by Type (2018-2029) & (US$ Million)
Figure 25. India Peel Force Analyzer (Peel Force Tester) Sales Market Share in Value by Type (2018-2029)
Figure 26. India Peel Force Analyzer (Peel Force Tester) Sales by Type (2018-2029) & (Units)
Figure 27. India Peel Force Analyzer (Peel Force Tester) Sales Market Share in Volume by Type (2018-2029)
Figure 28. India Peel Force Analyzer (Peel Force Tester) Price by Type (2018-2029) & (US$/Unit)
Figure 29. Product Picture of Packaging Industry
Figure 30. Product Picture of Textile Industry
Figure 31. Product Picture of Electronics and Semiconductors
Figure 32. Product Picture of Medical Industry
Figure 33. Product Picture of Chemical Industry
Figure 34. Product Picture of Others
Figure 35. Global Peel Force Analyzer (Peel Force Tester) Market Share by Application in 2022 & 2029
Figure 36. Global Peel Force Analyzer (Peel Force Tester) Sales in Value by Application (2018-2029) & (US$ Million)
Figure 37. Global Peel Force Analyzer (Peel Force Tester) Sales Market Share in Value by Application (2018-2029)
Figure 38. Global Peel Force Analyzer (Peel Force Tester) Sales by Application (2018-2029) & (Units)
Figure 39. Global Peel Force Analyzer (Peel Force Tester) Sales Market Share in Volume by Application (2018-2029)
Figure 40. Global Peel Force Analyzer (Peel Force Tester) Price by Application (2018-2029) & (US$/Unit)
Figure 41. India Peel Force Analyzer (Peel Force Tester) Market Share by Application in 2022 & 2029
Figure 42. India Peel Force Analyzer (Peel Force Tester) Sales in Value by Application (2018-2029) & (US$ Million)
Figure 43. India Peel Force Analyzer (Peel Force Tester) Sales Market Share in Value by Application (2018-2029)
Figure 44. India Peel Force Analyzer (Peel Force Tester) Sales by Application (2018-2029) & (Units)
Figure 45. India Peel Force Analyzer (Peel Force Tester) Sales Market Share in Volume by Application (2018-2029)
Figure 46. India Peel Force Analyzer (Peel Force Tester) Price by Application (2018-2029) & (US$/Unit)
Figure 47. Americas Peel Force Analyzer (Peel Force Tester) Sales in Volume Growth Rate 2018-2029 (Units)
Figure 48. Americas Peel Force Analyzer (Peel Force Tester) Sales in Value Growth Rate 2018-2029 (US$ Million)
Figure 49. Americas Peel Force Analyzer (Peel Force Tester) Sales by Type (2018-2029) & (Units)
Figure 50. Americas Peel Force Analyzer (Peel Force Tester) Sales Market Share in Volume by Type (2018-2029)
Figure 51. Americas Peel Force Analyzer (Peel Force Tester) Sales by Application (2018-2029) & (Units)
Figure 52. Americas Peel Force Analyzer (Peel Force Tester) Sales Market Share in Volume by Application (2018-2029)
Figure 53. United States Peel Force Analyzer (Peel Force Tester) Sales in Value Growth Rate (2018-2029) & (US$ Million)
Figure 54. Canada Peel Force Analyzer (Peel Force Tester) Sales in Value Growth Rate (2018-2029) & (US$ Million)
Figure 55. Mexico Peel Force Analyzer (Peel Force Tester) Sales in Value Growth Rate (2018-2029) & (US$ Million)
Figure 56. Brazil Peel Force Analyzer (Peel Force Tester) Sales in Value Growth Rate (2018-2029) & (US$ Million)
Figure 57. EMEA Peel Force Analyzer (Peel Force Tester) Sales in Volume Growth Rate 2018-2029 (Units)
Figure 58. EMEA Peel Force Analyzer (Peel Force Tester) Sales in Value Growth Rate 2018-2029 (US$ Million)
Figure 59. EMEA Peel Force Analyzer (Peel Force Tester) Sales by Type (2018-2029) & (Units)
Figure 60. EMEA Peel Force Analyzer (Peel Force Tester) Sales Market Share in Volume by Type (2018-2029)
Figure 61. EMEA Peel Force Analyzer (Peel Force Tester) Sales by Application (2018-2029) & (Units)
Figure 62. EMEA Peel Force Analyzer (Peel Force Tester) Sales Market Share in Volume by Application (2018-2029)
Figure 63. Europe Peel Force Analyzer (Peel Force Tester) Sales in Value Growth Rate (2018-2029) & (US$ Million)
Figure 64. Middle East Peel Force Analyzer (Peel Force Tester) Sales in Value Growth Rate (2018-2029) & (US$ Million)
Figure 65. Africa Peel Force Analyzer (Peel Force Tester) Sales in Value Growth Rate (2018-2029) & (US$ Million)
Figure 66. China Peel Force Analyzer (Peel Force Tester) Sales in Volume Growth Rate 2018-2029 (Units)
Figure 67. China Peel Force Analyzer (Peel Force Tester) Sales in Value Growth Rate 2018-2029 (US$ Million)
Figure 68. China Peel Force Analyzer (Peel Force Tester) Sales by Type (2018-2029) & (Units)
Figure 69. China Peel Force Analyzer (Peel Force Tester) Sales Market Share in Volume by Type (2018-2029)
Figure 70. China Peel Force Analyzer (Peel Force Tester) Sales by Application (2018-2029) & (Units)
Figure 71. China Peel Force Analyzer (Peel Force Tester) Sales Market Share in Volume by Application (2018-2029)
Figure 72. APAC Peel Force Analyzer (Peel Force Tester) Sales in Volume Growth Rate 2018-2029 (Units)
Figure 73. APAC Peel Force Analyzer (Peel Force Tester) Sales in Value Growth Rate 2018-2029 (US$ Million)
Figure 74. APAC Peel Force Analyzer (Peel Force Tester) Sales by Type (2018-2029) & (Units)
Figure 75. APAC Peel Force Analyzer (Peel Force Tester) Sales Market Share in Volume by Type (2018-2029)
Figure 76. APAC Peel Force Analyzer (Peel Force Tester) Sales by Application (2018-2029) & (Units)
Figure 77. APAC Peel Force Analyzer (Peel Force Tester) Sales Market Share in Volume by Application (2018-2029)
Figure 78. Japan Peel Force Analyzer (Peel Force Tester) Sales in Value Growth Rate (2018-2029) & (US$ Million)
Figure 79. South Korea Peel Force Analyzer (Peel Force Tester) Sales in Value Growth Rate (2018-2029) & (US$ Million)
Figure 80. China Taiwan Peel Force Analyzer (Peel Force Tester) Sales in Value Growth Rate (2018-2029) & (US$ Million)
Figure 81. Southeast Asia Peel Force Analyzer (Peel Force Tester) Sales in Value Growth Rate (2018-2029) & (US$ Million)
Figure 82. India Peel Force Analyzer (Peel Force Tester) Sales in Value Growth Rate (2018-2029) & (US$ Million)
Figure 83. Peel Force Analyzer (Peel Force Tester) Value Chain
Figure 84. Peel Force Analyzer (Peel Force Tester) Production Process
Figure 85. Channels of Distribution
Figure 86. Distributors Profiles
Figure 87. Bottom-up and Top-down Approaches for This Report
Figure 88. Data Triangulation
Figure 89. Key Executives Interviewed