List of Tables
Table 1. Global Military Contract Manufacturing Service Market Size Growth Rate by Type (US$ Million): 2021 vs 2025 vs 2032
Table 2. Key Players of Component & Subsystem Manufacturing
Table 3. Key Players of System Integration & Assembly
Table 4. Key Players of Maintenance, Repair & Overhaul (MRO)
Table 5. Key Players of Engineering & Technical Services
Table 6. Key Players of Logistics & Supply Chain Support
Table 7. Global Military Contract Manufacturing Service Market Size Growth Rate by Military Product Platform (US$ Million): 2021 vs 2025 vs 2032
Table 8. Key Players of Land Military Platform
Table 9. Key Players of Aerospace Platform
Table 10. Key Players of Naval Platform
Table 11. Key Players of Cyber & Electronic Warfare Platform
Table 12. Key Players of Logistics & Support Platform
Table 13. Global Military Contract Manufacturing Service Market Size Growth Rate by Technical Complexity & Customization Degree (US$ Million): 2021 vs 2025 vs 2032
Table 14. Key Players of High-Complexity Customized Manufacturing
Table 15. Key Players of Medium-Complexity Semi-Customized Manufacturing
Table 16. Key Players of Low-Complexity Standardized Manufacturing
Table 17. Global Military Contract Manufacturing Service Market Size Growth Rate by Geographic Scope of Contracts (US$ Million): 2021 vs 2025 vs 2032
Table 18. Key Players of Domestic Military Contract Manufacturing
Table 19. Key Players of Cross-Border Military Contract Manufacturing
Table 20. Key Players of Regionalized Contract Manufacturing
Table 21. Global Military Contract Manufacturing Service Market Size Growth by Application (US$ Million): 2021 vs 2025 vs 2032
Table 22. Global Military Contract Manufacturing Service Market Size by Region (US$ Million): 2021 vs 2025 vs 2032
Table 23. Global Military Contract Manufacturing Service Market Size by Region (US$ Million), 2021–2026
Table 24. Global Military Contract Manufacturing Service Market Share by Region (2021–2026)
Table 25. Global Military Contract Manufacturing Service Forecasted Market Size by Region (US$ Million), 2027–2032
Table 26. Global Military Contract Manufacturing Service Market Share by Region (2027–2032)
Table 27. Military Contract Manufacturing Service Market Trends
Table 28. Military Contract Manufacturing Service Market Drivers
Table 29. Military Contract Manufacturing Service Market Challenges
Table 30. Military Contract Manufacturing Service Market Restraints
Table 31. Global Military Contract Manufacturing Service Revenue by Players (US$ Million), 2021–2026
Table 32. Global Military Contract Manufacturing Service Market Share by Players (2021–2026)
Table 33. Global Top Military Contract Manufacturing Service Players by Tier (Tier 1, Tier 2, and Tier 3), based on Military Contract Manufacturing Service Revenue, 2025
Table 34. Ranking of Global Top Military Contract Manufacturing Service Companies by Revenue (US$ Million) in 2025
Table 35. Global 5 Largest Players Market Share by Military Contract Manufacturing Service Revenue (CR5 and HHI), 2021–2026
Table 36. Global Key Players of Military Contract Manufacturing Service, Headquarters and Area Served
Table 37. Global Key Players of Military Contract Manufacturing Service, Products and Applications
Table 38. Global Key Players of Military Contract Manufacturing Service, Date of General Availability (GA)
Table 39. Mergers and Acquisitions, Expansion Plans
Table 40. Global Military Contract Manufacturing Service Market Size by Type (US$ Million), 2021–2026
Table 41. Global Military Contract Manufacturing Service Revenue Market Share by Type (2021–2026)
Table 42. Global Military Contract Manufacturing Service Forecasted Market Size by Type (US$ Million), 2027–2032
Table 43. Global Military Contract Manufacturing Service Revenue Market Share by Type (2027–2032)
Table 44. Global Military Contract Manufacturing Service Market Size by Application (US$ Million), 2021–2026
Table 45. Global Military Contract Manufacturing Service Revenue Market Share by Application (2021–2026)
Table 46. Global Military Contract Manufacturing Service Forecasted Market Size by Application (US$ Million), 2027–2032
Table 47. Global Military Contract Manufacturing Service Revenue Market Share by Application (2027–2032)
Table 48. North America Military Contract Manufacturing Service Market Size Growth Rate by Country (US$ Million): 2021 vs 2025 vs 2032
Table 49. North America Military Contract Manufacturing Service Market Size by Country (US$ Million), 2021–2026
Table 50. North America Military Contract Manufacturing Service Market Size by Country (US$ Million), 2027–2032
Table 51. Europe Military Contract Manufacturing Service Market Size Growth Rate by Country (US$ Million): 2021 vs 2025 vs 2032
Table 52. Europe Military Contract Manufacturing Service Market Size by Country (US$ Million), 2021–2026
Table 53. Europe Military Contract Manufacturing Service Market Size by Country (US$ Million), 2027–2032
Table 54. Asia-Pacific Military Contract Manufacturing Service Market Size Growth Rate by Region (US$ Million): 2021 vs 2025 vs 2032
Table 55. Asia-Pacific Military Contract Manufacturing Service Market Size by Region (US$ Million), 2021–2026
Table 56. Asia-Pacific Military Contract Manufacturing Service Market Size by Region (US$ Million), 2027–2032
Table 57. Latin America Military Contract Manufacturing Service Market Size Growth Rate by Country (US$ Million): 2021 vs 2025 vs 2032
Table 58. Latin America Military Contract Manufacturing Service Market Size by Country (US$ Million), 2021–2026
Table 59. Latin America Military Contract Manufacturing Service Market Size by Country (US$ Million), 2027–2032
Table 60. Middle East & Africa Military Contract Manufacturing Service Market Size Growth Rate by Country (US$ Million): 2021 vs 2025 vs 2032
Table 61. Middle East & Africa Military Contract Manufacturing Service Market Size by Country (US$ Million), 2021–2026
Table 62. Middle East & Africa Military Contract Manufacturing Service Market Size by Country (US$ Million), 2027–2032
Table 63. Lockheed Martin Company Details
Table 64. Lockheed Martin Business Overview
Table 65. Lockheed Martin Military Contract Manufacturing Service Product
Table 66. Lockheed Martin Revenue in Military Contract Manufacturing Service Business (US$ Million), 2021–2026
Table 67. Lockheed Martin Recent Development
Table 68. RTX Corp Company Details
Table 69. RTX Corp Business Overview
Table 70. RTX Corp Military Contract Manufacturing Service Product
Table 71. RTX Corp Revenue in Military Contract Manufacturing Service Business (US$ Million), 2021–2026
Table 72. RTX Corp Recent Development
Table 73. Northrop Grumman Company Details
Table 74. Northrop Grumman Business Overview
Table 75. Northrop Grumman Military Contract Manufacturing Service Product
Table 76. Northrop Grumman Revenue in Military Contract Manufacturing Service Business (US$ Million), 2021–2026
Table 77. Northrop Grumman Recent Development
Table 78. AVIC Company Details
Table 79. AVIC Business Overview
Table 80. AVIC Military Contract Manufacturing Service Product
Table 81. AVIC Revenue in Military Contract Manufacturing Service Business (US$ Million), 2021–2026
Table 82. AVIC Recent Development
Table 83. L3Harris Company Details
Table 84. L3Harris Business Overview
Table 85. L3Harris Military Contract Manufacturing Service Product
Table 86. L3Harris Revenue in Military Contract Manufacturing Service Business (US$ Million), 2021–2026
Table 87. L3Harris Recent Development
Table 88. BAE Systems Company Details
Table 89. BAE Systems Business Overview
Table 90. BAE Systems Military Contract Manufacturing Service Product
Table 91. BAE Systems Revenue in Military Contract Manufacturing Service Business (US$ Million), 2021–2026
Table 92. BAE Systems Recent Development
Table 93. General Dynamics Company Details
Table 94. General Dynamics Business Overview
Table 95. General Dynamics Military Contract Manufacturing Service Product
Table 96. General Dynamics Revenue in Military Contract Manufacturing Service Business (US$ Million), 2021–2026
Table 97. General Dynamics Recent Development
Table 98. VR Industries Company Details
Table 99. VR Industries Business Overview
Table 100. VR Industries Military Contract Manufacturing Service Product
Table 101. VR Industries Revenue in Military Contract Manufacturing Service Business (US$ Million), 2021–2026
Table 102. VR Industries Recent Development
Table 103. Boeing Company Details
Table 104. Boeing Business Overview
Table 105. Boeing Military Contract Manufacturing Service Product
Table 106. Boeing Revenue in Military Contract Manufacturing Service Business (US$ Million), 2021–2026
Table 107. Boeing Recent Development
Table 108. Norinco Company Details
Table 109. Norinco Business Overview
Table 110. Norinco Military Contract Manufacturing Service Product
Table 111. Norinco Revenue in Military Contract Manufacturing Service Business (US$ Million), 2021–2026
Table 112. Norinco Recent Development
Table 113. Leonardo Company Details
Table 114. Leonardo Business Overview
Table 115. Leonardo Military Contract Manufacturing Service Product
Table 116. Leonardo Revenue in Military Contract Manufacturing Service Business (US$ Million), 2021–2026
Table 117. Leonardo Recent Development
Table 118. HII Company Details
Table 119. HII Business Overview
Table 120. HII Military Contract Manufacturing Service Product
Table 121. HII Revenue in Military Contract Manufacturing Service Business (US$ Million), 2021–2026
Table 122. HII Recent Development
Table 123. Thales Company Details
Table 124. Thales Business Overview
Table 125. Thales Military Contract Manufacturing Service Product
Table 126. Thales Revenue in Military Contract Manufacturing Service Business (US$ Million), 2021–2026
Table 127. Thales Recent Development
Table 128. China South Industries Group Company Details
Table 129. China South Industries Group Business Overview
Table 130. China South Industries Group Military Contract Manufacturing Service Product
Table 131. China South Industries Group Revenue in Military Contract Manufacturing Service Business (US$ Million), 2021–2026
Table 132. China South Industries Group Recent Development
Table 133. Laszeray Company Details
Table 134. Laszeray Business Overview
Table 135. Laszeray Military Contract Manufacturing Service Product
Table 136. Laszeray Revenue in Military Contract Manufacturing Service Business (US$ Million), 2021–2026
Table 137. Laszeray Recent Development
Table 138. Wegmann Company Details
Table 139. Wegmann Business Overview
Table 140. Wegmann Military Contract Manufacturing Service Product
Table 141. Wegmann Revenue in Military Contract Manufacturing Service Business (US$ Million), 2021–2026
Table 142. Wegmann Recent Development
Table 143. Columbia Tech Company Details
Table 144. Columbia Tech Business Overview
Table 145. Columbia Tech Military Contract Manufacturing Service Product
Table 146. Columbia Tech Revenue in Military Contract Manufacturing Service Business (US$ Million), 2021–2026
Table 147. Columbia Tech Recent Development
Table 148. Dante Valve Company Details
Table 149. Dante Valve Business Overview
Table 150. Dante Valve Military Contract Manufacturing Service Product
Table 151. Dante Valve Revenue in Military Contract Manufacturing Service Business (US$ Million), 2021–2026
Table 152. Dante Valve Recent Development
Table 153. HiTEM Company Details
Table 154. HiTEM Business Overview
Table 155. HiTEM Military Contract Manufacturing Service Product
Table 156. HiTEM Revenue in Military Contract Manufacturing Service Business (US$ Million), 2021–2026
Table 157. HiTEM Recent Development
Table 158. Cypress Technologies Company Details
Table 159. Cypress Technologies Business Overview
Table 160. Cypress Technologies Military Contract Manufacturing Service Product
Table 161. Cypress Technologies Revenue in Military Contract Manufacturing Service Business (US$ Million), 2021–2026
Table 162. Cypress Technologies Recent Development
Table 163. Fairlawn Tool Company Details
Table 164. Fairlawn Tool Business Overview
Table 165. Fairlawn Tool Military Contract Manufacturing Service Product
Table 166. Fairlawn Tool Revenue in Military Contract Manufacturing Service Business (US$ Million), 2021–2026
Table 167. Fairlawn Tool Recent Development
Table 168. Sechan Company Details
Table 169. Sechan Business Overview
Table 170. Sechan Military Contract Manufacturing Service Product
Table 171. Sechan Revenue in Military Contract Manufacturing Service Business (US$ Million), 2021–2026
Table 172. Sechan Recent Development
Table 173. Hemargroup Company Details
Table 174. Hemargroup Business Overview
Table 175. Hemargroup Military Contract Manufacturing Service Product
Table 176. Hemargroup Revenue in Military Contract Manufacturing Service Business (US$ Million), 2021–2026
Table 177. Hemargroup Recent Development
Table 178. Arc-Tronics Company Details
Table 179. Arc-Tronics Business Overview
Table 180. Arc-Tronics Military Contract Manufacturing Service Product
Table 181. Arc-Tronics Revenue in Military Contract Manufacturing Service Business (US$ Million), 2021–2026
Table 182. Arc-Tronics Recent Development
Table 183. Billet Industries Company Details
Table 184. Billet Industries Business Overview
Table 185. Billet Industries Military Contract Manufacturing Service Product
Table 186. Billet Industries Revenue in Military Contract Manufacturing Service Business (US$ Million), 2021–2026
Table 187. Billet Industries Recent Development
Table 188. Optikos Company Details
Table 189. Optikos Business Overview
Table 190. Optikos Military Contract Manufacturing Service Product
Table 191. Optikos Revenue in Military Contract Manufacturing Service Business (US$ Million), 2021–2026
Table 192. Optikos Recent Development
Table 193. Fermionx Company Details
Table 194. Fermionx Business Overview
Table 195. Fermionx Military Contract Manufacturing Service Product
Table 196. Fermionx Revenue in Military Contract Manufacturing Service Business (US$ Million), 2021–2026
Table 197. Fermionx Recent Development
Table 198. Nemco Company Details
Table 199. Nemco Business Overview
Table 200. Nemco Military Contract Manufacturing Service Product
Table 201. Nemco Revenue in Military Contract Manufacturing Service Business (US$ Million), 2021–2026
Table 202. Nemco Recent Development
Table 203. Pearson Engineering Company Details
Table 204. Pearson Engineering Business Overview
Table 205. Pearson Engineering Military Contract Manufacturing Service Product
Table 206. Pearson Engineering Revenue in Military Contract Manufacturing Service Business (US$ Million), 2021–2026
Table 207. Pearson Engineering Recent Development
Table 208. Research Programs/Design for This Report
Table 209. Key Data Information from Secondary Sources
Table 210. Key Data Information from Primary Sources
Table 211. Authors List of This Report
List of Figures
Figure 1. Military Contract Manufacturing Service Picture
Figure 2. Global Military Contract Manufacturing Service Market Size Comparison by Type (US$ Million), 2021–2032
Figure 3. Global Military Contract Manufacturing Service Market Share by Type: 2025 vs 2032
Figure 4. Component & Subsystem Manufacturing Features
Figure 5. System Integration & Assembly Features
Figure 6. Maintenance, Repair & Overhaul (MRO) Features
Figure 7. Engineering & Technical Services Features
Figure 8. Logistics & Supply Chain Support Features
Figure 9. Global Military Contract Manufacturing Service Market Size Comparison by Military Product Platform (US$ Million), 2021–2032
Figure 10. Land Military Platform Features
Figure 11. Aerospace Platform Features
Figure 12. Naval Platform Features
Figure 13. Cyber & Electronic Warfare Platform Features
Figure 14. Logistics & Support Platform Features
Figure 15. Global Military Contract Manufacturing Service Market Size Comparison by Technical Complexity & Customization Degree (US$ Million), 2021–2032
Figure 16. High-Complexity Customized Manufacturing Features
Figure 17. Medium-Complexity Semi-Customized Manufacturing Features
Figure 18. Low-Complexity Standardized Manufacturing Features
Figure 19. Global Military Contract Manufacturing Service Market Size Comparison by Geographic Scope of Contracts (US$ Million), 2021–2032
Figure 20. Domestic Military Contract Manufacturing Features
Figure 21. Cross-Border Military Contract Manufacturing Features
Figure 22. Regionalized Contract Manufacturing Features
Figure 23. Global Military Contract Manufacturing Service Market Size by Application (US$ Million), 2021–2032
Figure 24. Global Military Contract Manufacturing Service Market Share by Application: 2025 vs 2032
Figure 25. Air Force Case Studies
Figure 26. Army Case Studies
Figure 27. Navy Case Studies
Figure 28. Military Contract Manufacturing Service Report Years Considered
Figure 29. Global Military Contract Manufacturing Service Market Size (US$ Million), Year-over-Year: 2021–2032
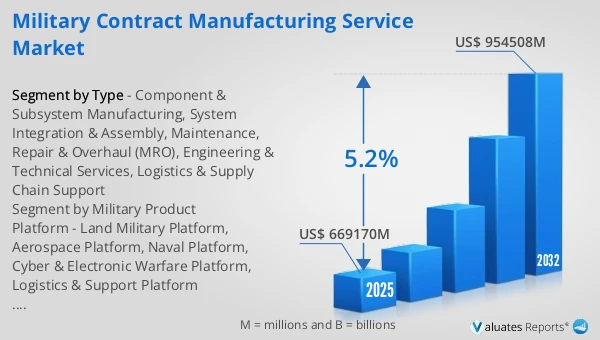
Figure 30. Global Military Contract Manufacturing Service Market Size, (US$ Million), 2021 vs 2025 vs 2032
Figure 31. Global Military Contract Manufacturing Service Market Share by Region: 2025 vs 2032
Figure 32. Global Military Contract Manufacturing Service Market Share by Players in 2025
Figure 33. Global Military Contract Manufacturing Service Market Share by Company Type (Tier 1, Tier 2, and Tier 3)
Figure 34. The Top 10 and 5 Players Market Share by Military Contract Manufacturing Service Revenue in 2025
Figure 35. North America Military Contract Manufacturing Service Market Size YoY Growth (US$ Million), 2021–2032
Figure 36. North America Military Contract Manufacturing Service Market Share by Country (2021–2032)
Figure 37. United States Military Contract Manufacturing Service Market Size YoY Growth (US$ Million), 2021–2032
Figure 38. Canada Military Contract Manufacturing Service Market Size YoY Growth (US$ Million), 2021–2032
Figure 39. Europe Military Contract Manufacturing Service Market Size YoY Growth (US$ Million), 2021–2032
Figure 40. Europe Military Contract Manufacturing Service Market Share by Country (2021–2032)
Figure 41. Germany Military Contract Manufacturing Service Market Size YoY Growth (US$ Million), 2021–2032
Figure 42. France Military Contract Manufacturing Service Market Size YoY Growth (US$ Million), 2021–2032
Figure 43. U.K. Military Contract Manufacturing Service Market Size YoY Growth (US$ Million), 2021–2032
Figure 44. Italy Military Contract Manufacturing Service Market Size YoY Growth (US$ Million), 2021–2032
Figure 45. Russia Military Contract Manufacturing Service Market Size YoY Growth (US$ Million), 2021–2032
Figure 46. Ireland Military Contract Manufacturing Service Market Size YoY Growth (US$ Million), 2021–2032
Figure 47. Asia-Pacific Military Contract Manufacturing Service Market Size YoY Growth (US$ Million), 2021–2032
Figure 48. Asia-Pacific Military Contract Manufacturing Service Market Share by Region (2021–2032)
Figure 49. China Military Contract Manufacturing Service Market Size YoY Growth (US$ Million), 2021–2032
Figure 50. Japan Military Contract Manufacturing Service Market Size YoY Growth (US$ Million), 2021–2032
Figure 51. South Korea Military Contract Manufacturing Service Market Size YoY Growth (US$ Million), 2021–2032
Figure 52. Southeast Asia Military Contract Manufacturing Service Market Size YoY Growth (US$ Million), 2021–2032
Figure 53. India Military Contract Manufacturing Service Market Size YoY Growth (US$ Million), 2021–2032
Figure 54. Australia & New Zealand Military Contract Manufacturing Service Market Size YoY Growth (US$ Million), 2021–2032
Figure 55. Latin America Military Contract Manufacturing Service Market Size YoY Growth (US$ Million), 2021–2032
Figure 56. Latin America Military Contract Manufacturing Service Market Share by Country (2021–2032)
Figure 57. Mexico Military Contract Manufacturing Service Market Size YoY Growth (US$ Million), 2021–2032
Figure 58. Brazil Military Contract Manufacturing Service Market Size YoY Growth (US$ Million), 2021–2032
Figure 59. Middle East & Africa Military Contract Manufacturing Service Market Size YoY Growth (US$ Million), 2021–2032
Figure 60. Middle East & Africa Military Contract Manufacturing Service Market Share by Country (2021–2032)
Figure 61. Israel Military Contract Manufacturing Service Market Size YoY Growth (US$ Million), 2021–2032
Figure 62. Saudi Arabia Military Contract Manufacturing Service Market Size YoY Growth (US$ Million), 2021–2032
Figure 63. UAE Military Contract Manufacturing Service Market Size YoY Growth (US$ Million), 2021–2032
Figure 64. Lockheed Martin Revenue Growth Rate in Military Contract Manufacturing Service Business (2021–2026)
Figure 65. RTX Corp Revenue Growth Rate in Military Contract Manufacturing Service Business (2021–2026)
Figure 66. Northrop Grumman Revenue Growth Rate in Military Contract Manufacturing Service Business (2021–2026)
Figure 67. AVIC Revenue Growth Rate in Military Contract Manufacturing Service Business (2021–2026)
Figure 68. L3Harris Revenue Growth Rate in Military Contract Manufacturing Service Business (2021–2026)
Figure 69. BAE Systems Revenue Growth Rate in Military Contract Manufacturing Service Business (2021–2026)
Figure 70. General Dynamics Revenue Growth Rate in Military Contract Manufacturing Service Business (2021–2026)
Figure 71. VR Industries Revenue Growth Rate in Military Contract Manufacturing Service Business (2021–2026)
Figure 72. Boeing Revenue Growth Rate in Military Contract Manufacturing Service Business (2021–2026)
Figure 73. Norinco Revenue Growth Rate in Military Contract Manufacturing Service Business (2021–2026)
Figure 74. Leonardo Revenue Growth Rate in Military Contract Manufacturing Service Business (2021–2026)
Figure 75. HII Revenue Growth Rate in Military Contract Manufacturing Service Business (2021–2026)
Figure 76. Thales Revenue Growth Rate in Military Contract Manufacturing Service Business (2021–2026)
Figure 77. China South Industries Group Revenue Growth Rate in Military Contract Manufacturing Service Business (2021–2026)
Figure 78. Laszeray Revenue Growth Rate in Military Contract Manufacturing Service Business (2021–2026)
Figure 79. Wegmann Revenue Growth Rate in Military Contract Manufacturing Service Business (2021–2026)
Figure 80. Columbia Tech Revenue Growth Rate in Military Contract Manufacturing Service Business (2021–2026)
Figure 81. Dante Valve Revenue Growth Rate in Military Contract Manufacturing Service Business (2021–2026)
Figure 82. HiTEM Revenue Growth Rate in Military Contract Manufacturing Service Business (2021–2026)
Figure 83. Cypress Technologies Revenue Growth Rate in Military Contract Manufacturing Service Business (2021–2026)
Figure 84. Fairlawn Tool Revenue Growth Rate in Military Contract Manufacturing Service Business (2021–2026)
Figure 85. Sechan Revenue Growth Rate in Military Contract Manufacturing Service Business (2021–2026)
Figure 86. Hemargroup Revenue Growth Rate in Military Contract Manufacturing Service Business (2021–2026)
Figure 87. Arc-Tronics Revenue Growth Rate in Military Contract Manufacturing Service Business (2021–2026)
Figure 88. Billet Industries Revenue Growth Rate in Military Contract Manufacturing Service Business (2021–2026)
Figure 89. Optikos Revenue Growth Rate in Military Contract Manufacturing Service Business (2021–2026)
Figure 90. Fermionx Revenue Growth Rate in Military Contract Manufacturing Service Business (2021–2026)
Figure 91. Nemco Revenue Growth Rate in Military Contract Manufacturing Service Business (2021–2026)
Figure 92. Pearson Engineering Revenue Growth Rate in Military Contract Manufacturing Service Business (2021–2026)
Figure 93. Bottom-up and Top-down Approaches for This Report
Figure 94. Data Triangulation
Figure 95. Key Executives Interviewed