List of Tables
Table 1. Global Alcoholism Treatment Market Size Growth Rate by Type (US$ Million): 2021 vs 2025 vs 2032
Table 2. Key Players of Cognitive Behavioral Therapy
Table 3. Key Players of Psychological Intervention
Table 4. Key Players of Drug Therapy
Table 5. Key Players of Others
Table 6. Global Alcoholism Treatment Market Size Growth Rate by Treatment Goals and Stages (US$ Million): 2021 vs 2025 vs 2032
Table 7. Key Players of Detoxification Treatment
Table 8. Key Players of Rehabilitation and Maintenance Treatment
Table 9. Global Alcoholism Treatment Market Size Growth Rate by Treatment Environment (US$ Million): 2021 vs 2025 vs 2032
Table 10. Key Players of Inpatient Treatment
Table 11. Key Players of Outpatient Treatment
Table 12. Key Players of Community and Self-Help Organizations
Table 13. Global Alcoholism Treatment Market Size Growth Rate by Target Populations (US$ Million): 2021 vs 2025 vs 2032
Table 14. Key Players of Treatment for Specific Groups
Table 15. Key Players of Treatment for the Elderly
Table 16. Key Players of Cultural and Faith Integration Therapy
Table 17. Global Alcoholism Treatment Market Size Growth by Application (US$ Million): 2021 vs 2025 vs 2032
Table 18. Global Alcoholism Treatment Market Size by Region (US$ Million): 2021 vs 2025 vs 2032
Table 19. Global Alcoholism Treatment Market Size by Region (US$ Million), 2021–2026
Table 20. Global Alcoholism Treatment Market Share by Region (2021–2026)
Table 21. Global Alcoholism Treatment Forecasted Market Size by Region (US$ Million), 2027–2032
Table 22. Global Alcoholism Treatment Market Share by Region (2027–2032)
Table 23. Alcoholism Treatment Market Trends
Table 24. Alcoholism Treatment Market Drivers
Table 25. Alcoholism Treatment Market Challenges
Table 26. Alcoholism Treatment Market Restraints
Table 27. Global Alcoholism Treatment Revenue by Players (US$ Million), 2021–2026
Table 28. Global Alcoholism Treatment Market Share by Players (2021–2026)
Table 29. Global Top Alcoholism Treatment Players by Tier (Tier 1, Tier 2, and Tier 3), based on Alcoholism Treatment Revenue, 2025
Table 30. Ranking of Global Top Alcoholism Treatment Companies by Revenue (US$ Million) in 2025
Table 31. Global 5 Largest Players Market Share by Alcoholism Treatment Revenue (CR5 and HHI), 2021–2026
Table 32. Global Key Players of Alcoholism Treatment, Headquarters and Area Served
Table 33. Global Key Players of Alcoholism Treatment, Products and Applications
Table 34. Global Key Players of Alcoholism Treatment, Date of General Availability (GA)
Table 35. Mergers and Acquisitions, Expansion Plans
Table 36. Global Alcoholism Treatment Market Size by Type (US$ Million), 2021–2026
Table 37. Global Alcoholism Treatment Revenue Market Share by Type (2021–2026)
Table 38. Global Alcoholism Treatment Forecasted Market Size by Type (US$ Million), 2027–2032
Table 39. Global Alcoholism Treatment Revenue Market Share by Type (2027–2032)
Table 40. Global Alcoholism Treatment Market Size by Application (US$ Million), 2021–2026
Table 41. Global Alcoholism Treatment Revenue Market Share by Application (2021–2026)
Table 42. Global Alcoholism Treatment Forecasted Market Size by Application (US$ Million), 2027–2032
Table 43. Global Alcoholism Treatment Revenue Market Share by Application (2027–2032)
Table 44. North America Alcoholism Treatment Market Size Growth Rate by Country (US$ Million): 2021 vs 2025 vs 2032
Table 45. North America Alcoholism Treatment Market Size by Country (US$ Million), 2021–2026
Table 46. North America Alcoholism Treatment Market Size by Country (US$ Million), 2027–2032
Table 47. Europe Alcoholism Treatment Market Size Growth Rate by Country (US$ Million): 2021 vs 2025 vs 2032
Table 48. Europe Alcoholism Treatment Market Size by Country (US$ Million), 2021–2026
Table 49. Europe Alcoholism Treatment Market Size by Country (US$ Million), 2027–2032
Table 50. Asia-Pacific Alcoholism Treatment Market Size Growth Rate by Region (US$ Million): 2021 vs 2025 vs 2032
Table 51. Asia-Pacific Alcoholism Treatment Market Size by Region (US$ Million), 2021–2026
Table 52. Asia-Pacific Alcoholism Treatment Market Size by Region (US$ Million), 2027–2032
Table 53. Latin America Alcoholism Treatment Market Size Growth Rate by Country (US$ Million): 2021 vs 2025 vs 2032
Table 54. Latin America Alcoholism Treatment Market Size by Country (US$ Million), 2021–2026
Table 55. Latin America Alcoholism Treatment Market Size by Country (US$ Million), 2027–2032
Table 56. Middle East & Africa Alcoholism Treatment Market Size Growth Rate by Country (US$ Million): 2021 vs 2025 vs 2032
Table 57. Middle East & Africa Alcoholism Treatment Market Size by Country (US$ Million), 2021–2026
Table 58. Middle East & Africa Alcoholism Treatment Market Size by Country (US$ Million), 2027–2032
Table 59. Bradford Health Services Company Details
Table 60. Bradford Health Services Business Overview
Table 61. Bradford Health Services Alcoholism Treatment Product
Table 62. Bradford Health Services Revenue in Alcoholism Treatment Business (US$ Million), 2021–2026
Table 63. Bradford Health Services Recent Development
Table 64. Andy Bhatti Company Details
Table 65. Andy Bhatti Business Overview
Table 66. Andy Bhatti Alcoholism Treatment Product
Table 67. Andy Bhatti Revenue in Alcoholism Treatment Business (US$ Million), 2021–2026
Table 68. Andy Bhatti Recent Development
Table 69. Caron Treatment Centers Company Details
Table 70. Caron Treatment Centers Business Overview
Table 71. Caron Treatment Centers Alcoholism Treatment Product
Table 72. Caron Treatment Centers Revenue in Alcoholism Treatment Business (US$ Million), 2021–2026
Table 73. Caron Treatment Centers Recent Development
Table 74. Silkworth Group Jersey Company Details
Table 75. Silkworth Group Jersey Business Overview
Table 76. Silkworth Group Jersey Alcoholism Treatment Product
Table 77. Silkworth Group Jersey Revenue in Alcoholism Treatment Business (US$ Million), 2021–2026
Table 78. Silkworth Group Jersey Recent Development
Table 79. Hazelden Betty Ford Company Details
Table 80. Hazelden Betty Ford Business Overview
Table 81. Hazelden Betty Ford Alcoholism Treatment Product
Table 82. Hazelden Betty Ford Revenue in Alcoholism Treatment Business (US$ Million), 2021–2026
Table 83. Hazelden Betty Ford Recent Development
Table 84. Forward Trust Company Details
Table 85. Forward Trust Business Overview
Table 86. Forward Trust Alcoholism Treatment Product
Table 87. Forward Trust Revenue in Alcoholism Treatment Business (US$ Million), 2021–2026
Table 88. Forward Trust Recent Development
Table 89. Vinland National Center Company Details
Table 90. Vinland National Center Business Overview
Table 91. Vinland National Center Alcoholism Treatment Product
Table 92. Vinland National Center Revenue in Alcoholism Treatment Business (US$ Million), 2021–2026
Table 93. Vinland National Center Recent Development
Table 94. WhiteSands Company Details
Table 95. WhiteSands Business Overview
Table 96. WhiteSands Alcoholism Treatment Product
Table 97. WhiteSands Revenue in Alcoholism Treatment Business (US$ Million), 2021–2026
Table 98. WhiteSands Recent Development
Table 99. Aiséirí Company Details
Table 100. Aiséirí Business Overview
Table 101. Aiséirí Alcoholism Treatment Product
Table 102. Aiséirí Revenue in Alcoholism Treatment Business (US$ Million), 2021–2026
Table 103. Aiséirí Recent Development
Table 104. Kaiser Permanente Company Details
Table 105. Kaiser Permanente Business Overview
Table 106. Kaiser Permanente Alcoholism Treatment Product
Table 107. Kaiser Permanente Revenue in Alcoholism Treatment Business (US$ Million), 2021–2026
Table 108. Kaiser Permanente Recent Development
Table 109. Crossroads Inc Company Details
Table 110. Crossroads Inc Business Overview
Table 111. Crossroads Inc Alcoholism Treatment Product
Table 112. Crossroads Inc Revenue in Alcoholism Treatment Business (US$ Million), 2021–2026
Table 113. Crossroads Inc Recent Development
Table 114. Fellowship Hall Company Details
Table 115. Fellowship Hall Business Overview
Table 116. Fellowship Hall Alcoholism Treatment Product
Table 117. Fellowship Hall Revenue in Alcoholism Treatment Business (US$ Million), 2021–2026
Table 118. Fellowship Hall Recent Development
Table 119. Ria Health Company Details
Table 120. Ria Health Business Overview
Table 121. Ria Health Alcoholism Treatment Product
Table 122. Ria Health Revenue in Alcoholism Treatment Business (US$ Million), 2021–2026
Table 123. Ria Health Recent Development
Table 124. Aware Recovery Care Company Details
Table 125. Aware Recovery Care Business Overview
Table 126. Aware Recovery Care Alcoholism Treatment Product
Table 127. Aware Recovery Care Revenue in Alcoholism Treatment Business (US$ Million), 2021–2026
Table 128. Aware Recovery Care Recent Development
Table 129. Pelago Health Company Details
Table 130. Pelago Health Business Overview
Table 131. Pelago Health Alcoholism Treatment Product
Table 132. Pelago Health Revenue in Alcoholism Treatment Business (US$ Million), 2021–2026
Table 133. Pelago Health Recent Development
Table 134. Research Programs/Design for This Report
Table 135. Key Data Information from Secondary Sources
Table 136. Key Data Information from Primary Sources
Table 137. Authors List of This Report
List of Figures
Figure 1. Alcoholism Treatment Picture
Figure 2. Global Alcoholism Treatment Market Size Comparison by Type (US$ Million), 2021–2032
Figure 3. Global Alcoholism Treatment Market Share by Type: 2025 vs 2032
Figure 4. Cognitive Behavioral Therapy Features
Figure 5. Psychological Intervention Features
Figure 6. Drug Therapy Features
Figure 7. Others Features
Figure 8. Global Alcoholism Treatment Market Size Comparison by Treatment Goals and Stages (US$ Million), 2021–2032
Figure 9. Detoxification Treatment Features
Figure 10. Rehabilitation and Maintenance Treatment Features
Figure 11. Global Alcoholism Treatment Market Size Comparison by Treatment Environment (US$ Million), 2021–2032
Figure 12. Inpatient Treatment Features
Figure 13. Outpatient Treatment Features
Figure 14. Community and Self-Help Organizations Features
Figure 15. Global Alcoholism Treatment Market Size Comparison by Target Populations (US$ Million), 2021–2032
Figure 16. Treatment for Specific Groups Features
Figure 17. Treatment for the Elderly Features
Figure 18. Cultural and Faith Integration Therapy Features
Figure 19. Global Alcoholism Treatment Market Size by Application (US$ Million), 2021–2032
Figure 20. Global Alcoholism Treatment Market Share by Application: 2025 vs 2032
Figure 21. Adults Case Studies
Figure 22. Teens Case Studies
Figure 23. Alcoholism Treatment Report Years Considered
Figure 24. Global Alcoholism Treatment Market Size (US$ Million), Year-over-Year: 2021–2032
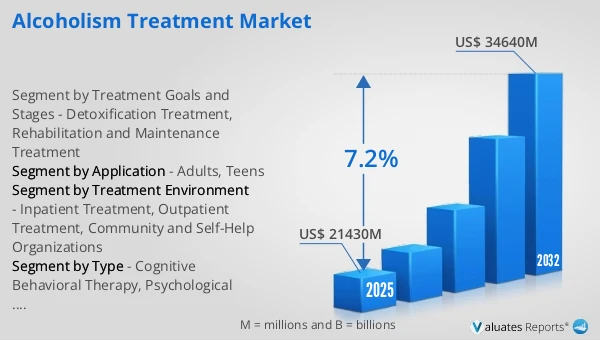
Figure 25. Global Alcoholism Treatment Market Size, (US$ Million), 2021 vs 2025 vs 2032
Figure 26. Global Alcoholism Treatment Market Share by Region: 2025 vs 2032
Figure 27. Global Alcoholism Treatment Market Share by Players in 2025
Figure 28. Global Alcoholism Treatment Market Share by Company Type (Tier 1, Tier 2, and Tier 3)
Figure 29. The Top 10 and 5 Players Market Share by Alcoholism Treatment Revenue in 2025
Figure 30. North America Alcoholism Treatment Market Size YoY Growth (US$ Million), 2021–2032
Figure 31. North America Alcoholism Treatment Market Share by Country (2021–2032)
Figure 32. United States Alcoholism Treatment Market Size YoY Growth (US$ Million), 2021–2032
Figure 33. Canada Alcoholism Treatment Market Size YoY Growth (US$ Million), 2021–2032
Figure 34. Europe Alcoholism Treatment Market Size YoY Growth (US$ Million), 2021–2032
Figure 35. Europe Alcoholism Treatment Market Share by Country (2021–2032)
Figure 36. Germany Alcoholism Treatment Market Size YoY Growth (US$ Million), 2021–2032
Figure 37. France Alcoholism Treatment Market Size YoY Growth (US$ Million), 2021–2032
Figure 38. U.K. Alcoholism Treatment Market Size YoY Growth (US$ Million), 2021–2032
Figure 39. Italy Alcoholism Treatment Market Size YoY Growth (US$ Million), 2021–2032
Figure 40. Russia Alcoholism Treatment Market Size YoY Growth (US$ Million), 2021–2032
Figure 41. Ireland Alcoholism Treatment Market Size YoY Growth (US$ Million), 2021–2032
Figure 42. Asia-Pacific Alcoholism Treatment Market Size YoY Growth (US$ Million), 2021–2032
Figure 43. Asia-Pacific Alcoholism Treatment Market Share by Region (2021–2032)
Figure 44. China Alcoholism Treatment Market Size YoY Growth (US$ Million), 2021–2032
Figure 45. Japan Alcoholism Treatment Market Size YoY Growth (US$ Million), 2021–2032
Figure 46. South Korea Alcoholism Treatment Market Size YoY Growth (US$ Million), 2021–2032
Figure 47. Southeast Asia Alcoholism Treatment Market Size YoY Growth (US$ Million), 2021–2032
Figure 48. India Alcoholism Treatment Market Size YoY Growth (US$ Million), 2021–2032
Figure 49. Australia & New Zealand Alcoholism Treatment Market Size YoY Growth (US$ Million), 2021–2032
Figure 50. Latin America Alcoholism Treatment Market Size YoY Growth (US$ Million), 2021–2032
Figure 51. Latin America Alcoholism Treatment Market Share by Country (2021–2032)
Figure 52. Mexico Alcoholism Treatment Market Size YoY Growth (US$ Million), 2021–2032
Figure 53. Brazil Alcoholism Treatment Market Size YoY Growth (US$ Million), 2021–2032
Figure 54. Middle East & Africa Alcoholism Treatment Market Size YoY Growth (US$ Million), 2021–2032
Figure 55. Middle East & Africa Alcoholism Treatment Market Share by Country (2021–2032)
Figure 56. Israel Alcoholism Treatment Market Size YoY Growth (US$ Million), 2021–2032
Figure 57. Saudi Arabia Alcoholism Treatment Market Size YoY Growth (US$ Million), 2021–2032
Figure 58. UAE Alcoholism Treatment Market Size YoY Growth (US$ Million), 2021–2032
Figure 59. Bradford Health Services Revenue Growth Rate in Alcoholism Treatment Business (2021–2026)
Figure 60. Andy Bhatti Revenue Growth Rate in Alcoholism Treatment Business (2021–2026)
Figure 61. Caron Treatment Centers Revenue Growth Rate in Alcoholism Treatment Business (2021–2026)
Figure 62. Silkworth Group Jersey Revenue Growth Rate in Alcoholism Treatment Business (2021–2026)
Figure 63. Hazelden Betty Ford Revenue Growth Rate in Alcoholism Treatment Business (2021–2026)
Figure 64. Forward Trust Revenue Growth Rate in Alcoholism Treatment Business (2021–2026)
Figure 65. Vinland National Center Revenue Growth Rate in Alcoholism Treatment Business (2021–2026)
Figure 66. WhiteSands Revenue Growth Rate in Alcoholism Treatment Business (2021–2026)
Figure 67. Aiséirí Revenue Growth Rate in Alcoholism Treatment Business (2021–2026)
Figure 68. Kaiser Permanente Revenue Growth Rate in Alcoholism Treatment Business (2021–2026)
Figure 69. Crossroads Inc Revenue Growth Rate in Alcoholism Treatment Business (2021–2026)
Figure 70. Fellowship Hall Revenue Growth Rate in Alcoholism Treatment Business (2021–2026)
Figure 71. Ria Health Revenue Growth Rate in Alcoholism Treatment Business (2021–2026)
Figure 72. Aware Recovery Care Revenue Growth Rate in Alcoholism Treatment Business (2021–2026)
Figure 73. Pelago Health Revenue Growth Rate in Alcoholism Treatment Business (2021–2026)
Figure 74. Bottom-up and Top-down Approaches for This Report
Figure 75. Data Triangulation
Figure 76. Key Executives Interviewed