List of Tables
Table 1. Global Chain Retail Plant Logistics Automation Market Size Growth Rate by Type (US$ Million): 2020 VS 2024 VS 2031
Table 2. Key Players of Automated Warehouse Systems
Table 3. Key Players of Automated Handling and Conveying Systems
Table 4. Key Players of Automated Sorting and Picking Systems
Table 5. Key Players of Electrical Control and Information Management Systems
Table 6. Global Chain Retail Plant Logistics Automation Market Size Growth Rate by Technology (US$ Million): 2020 VS 2024 VS 2031
Table 7. Key Players of Navigation and Positioning Technologies
Table 8. Key Players of Identification and Sensing Technologies
Table 9. Key Players of System Integration and Data Fusion
Table 10. Global Chain Retail Plant Logistics Automation Market Size Growth Rate by Product Function (US$ Million): 2020 VS 2024 VS 2031
Table 11. Key Players of 3D Storage
Table 12. Key Players of Mobile Handling
Table 13. Key Players of Sorting & Packaging
Table 14. Global Chain Retail Plant Logistics Automation Market Size Growth by Application (US$ Million): 2020 VS 2024 VS 2031
Table 15. Global Chain Retail Plant Logistics Automation Market Size by Region (US$ Million): 2020 VS 2024 VS 2031
Table 16. Global Chain Retail Plant Logistics Automation Market Size by Region (2020-2025) & (US$ Million)
Table 17. Global Chain Retail Plant Logistics Automation Market Share by Region (2020-2025)
Table 18. Global Chain Retail Plant Logistics Automation Forecasted Market Size by Region (2026-2031) & (US$ Million)
Table 19. Global Chain Retail Plant Logistics Automation Market Share by Region (2026-2031)
Table 20. Chain Retail Plant Logistics Automation Market Trends
Table 21. Chain Retail Plant Logistics Automation Market Drivers
Table 22. Chain Retail Plant Logistics Automation Market Challenges
Table 23. Chain Retail Plant Logistics Automation Market Restraints
Table 24. Global Chain Retail Plant Logistics Automation Revenue by Players (2020-2025) & (US$ Million)
Table 25. Global Chain Retail Plant Logistics Automation Market Share by Players (2020-2025)
Table 26. Global Top Chain Retail Plant Logistics Automation Players by Company Type (Tier 1, Tier 2, and Tier 3) & (based on the Revenue in Chain Retail Plant Logistics Automation as of 2024)
Table 27. Ranking of Global Top Chain Retail Plant Logistics Automation Companies by Revenue (US$ Million) in 2024
Table 28. Global 5 Largest Players Market Share by Chain Retail Plant Logistics Automation Revenue (CR5 and HHI) & (2020-2025)
Table 29. Global Key Players of Chain Retail Plant Logistics Automation, Headquarters and Area Served
Table 30. Global Key Players of Chain Retail Plant Logistics Automation, Product and Application
Table 31. Global Key Players of Chain Retail Plant Logistics Automation, Date of Enter into This Industry
Table 32. Mergers & Acquisitions, Expansion Plans
Table 33. Global Chain Retail Plant Logistics Automation Market Size by Type (2020-2025) & (US$ Million)
Table 34. Global Chain Retail Plant Logistics Automation Revenue Market Share by Type (2020-2025)
Table 35. Global Chain Retail Plant Logistics Automation Forecasted Market Size by Type (2026-2031) & (US$ Million)
Table 36. Global Chain Retail Plant Logistics Automation Revenue Market Share by Type (2026-2031)
Table 37. Global Chain Retail Plant Logistics Automation Market Size by Application (2020-2025) & (US$ Million)
Table 38. Global Chain Retail Plant Logistics Automation Revenue Market Share by Application (2020-2025)
Table 39. Global Chain Retail Plant Logistics Automation Forecasted Market Size by Application (2026-2031) & (US$ Million)
Table 40. Global Chain Retail Plant Logistics Automation Revenue Market Share by Application (2026-2031)
Table 41. North America Chain Retail Plant Logistics Automation Market Size Growth Rate by Country (US$ Million): 2020 VS 2024 VS 2031
Table 42. North America Chain Retail Plant Logistics Automation Market Size by Country (2020-2025) & (US$ Million)
Table 43. North America Chain Retail Plant Logistics Automation Market Size by Country (2026-2031) & (US$ Million)
Table 44. Europe Chain Retail Plant Logistics Automation Market Size Growth Rate by Country (US$ Million): 2020 VS 2024 VS 2031
Table 45. Europe Chain Retail Plant Logistics Automation Market Size by Country (2020-2025) & (US$ Million)
Table 46. Europe Chain Retail Plant Logistics Automation Market Size by Country (2026-2031) & (US$ Million)
Table 47. Asia-Pacific Chain Retail Plant Logistics Automation Market Size Growth Rate by Region (US$ Million): 2020 VS 2024 VS 2031
Table 48. Asia-Pacific Chain Retail Plant Logistics Automation Market Size by Region (2020-2025) & (US$ Million)
Table 49. Asia-Pacific Chain Retail Plant Logistics Automation Market Size by Region (2026-2031) & (US$ Million)
Table 50. Latin America Chain Retail Plant Logistics Automation Market Size Growth Rate by Country (US$ Million): 2020 VS 2024 VS 2031
Table 51. Latin America Chain Retail Plant Logistics Automation Market Size by Country (2020-2025) & (US$ Million)
Table 52. Latin America Chain Retail Plant Logistics Automation Market Size by Country (2026-2031) & (US$ Million)
Table 53. Middle East & Africa Chain Retail Plant Logistics Automation Market Size Growth Rate by Country (US$ Million): 2020 VS 2024 VS 2031
Table 54. Middle East & Africa Chain Retail Plant Logistics Automation Market Size by Country (2020-2025) & (US$ Million)
Table 55. Middle East & Africa Chain Retail Plant Logistics Automation Market Size by Country (2026-2031) & (US$ Million)
Table 56. Daifuku Co., Ltd. Company Details
Table 57. Daifuku Co., Ltd. Business Overview
Table 58. Daifuku Co., Ltd. Chain Retail Plant Logistics Automation Product
Table 59. Daifuku Co., Ltd. Revenue in Chain Retail Plant Logistics Automation Business (2020-2025) & (US$ Million)
Table 60. Daifuku Co., Ltd. Recent Development
Table 61. SSI Schaefer Company Details
Table 62. SSI Schaefer Business Overview
Table 63. SSI Schaefer Chain Retail Plant Logistics Automation Product
Table 64. SSI Schaefer Revenue in Chain Retail Plant Logistics Automation Business (2020-2025) & (US$ Million)
Table 65. SSI Schaefer Recent Development
Table 66. DEMATIC Company Details
Table 67. DEMATIC Business Overview
Table 68. DEMATIC Chain Retail Plant Logistics Automation Product
Table 69. DEMATIC Revenue in Chain Retail Plant Logistics Automation Business (2020-2025) & (US$ Million)
Table 70. DEMATIC Recent Development
Table 71. Honeywell Intelligrated Company Details
Table 72. Honeywell Intelligrated Business Overview
Table 73. Honeywell Intelligrated Chain Retail Plant Logistics Automation Product
Table 74. Honeywell Intelligrated Revenue in Chain Retail Plant Logistics Automation Business (2020-2025) & (US$ Million)
Table 75. Honeywell Intelligrated Recent Development
Table 76. Okamura Company Details
Table 77. Okamura Business Overview
Table 78. Okamura Chain Retail Plant Logistics Automation Product
Table 79. Okamura Revenue in Chain Retail Plant Logistics Automation Business (2020-2025) & (US$ Million)
Table 80. Okamura Recent Development
Table 81. Murata Machinery, Ltd. Company Details
Table 82. Murata Machinery, Ltd. Business Overview
Table 83. Murata Machinery, Ltd. Chain Retail Plant Logistics Automation Product
Table 84. Murata Machinery, Ltd. Revenue in Chain Retail Plant Logistics Automation Business (2020-2025) & (US$ Million)
Table 85. Murata Machinery, Ltd. Recent Development
Table 86. VanderLande Industries Company Details
Table 87. VanderLande Industries Business Overview
Table 88. VanderLande Industries Chain Retail Plant Logistics Automation Product
Table 89. VanderLande Industries Revenue in Chain Retail Plant Logistics Automation Business (2020-2025) & (US$ Million)
Table 90. VanderLande Industries Recent Development
Table 91. Knapp AG Company Details
Table 92. Knapp AG Business Overview
Table 93. Knapp AG Chain Retail Plant Logistics Automation Product
Table 94. Knapp AG Revenue in Chain Retail Plant Logistics Automation Business (2020-2025) & (US$ Million)
Table 95. Knapp AG Recent Development
Table 96. Swisslog (KUKA) Company Details
Table 97. Swisslog (KUKA) Business Overview
Table 98. Swisslog (KUKA) Chain Retail Plant Logistics Automation Product
Table 99. Swisslog (KUKA) Revenue in Chain Retail Plant Logistics Automation Business (2020-2025) & (US$ Million)
Table 100. Swisslog (KUKA) Recent Development
Table 101. Tianqi Automation Company Details
Table 102. Tianqi Automation Business Overview
Table 103. Tianqi Automation Chain Retail Plant Logistics Automation Product
Table 104. Tianqi Automation Revenue in Chain Retail Plant Logistics Automation Business (2020-2025) & (US$ Million)
Table 105. Tianqi Automation Recent Development
Table 106. Siemens Company Details
Table 107. Siemens Business Overview
Table 108. Siemens Chain Retail Plant Logistics Automation Product
Table 109. Siemens Revenue in Chain Retail Plant Logistics Automation Business (2020-2025) & (US$ Million)
Table 110. Siemens Recent Development
Table 111. Siasun Robot Company Details
Table 112. Siasun Robot Business Overview
Table 113. Siasun Robot Chain Retail Plant Logistics Automation Product
Table 114. Siasun Robot Revenue in Chain Retail Plant Logistics Automation Business (2020-2025) & (US$ Million)
Table 115. Siasun Robot Recent Development
Table 116. Shenzhen Jintian International Company Details
Table 117. Shenzhen Jintian International Business Overview
Table 118. Shenzhen Jintian International Chain Retail Plant Logistics Automation Product
Table 119. Shenzhen Jintian International Revenue in Chain Retail Plant Logistics Automation Business (2020-2025) & (US$ Million)
Table 120. Shenzhen Jintian International Recent Development
Table 121. Hubei Huachangda Intelligent Equipment Company Details
Table 122. Hubei Huachangda Intelligent Equipment Business Overview
Table 123. Hubei Huachangda Intelligent Equipment Chain Retail Plant Logistics Automation Product
Table 124. Hubei Huachangda Intelligent Equipment Revenue in Chain Retail Plant Logistics Automation Business (2020-2025) & (US$ Million)
Table 125. Hubei Huachangda Intelligent Equipment Recent Development
Table 126. Eisenmann SE Company Details
Table 127. Eisenmann SE Business Overview
Table 128. Eisenmann SE Chain Retail Plant Logistics Automation Product
Table 129. Eisenmann SE Revenue in Chain Retail Plant Logistics Automation Business (2020-2025) & (US$ Million)
Table 130. Eisenmann SE Recent Development
Table 131. Shanxi Dongjie Intelligent Company Details
Table 132. Shanxi Dongjie Intelligent Business Overview
Table 133. Shanxi Dongjie Intelligent Chain Retail Plant Logistics Automation Product
Table 134. Shanxi Dongjie Intelligent Revenue in Chain Retail Plant Logistics Automation Business (2020-2025) & (US$ Million)
Table 135. Shanxi Dongjie Intelligent Recent Development
Table 136. Shandong Lanjian Company Details
Table 137. Shandong Lanjian Business Overview
Table 138. Shandong Lanjian Chain Retail Plant Logistics Automation Product
Table 139. Shandong Lanjian Revenue in Chain Retail Plant Logistics Automation Business (2020-2025) & (US$ Million)
Table 140. Shandong Lanjian Recent Development
Table 141. Chengde Tianbao Machinery Co., Ltd. (Tianbao Group) Company Details
Table 142. Chengde Tianbao Machinery Co., Ltd. (Tianbao Group) Business Overview
Table 143. Chengde Tianbao Machinery Co., Ltd. (Tianbao Group) Chain Retail Plant Logistics Automation Product
Table 144. Chengde Tianbao Machinery Co., Ltd. (Tianbao Group) Revenue in Chain Retail Plant Logistics Automation Business (2020-2025) & (US$ Million)
Table 145. Chengde Tianbao Machinery Co., Ltd. (Tianbao Group) Recent Development
Table 146. Sanfeng Intelligent Company Details
Table 147. Sanfeng Intelligent Business Overview
Table 148. Sanfeng Intelligent Chain Retail Plant Logistics Automation Product
Table 149. Sanfeng Intelligent Revenue in Chain Retail Plant Logistics Automation Business (2020-2025) & (US$ Million)
Table 150. Sanfeng Intelligent Recent Development
Table 151. AFT Group Company Details
Table 152. AFT Group Business Overview
Table 153. AFT Group Chain Retail Plant Logistics Automation Product
Table 154. AFT Group Revenue in Chain Retail Plant Logistics Automation Business (2020-2025) & (US$ Million)
Table 155. AFT Group Recent Development
Table 156. Beijing Lifting and Transportation Machinery Design and Research Institute Company Details
Table 157. Beijing Lifting and Transportation Machinery Design and Research Institute Business Overview
Table 158. Beijing Lifting and Transportation Machinery Design and Research Institute Chain Retail Plant Logistics Automation Product
Table 159. Beijing Lifting and Transportation Machinery Design and Research Institute Revenue in Chain Retail Plant Logistics Automation Business (2020-2025) & (US$ Million)
Table 160. Beijing Lifting and Transportation Machinery Design and Research Institute Recent Development
Table 161. Shanghai EOS Company Details
Table 162. Shanghai EOS Business Overview
Table 163. Shanghai EOS Chain Retail Plant Logistics Automation Product
Table 164. Shanghai EOS Revenue in Chain Retail Plant Logistics Automation Business (2020-2025) & (US$ Million)
Table 165. Shanghai EOS Recent Development
Table 166. Taiyuan Gangyu Company Details
Table 167. Taiyuan Gangyu Business Overview
Table 168. Taiyuan Gangyu Chain Retail Plant Logistics Automation Product
Table 169. Taiyuan Gangyu Revenue in Chain Retail Plant Logistics Automation Business (2020-2025) & (US$ Million)
Table 170. Taiyuan Gangyu Recent Development
Table 171. Beijing Gaoke Logistics Warehousing Equipment Company Details
Table 172. Beijing Gaoke Logistics Warehousing Equipment Business Overview
Table 173. Beijing Gaoke Logistics Warehousing Equipment Chain Retail Plant Logistics Automation Product
Table 174. Beijing Gaoke Logistics Warehousing Equipment Revenue in Chain Retail Plant Logistics Automation Business (2020-2025) & (US$ Million)
Table 175. Beijing Gaoke Logistics Warehousing Equipment Recent Development
Table 176. Research Programs/Design for This Report
Table 177. Key Data Information from Secondary Sources
Table 178. Key Data Information from Primary Sources
Table 179. Authors List of This Report
List of Figures
Figure 1. Chain Retail Plant Logistics Automation Picture
Figure 2. Global Chain Retail Plant Logistics Automation Market Size Comparison by Type (2020-2031) & (US$ Million)
Figure 3. Global Chain Retail Plant Logistics Automation Market Share by Type: 2024 VS 2031
Figure 4. Automated Warehouse Systems Features
Figure 5. Automated Handling and Conveying Systems Features
Figure 6. Automated Sorting and Picking Systems Features
Figure 7. Electrical Control and Information Management Systems Features
Figure 8. Global Chain Retail Plant Logistics Automation Market Size Comparison by Technology (2020-2031) & (US$ Million)
Figure 9. Navigation and Positioning Technologies Features
Figure 10. Identification and Sensing Technologies Features
Figure 11. System Integration and Data Fusion Features
Figure 12. Global Chain Retail Plant Logistics Automation Market Size Comparison by Product Function (2020-2031) & (US$ Million)
Figure 13. 3D Storage Features
Figure 14. Mobile Handling Features
Figure 15. Sorting & Packaging Features
Figure 16. Global Chain Retail Plant Logistics Automation Market Size by Application (2020-2031) & (US$ Million)
Figure 17. Global Chain Retail Plant Logistics Automation Market Share by Application: 2024 VS 2031
Figure 18. Food and Beverage Case Studies
Figure 19. Household Chemicals Case Studies
Figure 20. Apparel and General Merchandise Case Studies
Figure 21. Hardware Products Case Studies
Figure 22. Other Case Studies
Figure 23. Chain Retail Plant Logistics Automation Report Years Considered
Figure 24. Global Chain Retail Plant Logistics Automation Market Size (US$ Million), Year-over-Year: 2020-2031
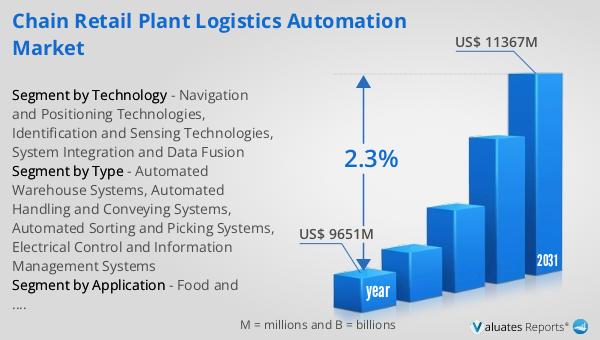
Figure 25. Global Chain Retail Plant Logistics Automation Market Size, (US$ Million), 2020 VS 2024 VS 2031
Figure 26. Global Chain Retail Plant Logistics Automation Market Share by Region: 2024 VS 2031
Figure 27. Global Chain Retail Plant Logistics Automation Market Share by Players in 2024
Figure 28. Global Chain Retail Plant Logistics Automation Market Share by Company Type (Tier 1, Tier 2, and Tier 3)
Figure 29. The Top 10 and 5 Players Market Share by Chain Retail Plant Logistics Automation Revenue in 2024
Figure 30. North America Chain Retail Plant Logistics Automation Market Size YoY Growth (2020-2031) & (US$ Million)
Figure 31. North America Chain Retail Plant Logistics Automation Market Share by Country (2020-2031)
Figure 32. United States Chain Retail Plant Logistics Automation Market Size YoY Growth (2020-2031) & (US$ Million)
Figure 33. Canada Chain Retail Plant Logistics Automation Market Size YoY Growth (2020-2031) & (US$ Million)
Figure 34. Europe Chain Retail Plant Logistics Automation Market Size YoY Growth (2020-2031) & (US$ Million)
Figure 35. Europe Chain Retail Plant Logistics Automation Market Share by Country (2020-2031)
Figure 36. Germany Chain Retail Plant Logistics Automation Market Size YoY Growth (2020-2031) & (US$ Million)
Figure 37. France Chain Retail Plant Logistics Automation Market Size YoY Growth (2020-2031) & (US$ Million)
Figure 38. U.K. Chain Retail Plant Logistics Automation Market Size YoY Growth (2020-2031) & (US$ Million)
Figure 39. Italy Chain Retail Plant Logistics Automation Market Size YoY Growth (2020-2031) & (US$ Million)
Figure 40. Russia Chain Retail Plant Logistics Automation Market Size YoY Growth (2020-2031) & (US$ Million)
Figure 41. Ireland Chain Retail Plant Logistics Automation Market Size YoY Growth (2020-2031) & (US$ Million)
Figure 42. Asia-Pacific Chain Retail Plant Logistics Automation Market Size YoY Growth (2020-2031) & (US$ Million)
Figure 43. Asia-Pacific Chain Retail Plant Logistics Automation Market Share by Region (2020-2031)
Figure 44. China Chain Retail Plant Logistics Automation Market Size YoY Growth (2020-2031) & (US$ Million)
Figure 45. Japan Chain Retail Plant Logistics Automation Market Size YoY Growth (2020-2031) & (US$ Million)
Figure 46. South Korea Chain Retail Plant Logistics Automation Market Size YoY Growth (2020-2031) & (US$ Million)
Figure 47. Southeast Asia Chain Retail Plant Logistics Automation Market Size YoY Growth (2020-2031) & (US$ Million)
Figure 48. India Chain Retail Plant Logistics Automation Market Size YoY Growth (2020-2031) & (US$ Million)
Figure 49. Australia & New Zealand Chain Retail Plant Logistics Automation Market Size YoY Growth (2020-2031) & (US$ Million)
Figure 50. Latin America Chain Retail Plant Logistics Automation Market Size YoY Growth (2020-2031) & (US$ Million)
Figure 51. Latin America Chain Retail Plant Logistics Automation Market Share by Country (2020-2031)
Figure 52. Mexico Chain Retail Plant Logistics Automation Market Size YoY Growth (2020-2031) & (US$ Million)
Figure 53. Brazil Chain Retail Plant Logistics Automation Market Size YoY Growth (2020-2031) & (US$ Million)
Figure 54. Middle East & Africa Chain Retail Plant Logistics Automation Market Size YoY Growth (2020-2031) & (US$ Million)
Figure 55. Middle East & Africa Chain Retail Plant Logistics Automation Market Share by Country (2020-2031)
Figure 56. Israel Chain Retail Plant Logistics Automation Market Size YoY Growth (2020-2031) & (US$ Million)
Figure 57. Saudi Arabia Chain Retail Plant Logistics Automation Market Size YoY Growth (2020-2031) & (US$ Million)
Figure 58. UAE Chain Retail Plant Logistics Automation Market Size YoY Growth (2020-2031) & (US$ Million)
Figure 59. Daifuku Co., Ltd. Revenue Growth Rate in Chain Retail Plant Logistics Automation Business (2020-2025)
Figure 60. SSI Schaefer Revenue Growth Rate in Chain Retail Plant Logistics Automation Business (2020-2025)
Figure 61. DEMATIC Revenue Growth Rate in Chain Retail Plant Logistics Automation Business (2020-2025)
Figure 62. Honeywell Intelligrated Revenue Growth Rate in Chain Retail Plant Logistics Automation Business (2020-2025)
Figure 63. Okamura Revenue Growth Rate in Chain Retail Plant Logistics Automation Business (2020-2025)
Figure 64. Murata Machinery, Ltd. Revenue Growth Rate in Chain Retail Plant Logistics Automation Business (2020-2025)
Figure 65. VanderLande Industries Revenue Growth Rate in Chain Retail Plant Logistics Automation Business (2020-2025)
Figure 66. Knapp AG Revenue Growth Rate in Chain Retail Plant Logistics Automation Business (2020-2025)
Figure 67. Swisslog (KUKA) Revenue Growth Rate in Chain Retail Plant Logistics Automation Business (2020-2025)
Figure 68. Tianqi Automation Revenue Growth Rate in Chain Retail Plant Logistics Automation Business (2020-2025)
Figure 69. Siemens Revenue Growth Rate in Chain Retail Plant Logistics Automation Business (2020-2025)
Figure 70. Siasun Robot Revenue Growth Rate in Chain Retail Plant Logistics Automation Business (2020-2025)
Figure 71. Shenzhen Jintian International Revenue Growth Rate in Chain Retail Plant Logistics Automation Business (2020-2025)
Figure 72. Hubei Huachangda Intelligent Equipment Revenue Growth Rate in Chain Retail Plant Logistics Automation Business (2020-2025)
Figure 73. Eisenmann SE Revenue Growth Rate in Chain Retail Plant Logistics Automation Business (2020-2025)
Figure 74. Shanxi Dongjie Intelligent Revenue Growth Rate in Chain Retail Plant Logistics Automation Business (2020-2025)
Figure 75. Shandong Lanjian Revenue Growth Rate in Chain Retail Plant Logistics Automation Business (2020-2025)
Figure 76. Chengde Tianbao Machinery Co., Ltd. (Tianbao Group) Revenue Growth Rate in Chain Retail Plant Logistics Automation Business (2020-2025)
Figure 77. Sanfeng Intelligent Revenue Growth Rate in Chain Retail Plant Logistics Automation Business (2020-2025)
Figure 78. AFT Group Revenue Growth Rate in Chain Retail Plant Logistics Automation Business (2020-2025)
Figure 79. Beijing Lifting and Transportation Machinery Design and Research Institute Revenue Growth Rate in Chain Retail Plant Logistics Automation Business (2020-2025)
Figure 80. Shanghai EOS Revenue Growth Rate in Chain Retail Plant Logistics Automation Business (2020-2025)
Figure 81. Taiyuan Gangyu Revenue Growth Rate in Chain Retail Plant Logistics Automation Business (2020-2025)
Figure 82. Beijing Gaoke Logistics Warehousing Equipment Revenue Growth Rate in Chain Retail Plant Logistics Automation Business (2020-2025)
Figure 83. Bottom-up and Top-down Approaches for This Report
Figure 84. Data Triangulation
Figure 85. Key Executives Interviewed