List of Tables
Table 1. Global One-Stop Service for Commercial Dispute Market Size Growth Rate by Type (US$ Million): 2020 VS 2024 VS 2031
Table 2. Key Players of Dispute Prevention Service
Table 3. Key Players of Dispute Resolution Service
Table 4. Key Players of Dispute Enforcement and Management Service
Table 5. Global One-Stop Service for Commercial Dispute Market Size Growth Rate by Service Model (US$ Million): 2020 VS 2024 VS 2031
Table 6. Key Players of Online Platform Service
Table 7. Key Players of Offline Comprehensive Service
Table 8. Global One-Stop Service for Commercial Dispute Market Size Growth Rate by Technology Classification (US$ Million): 2020 VS 2024 VS 2031
Table 9. Key Players of Intelligent Mediation Platform
Table 10. Key Players of Blockchain and Evidence Storage Platform
Table 11. Global One-Stop Service for Commercial Dispute Market Size Growth by Application (US$ Million): 2020 VS 2024 VS 2031
Table 12. Global One-Stop Service for Commercial Dispute Market Size by Region (US$ Million): 2020 VS 2024 VS 2031
Table 13. Global One-Stop Service for Commercial Dispute Market Size by Region (2020-2025) & (US$ Million)
Table 14. Global One-Stop Service for Commercial Dispute Market Share by Region (2020-2025)
Table 15. Global One-Stop Service for Commercial Dispute Forecasted Market Size by Region (2026-2031) & (US$ Million)
Table 16. Global One-Stop Service for Commercial Dispute Market Share by Region (2026-2031)
Table 17. One-Stop Service for Commercial Dispute Market Trends
Table 18. One-Stop Service for Commercial Dispute Market Drivers
Table 19. One-Stop Service for Commercial Dispute Market Challenges
Table 20. One-Stop Service for Commercial Dispute Market Restraints
Table 21. Global One-Stop Service for Commercial Dispute Revenue by Players (2020-2025) & (US$ Million)
Table 22. Global One-Stop Service for Commercial Dispute Market Share by Players (2020-2025)
Table 23. Global Top One-Stop Service for Commercial Dispute Players by Company Type (Tier 1, Tier 2, and Tier 3) & (based on the Revenue in One-Stop Service for Commercial Dispute as of 2024)
Table 24. Ranking of Global Top One-Stop Service for Commercial Dispute Companies by Revenue (US$ Million) in 2024
Table 25. Global 5 Largest Players Market Share by One-Stop Service for Commercial Dispute Revenue (CR5 and HHI) & (2020-2025)
Table 26. Global Key Players of One-Stop Service for Commercial Dispute, Headquarters and Area Served
Table 27. Global Key Players of One-Stop Service for Commercial Dispute, Product and Application
Table 28. Global Key Players of One-Stop Service for Commercial Dispute, Date of Enter into This Industry
Table 29. Mergers & Acquisitions, Expansion Plans
Table 30. Global One-Stop Service for Commercial Dispute Market Size by Type (2020-2025) & (US$ Million)
Table 31. Global One-Stop Service for Commercial Dispute Revenue Market Share by Type (2020-2025)
Table 32. Global One-Stop Service for Commercial Dispute Forecasted Market Size by Type (2026-2031) & (US$ Million)
Table 33. Global One-Stop Service for Commercial Dispute Revenue Market Share by Type (2026-2031)
Table 34. Global One-Stop Service for Commercial Dispute Market Size by Application (2020-2025) & (US$ Million)
Table 35. Global One-Stop Service for Commercial Dispute Revenue Market Share by Application (2020-2025)
Table 36. Global One-Stop Service for Commercial Dispute Forecasted Market Size by Application (2026-2031) & (US$ Million)
Table 37. Global One-Stop Service for Commercial Dispute Revenue Market Share by Application (2026-2031)
Table 38. North America One-Stop Service for Commercial Dispute Market Size Growth Rate by Country (US$ Million): 2020 VS 2024 VS 2031
Table 39. North America One-Stop Service for Commercial Dispute Market Size by Country (2020-2025) & (US$ Million)
Table 40. North America One-Stop Service for Commercial Dispute Market Size by Country (2026-2031) & (US$ Million)
Table 41. Europe One-Stop Service for Commercial Dispute Market Size Growth Rate by Country (US$ Million): 2020 VS 2024 VS 2031
Table 42. Europe One-Stop Service for Commercial Dispute Market Size by Country (2020-2025) & (US$ Million)
Table 43. Europe One-Stop Service for Commercial Dispute Market Size by Country (2026-2031) & (US$ Million)
Table 44. Asia-Pacific One-Stop Service for Commercial Dispute Market Size Growth Rate by Region (US$ Million): 2020 VS 2024 VS 2031
Table 45. Asia-Pacific One-Stop Service for Commercial Dispute Market Size by Region (2020-2025) & (US$ Million)
Table 46. Asia-Pacific One-Stop Service for Commercial Dispute Market Size by Region (2026-2031) & (US$ Million)
Table 47. Latin America One-Stop Service for Commercial Dispute Market Size Growth Rate by Country (US$ Million): 2020 VS 2024 VS 2031
Table 48. Latin America One-Stop Service for Commercial Dispute Market Size by Country (2020-2025) & (US$ Million)
Table 49. Latin America One-Stop Service for Commercial Dispute Market Size by Country (2026-2031) & (US$ Million)
Table 50. Middle East & Africa One-Stop Service for Commercial Dispute Market Size Growth Rate by Country (US$ Million): 2020 VS 2024 VS 2031
Table 51. Middle East & Africa One-Stop Service for Commercial Dispute Market Size by Country (2020-2025) & (US$ Million)
Table 52. Middle East & Africa One-Stop Service for Commercial Dispute Market Size by Country (2026-2031) & (US$ Million)
Table 53. JAMS Company Details
Table 54. JAMS Business Overview
Table 55. JAMS One-Stop Service for Commercial Dispute Product
Table 56. JAMS Revenue in One-Stop Service for Commercial Dispute Business (2020-2025) & (US$ Million)
Table 57. JAMS Recent Development
Table 58. American Arbitration Association Company Details
Table 59. American Arbitration Association Business Overview
Table 60. American Arbitration Association One-Stop Service for Commercial Dispute Product
Table 61. American Arbitration Association Revenue in One-Stop Service for Commercial Dispute Business (2020-2025) & (US$ Million)
Table 62. American Arbitration Association Recent Development
Table 63. ICC International Court of Arbitration Company Details
Table 64. ICC International Court of Arbitration Business Overview
Table 65. ICC International Court of Arbitration One-Stop Service for Commercial Dispute Product
Table 66. ICC International Court of Arbitration Revenue in One-Stop Service for Commercial Dispute Business (2020-2025) & (US$ Million)
Table 67. ICC International Court of Arbitration Recent Development
Table 68. LCIA Company Details
Table 69. LCIA Business Overview
Table 70. LCIA One-Stop Service for Commercial Dispute Product
Table 71. LCIA Revenue in One-Stop Service for Commercial Dispute Business (2020-2025) & (US$ Million)
Table 72. LCIA Recent Development
Table 73. Singapore International Arbitration Centre Company Details
Table 74. Singapore International Arbitration Centre Business Overview
Table 75. Singapore International Arbitration Centre One-Stop Service for Commercial Dispute Product
Table 76. Singapore International Arbitration Centre Revenue in One-Stop Service for Commercial Dispute Business (2020-2025) & (US$ Million)
Table 77. Singapore International Arbitration Centre Recent Development
Table 78. HKIAC Company Details
Table 79. HKIAC Business Overview
Table 80. HKIAC One-Stop Service for Commercial Dispute Product
Table 81. HKIAC Revenue in One-Stop Service for Commercial Dispute Business (2020-2025) & (US$ Million)
Table 82. HKIAC Recent Development
Table 83. SCC Company Details
Table 84. SCC Business Overview
Table 85. SCC One-Stop Service for Commercial Dispute Product
Table 86. SCC Revenue in One-Stop Service for Commercial Dispute Business (2020-2025) & (US$ Million)
Table 87. SCC Recent Development
Table 88. Baker McKenzie Company Details
Table 89. Baker McKenzie Business Overview
Table 90. Baker McKenzie One-Stop Service for Commercial Dispute Product
Table 91. Baker McKenzie Revenue in One-Stop Service for Commercial Dispute Business (2020-2025) & (US$ Million)
Table 92. Baker McKenzie Recent Development
Table 93. Clifford Chance Company Details
Table 94. Clifford Chance Business Overview
Table 95. Clifford Chance One-Stop Service for Commercial Dispute Product
Table 96. Clifford Chance Revenue in One-Stop Service for Commercial Dispute Business (2020-2025) & (US$ Million)
Table 97. Clifford Chance Recent Development
Table 98. Deloitte Company Details
Table 99. Deloitte Business Overview
Table 100. Deloitte One-Stop Service for Commercial Dispute Product
Table 101. Deloitte Revenue in One-Stop Service for Commercial Dispute Business (2020-2025) & (US$ Million)
Table 102. Deloitte Recent Development
Table 103. LegalZoom Company Details
Table 104. LegalZoom Business Overview
Table 105. LegalZoom One-Stop Service for Commercial Dispute Product
Table 106. LegalZoom Revenue in One-Stop Service for Commercial Dispute Business (2020-2025) & (US$ Million)
Table 107. LegalZoom Recent Development
Table 108. Rocket Lawyer Company Details
Table 109. Rocket Lawyer Business Overview
Table 110. Rocket Lawyer One-Stop Service for Commercial Dispute Product
Table 111. Rocket Lawyer Revenue in One-Stop Service for Commercial Dispute Business (2020-2025) & (US$ Million)
Table 112. Rocket Lawyer Recent Development
Table 113. Elevate Services Company Details
Table 114. Elevate Services Business Overview
Table 115. Elevate Services One-Stop Service for Commercial Dispute Product
Table 116. Elevate Services Revenue in One-Stop Service for Commercial Dispute Business (2020-2025) & (US$ Million)
Table 117. Elevate Services Recent Development
Table 118. Shenzhen Fadada Internet Technology Company Company Details
Table 119. Shenzhen Fadada Internet Technology Company Business Overview
Table 120. Shenzhen Fadada Internet Technology Company One-Stop Service for Commercial Dispute Product
Table 121. Shenzhen Fadada Internet Technology Company Revenue in One-Stop Service for Commercial Dispute Business (2020-2025) & (US$ Million)
Table 122. Shenzhen Fadada Internet Technology Company Recent Development
Table 123. Yunpin Company Details
Table 124. Yunpin Business Overview
Table 125. Yunpin One-Stop Service for Commercial Dispute Product
Table 126. Yunpin Revenue in One-Stop Service for Commercial Dispute Business (2020-2025) & (US$ Million)
Table 127. Yunpin Recent Development
Table 128. Beijing Faxin Technology Company Details
Table 129. Beijing Faxin Technology Business Overview
Table 130. Beijing Faxin Technology One-Stop Service for Commercial Dispute Product
Table 131. Beijing Faxin Technology Revenue in One-Stop Service for Commercial Dispute Business (2020-2025) & (US$ Million)
Table 132. Beijing Faxin Technology Recent Development
Table 133. Research Programs/Design for This Report
Table 134. Key Data Information from Secondary Sources
Table 135. Key Data Information from Primary Sources
Table 136. Authors List of This Report
List of Figures
Figure 1. One-Stop Service for Commercial Dispute Picture
Figure 2. Global One-Stop Service for Commercial Dispute Market Size Comparison by Type (2020-2031) & (US$ Million)
Figure 3. Global One-Stop Service for Commercial Dispute Market Share by Type: 2024 VS 2031
Figure 4. Dispute Prevention Service Features
Figure 5. Dispute Resolution Service Features
Figure 6. Dispute Enforcement and Management Service Features
Figure 7. Global One-Stop Service for Commercial Dispute Market Size Comparison by Service Model (2020-2031) & (US$ Million)
Figure 8. Online Platform Service Features
Figure 9. Offline Comprehensive Service Features
Figure 10. Global One-Stop Service for Commercial Dispute Market Size Comparison by Technology Classification (2020-2031) & (US$ Million)
Figure 11. Intelligent Mediation Platform Features
Figure 12. Blockchain and Evidence Storage Platform Features
Figure 13. Global One-Stop Service for Commercial Dispute Market Size by Application (2020-2031) & (US$ Million)
Figure 14. Global One-Stop Service for Commercial Dispute Market Share by Application: 2024 VS 2031
Figure 15. Urban Planning Case Studies
Figure 16. Real Estate Development Industry Case Studies
Figure 17. Interior Design Industry Case Studies
Figure 18. Others Case Studies
Figure 19. One-Stop Service for Commercial Dispute Report Years Considered
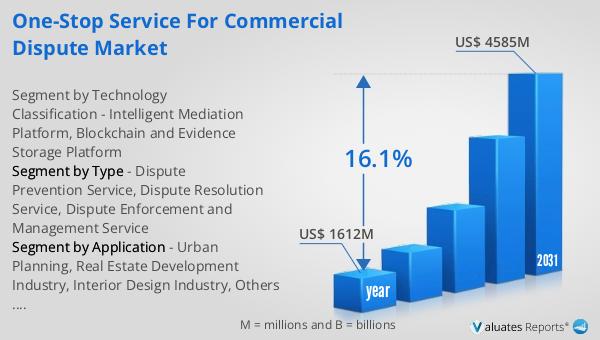
Figure 20. Global One-Stop Service for Commercial Dispute Market Size (US$ Million), Year-over-Year: 2020-2031
Figure 21. Global One-Stop Service for Commercial Dispute Market Size, (US$ Million), 2020 VS 2024 VS 2031
Figure 22. Global One-Stop Service for Commercial Dispute Market Share by Region: 2024 VS 2031
Figure 23. Global One-Stop Service for Commercial Dispute Market Share by Players in 2024
Figure 24. Global One-Stop Service for Commercial Dispute Market Share by Company Type (Tier 1, Tier 2, and Tier 3)
Figure 25. The Top 10 and 5 Players Market Share by One-Stop Service for Commercial Dispute Revenue in 2024
Figure 26. North America One-Stop Service for Commercial Dispute Market Size YoY Growth (2020-2031) & (US$ Million)
Figure 27. North America One-Stop Service for Commercial Dispute Market Share by Country (2020-2031)
Figure 28. United States One-Stop Service for Commercial Dispute Market Size YoY Growth (2020-2031) & (US$ Million)
Figure 29. Canada One-Stop Service for Commercial Dispute Market Size YoY Growth (2020-2031) & (US$ Million)
Figure 30. Europe One-Stop Service for Commercial Dispute Market Size YoY Growth (2020-2031) & (US$ Million)
Figure 31. Europe One-Stop Service for Commercial Dispute Market Share by Country (2020-2031)
Figure 32. Germany One-Stop Service for Commercial Dispute Market Size YoY Growth (2020-2031) & (US$ Million)
Figure 33. France One-Stop Service for Commercial Dispute Market Size YoY Growth (2020-2031) & (US$ Million)
Figure 34. U.K. One-Stop Service for Commercial Dispute Market Size YoY Growth (2020-2031) & (US$ Million)
Figure 35. Italy One-Stop Service for Commercial Dispute Market Size YoY Growth (2020-2031) & (US$ Million)
Figure 36. Russia One-Stop Service for Commercial Dispute Market Size YoY Growth (2020-2031) & (US$ Million)
Figure 37. Ireland One-Stop Service for Commercial Dispute Market Size YoY Growth (2020-2031) & (US$ Million)
Figure 38. Asia-Pacific One-Stop Service for Commercial Dispute Market Size YoY Growth (2020-2031) & (US$ Million)
Figure 39. Asia-Pacific One-Stop Service for Commercial Dispute Market Share by Region (2020-2031)
Figure 40. China One-Stop Service for Commercial Dispute Market Size YoY Growth (2020-2031) & (US$ Million)
Figure 41. Japan One-Stop Service for Commercial Dispute Market Size YoY Growth (2020-2031) & (US$ Million)
Figure 42. South Korea One-Stop Service for Commercial Dispute Market Size YoY Growth (2020-2031) & (US$ Million)
Figure 43. Southeast Asia One-Stop Service for Commercial Dispute Market Size YoY Growth (2020-2031) & (US$ Million)
Figure 44. India One-Stop Service for Commercial Dispute Market Size YoY Growth (2020-2031) & (US$ Million)
Figure 45. Australia & New Zealand One-Stop Service for Commercial Dispute Market Size YoY Growth (2020-2031) & (US$ Million)
Figure 46. Latin America One-Stop Service for Commercial Dispute Market Size YoY Growth (2020-2031) & (US$ Million)
Figure 47. Latin America One-Stop Service for Commercial Dispute Market Share by Country (2020-2031)
Figure 48. Mexico One-Stop Service for Commercial Dispute Market Size YoY Growth (2020-2031) & (US$ Million)
Figure 49. Brazil One-Stop Service for Commercial Dispute Market Size YoY Growth (2020-2031) & (US$ Million)
Figure 50. Middle East & Africa One-Stop Service for Commercial Dispute Market Size YoY Growth (2020-2031) & (US$ Million)
Figure 51. Middle East & Africa One-Stop Service for Commercial Dispute Market Share by Country (2020-2031)
Figure 52. Israel One-Stop Service for Commercial Dispute Market Size YoY Growth (2020-2031) & (US$ Million)
Figure 53. Saudi Arabia One-Stop Service for Commercial Dispute Market Size YoY Growth (2020-2031) & (US$ Million)
Figure 54. UAE One-Stop Service for Commercial Dispute Market Size YoY Growth (2020-2031) & (US$ Million)
Figure 55. JAMS Revenue Growth Rate in One-Stop Service for Commercial Dispute Business (2020-2025)
Figure 56. American Arbitration Association Revenue Growth Rate in One-Stop Service for Commercial Dispute Business (2020-2025)
Figure 57. ICC International Court of Arbitration Revenue Growth Rate in One-Stop Service for Commercial Dispute Business (2020-2025)
Figure 58. LCIA Revenue Growth Rate in One-Stop Service for Commercial Dispute Business (2020-2025)
Figure 59. Singapore International Arbitration Centre Revenue Growth Rate in One-Stop Service for Commercial Dispute Business (2020-2025)
Figure 60. HKIAC Revenue Growth Rate in One-Stop Service for Commercial Dispute Business (2020-2025)
Figure 61. SCC Revenue Growth Rate in One-Stop Service for Commercial Dispute Business (2020-2025)
Figure 62. Baker McKenzie Revenue Growth Rate in One-Stop Service for Commercial Dispute Business (2020-2025)
Figure 63. Clifford Chance Revenue Growth Rate in One-Stop Service for Commercial Dispute Business (2020-2025)
Figure 64. Deloitte Revenue Growth Rate in One-Stop Service for Commercial Dispute Business (2020-2025)
Figure 65. LegalZoom Revenue Growth Rate in One-Stop Service for Commercial Dispute Business (2020-2025)
Figure 66. Rocket Lawyer Revenue Growth Rate in One-Stop Service for Commercial Dispute Business (2020-2025)
Figure 67. Elevate Services Revenue Growth Rate in One-Stop Service for Commercial Dispute Business (2020-2025)
Figure 68. Shenzhen Fadada Internet Technology Company Revenue Growth Rate in One-Stop Service for Commercial Dispute Business (2020-2025)
Figure 69. Yunpin Revenue Growth Rate in One-Stop Service for Commercial Dispute Business (2020-2025)
Figure 70. Beijing Faxin Technology Revenue Growth Rate in One-Stop Service for Commercial Dispute Business (2020-2025)
Figure 71. Bottom-up and Top-down Approaches for This Report
Figure 72. Data Triangulation
Figure 73. Key Executives Interviewed