0
U.S. (TOLL FREE)
+1 (315) 215-3225
Automative

0
U.S. (TOLL FREE)
+1 (315) 215-3225
Global Energy Transition in Manufacturing Market Research Report 2026
Published Date: 2026-05-15
|
Report Code: QYRE-Auto-22O20215
Home | Market Reports | Business & Industrial| Energy & Utilities
Global Energy Transition in Manufacturing Market Research Report 2026
BUY CHAPTERS

Global Energy Transition in Manufacturing Market Research Report 2026

Code: QYRE-Auto-22O20215
Report
2026-05-15
Pages:161
QYResearch
Buy Now with 15% Discount
DESCRIPTION
TABLE OF CONTENT
TABLES & FIGURES

Energy Transition in Manufacturing Market Size

The global Energy Transition in Manufacturing market was valued at US$ 2120 million in 2025 and is anticipated to reach US$ 3245 million by 2032, at a CAGR of 6.2% from 2026 to 2032.

Energy Transition in Manufacturing Market

Energy Transition in Manufacturing Market

Energy Transition in Manufacturing refers to the systematic shift of manufacturing enterprises from an energy consumption model primarily based on fossil fuels (coal, oil, and natural gas) to a highly efficient and clean production system based on low-carbon/zero-carbon energy sources such as green electricity, hydrogen, and biomass energy through technological upgrades, energy structure optimization, and management innovation. Its core components include: electrification of end-use energy such as industrial heat pumps and electric boilers; introduction of low-carbon energy sources such as photovoltaics, wind power, and green hydrogen; deployment of carbon capture, utilization, and storage (CCS) devices to treat process emissions; and the use of digital energy management systems for real-time monitoring and optimized scheduling. This transformation aims to reduce carbon emissions and energy intensity throughout the entire lifecycle of manufacturing and is a key path to addressing climate change, meeting carbon tariff compliance requirements, and enhancing industrial competitiveness.
The global Energy Transition in Manufacturing is showing significant regional differences. China, focusing on energy-intensive industries such as steel and chemicals, is leading in areas like hydrogen-based direct reduction of iron, water electrolysis for hydrogen production, and zero-carbon plant pilot projects, leveraging policy subsidies and declining green electricity costs. However, it faces challenges such as insufficient maturity of key technologies and grid peak-shaving pressure. Europe, driven by carbon border adjustment mechanisms and the energy crisis, is accelerating industrial heat pumps, carbon capture and storage (CFS), and green hydrogen alternatives, but high natural gas prices and approval processes are hindering the pace of adoption. The US is promoting industrial electrification and carbon capture projects through tax credits under the Inflation Reduction Act, but aging infrastructure and supply chain bottlenecks are prominent. Japan is focusing on hydrogen-reduction steelmaking and digital energy management systems, but its low renewable energy share is dragging down green electricity acquisition. The current market situation is characterized by the coexistence of electrification and low-carbon fuel technologies, but cost is the main obstacle to scaling up. It is projected that the costs of industrial heat pumps and green hydrogen will decrease by 30% and 50%, respectively, by 2030. Future trends include the commercialization of electrothermal steam cracking, the expansion of hydrogen metallurgical capacity in the steel industry, and the construction of carbon capture and storage clusters. Key obstacles include: high costs of green hydrogen storage and transportation, large demand for grid capacity expansion due to industrial electrification, competitive imbalances caused by inconsistent global carbon pricing, and the inability of technologies such as high-temperature heat pumps to cover all industrial heat demands.
This report delivers a comprehensive overview of the global Energy Transition in Manufacturing market, with both quantitative and qualitative analyses, to help readers develop growth strategies, assess the competitive landscape, evaluate their position in the current market, and make informed business decisions regarding Energy Transition in Manufacturing. The Energy Transition in Manufacturing market size, estimates, and forecasts are provided in terms of revenue (US$ millions), with 2025 as the base year and historical and forecast data for 2021–2032.
The report segments the global Energy Transition in Manufacturing market comprehensively. Regional market sizes by Type, by Application, by Technology, and by player are also provided. For deeper insight, the report profiles the competitive landscape, key competitors, and their respective market rankings, and discusses technological trends and new product developments.
This report will assist Energy Transition in Manufacturing manufacturers, new entrants, and companies across the industry value chain with information on revenues, sales volume, and average prices for the overall market and its sub-segments, by company, by Type, by Application, and by region.
Market Segmentation

Scope of Energy Transition in Manufacturing Market Report

Report Metric Details
Report Name Energy Transition in Manufacturing Market
Accounted market size in 2025 US$ 2120 million
Forecasted market size in 2032 US$ 3245 million
CAGR 6.2%
Base Year 2025
Forecasted years 2026 - 2032
Segment by Type
  • Single-Point Energy Saving
  • System Optimization
  • Energy Substitution
  • Process Reconfiguration
  • Zero-Carbon Factory
Segment by Technology
  • Electrification of End-Use Energy
  • Low-Carbon Fuel Substitution
  • Green Electricity Direct Supply and Microgrids
  • Carbon Capture, Utilization and Storage
  • Waste Heat and Pressure Recovery
  • Others
Segment by Power
  • <10 kW
  • 10 kW-100 kW
  • 100 kW-1 MW
  • 1MW-10 MW
  • 10 MW -50 MW
  • >50 MW
Segment by Application
  • Steel
  • Chemicals
  • Cement
  • Non-ferrous Metals
  • General Manufacturing
  • Others
By Region
  • North America (United States, Canada)
  • Europe (Germany, France, UK, Italy, Russia) Rest of Europe
  • Nordic Countries
  • Asia-Pacific (China, Japan, South Korea)
  • Southeast Asia (India, Australia)
  • Rest of Asia
  • Latin America (Mexico, Brazil)
  • Rest of Latin America
  • Middle East & Africa (Turkey, Saudi Arabia, UAE, Rest of MEA)
By Company Mitsubishi Heavy Industries, Toshiba, Hitachi Zosen, Fuji Electric, Panasonic, Siemens, ABB, Schneider Electric, Thyssenkrupp, Veolia, GE Vernova, Honeywell, Emerson, Cummins, POSCO, Ameresco, Veregy, Sulzer, Baker Hughes, Wärtsilä Energy, SolydEra, TECNALIA, Harbin Electric Corporation, LONGi Green Energy, CATL, Envision, Trinasolar
Forecast units USD million in value
Report coverage Revenue and volume forecast, company share, competitive landscape, growth factors and trends

Chapter Outline

  • Chapter 1: Defines the scope of the report and presents an executive summary of market segments (by Type, by Application, by Technology, etc.), including the size of each segment and its future growth potential. It offers a high-level view of the current market and its likely evolution in the short, medium, and long term.
  • Chapter 2: Summarizes global and regional market size and outlines market dynamics and recent developments, including key drivers, restraints, challenges and risks for industry participants, and relevant policy analysis.
  • Chapter 3: Provides a detailed view of the competitive landscape for Energy Transition in Manufacturing companies, covering revenue share, development plans, and mergers and acquisitions.
  • Chapter 4: Analyzes segments by Type, detailing the size and growth potential of each segment to help readers identify blue-ocean opportunities.
  • Chapter 5: Analyzes segments by Application, detailing the size and growth potential of each downstream segment to help readers identify blue-ocean opportunities.
  • Chapter 6–10: Regional deep dives (North America, Europe, Asia Pacific, Latin America, Middle East & Africa) broken down by country. Each chapter quantifies market size and growth potential by region and key countries, and outlines market development, outlook, addressable space, and capacity.
  • Chapter 11: Profiles key players, presenting essential information on leading companies, including product/ service offerings, revenue, gross margin, product introductions/portfolios, recent developments, etc.
  • Chapter 12: Key findings and conclusions of the report.

FAQ for this report

How fast is Energy Transition in Manufacturing Market growing?

Ans: The Energy Transition in Manufacturing Market witnessing a CAGR of 6.2% during the forecast period 2026-2032.

What is the Energy Transition in Manufacturing Market size in 2032?

Ans: The Energy Transition in Manufacturing Market size in 2032 will be US$ 3245 million.

Who are the main players in the Energy Transition in Manufacturing Market report?

Ans: The main players in the Energy Transition in Manufacturing Market are Mitsubishi Heavy Industries, Toshiba, Hitachi Zosen, Fuji Electric, Panasonic, Siemens, ABB, Schneider Electric, Thyssenkrupp, Veolia, GE Vernova, Honeywell, Emerson, Cummins, POSCO, Ameresco, Veregy, Sulzer, Baker Hughes, Wärtsilä Energy, SolydEra, TECNALIA, Harbin Electric Corporation, LONGi Green Energy, CATL, Envision, Trinasolar

What are the Application segmentation covered in the Energy Transition in Manufacturing Market report?

Ans: The Applications covered in the Energy Transition in Manufacturing Market report are Steel, Chemicals, Cement, Non-ferrous Metals, General Manufacturing, Others

What are the Type segmentation covered in the Energy Transition in Manufacturing Market report?

Ans: The Types covered in the Energy Transition in Manufacturing Market report are Single-Point Energy Saving, System Optimization, Energy Substitution, Process Reconfiguration, Zero-Carbon Factory

1 Report Overview
1.1 Study Scope
1.2 Market Analysis by Type
1.2.1 Global Energy Transition in Manufacturing Market Size Growth Rate by Type: 2021 vs 2025 vs 2032
1.2.2 Single-Point Energy Saving
1.2.3 System Optimization
1.2.4 Energy Substitution
1.2.5 Process Reconfiguration
1.2.6 Zero-Carbon Factory
1.3 Market by Technology
1.3.1 Global Energy Transition in Manufacturing Market Size Growth Rate by Technology: 2021 vs 2025 vs 2032
1.3.2 Electrification of End-Use Energy
1.3.3 Low-Carbon Fuel Substitution
1.3.4 Green Electricity Direct Supply and Microgrids
1.3.5 Carbon Capture, Utilization and Storage
1.3.6 Waste Heat and Pressure Recovery
1.3.7 Others
1.4 Market by Power
1.4.1 Global Energy Transition in Manufacturing Market Size Growth Rate by Power: 2021 vs 2025 vs 2032
1.4.2 <10 kW
1.4.3 10 kW-100 kW
1.4.4 100 kW-1 MW
1.4.5 1MW-10 MW
1.4.6 10 MW -50 MW
1.4.7 >50 MW
1.5 Market by Application
1.5.1 Global Energy Transition in Manufacturing Market Growth by Application: 2021 vs 2025 vs 2032
1.5.2 Steel
1.5.3 Chemicals
1.5.4 Cement
1.5.5 Non-ferrous Metals
1.5.6 General Manufacturing
1.5.7 Others
1.6 Assumptions and Limitations
1.7 Study Objectives
1.8 Years Considered
2 Global Growth Trends
2.1 Global Energy Transition in Manufacturing Market Perspective (2021–2032)
2.2 Global Energy Transition in Manufacturing Growth Trends by Region
2.2.1 Global Energy Transition in Manufacturing Market Size by Region: 2021 vs 2025 vs 2032
2.2.2 Energy Transition in Manufacturing Historic Market Size by Region (2021–2026)
2.2.3 Energy Transition in Manufacturing Forecasted Market Size by Region (2027–2032)
2.3 Energy Transition in Manufacturing Market Dynamics
2.3.1 Energy Transition in Manufacturing Industry Trends
2.3.2 Energy Transition in Manufacturing Market Drivers
2.3.3 Energy Transition in Manufacturing Market Challenges
2.3.4 Energy Transition in Manufacturing Market Restraints
3 Competition Landscape by Key Players
3.1 Global Top Energy Transition in Manufacturing Players by Revenue
3.1.1 Global Top Energy Transition in Manufacturing Players by Revenue (2021–2026)
3.1.2 Global Energy Transition in Manufacturing Revenue Market Share by Players (2021–2026)
3.2 Global Top Energy Transition in Manufacturing Players Market Share by Company Tier (Tier 1, Tier 2, Tier 3)
3.3 Global Key Players Ranking by Energy Transition in Manufacturing Revenue
3.4 Global Energy Transition in Manufacturing Market Concentration Ratio
3.4.1 Global Energy Transition in Manufacturing Market Concentration Ratio (CR5 and HHI)
3.4.2 Global Top 10 and Top 5 Companies by Energy Transition in Manufacturing Revenue in 2025
3.5 Global Key Players of Energy Transition in Manufacturing Head Offices and Areas Served
3.6 Global Key Players of Energy Transition in Manufacturing, Products and Applications
3.7 Global Key Players of Energy Transition in Manufacturing, Date of General Availability (GA)
3.8 Mergers and Acquisitions, Expansion Plans
4 Energy Transition in Manufacturing Breakdown Data by Type
4.1 Global Energy Transition in Manufacturing Historic Market Size by Type (2021–2026)
4.2 Global Energy Transition in Manufacturing Forecasted Market Size by Type (2027–2032)
5 Energy Transition in Manufacturing Breakdown Data by Application
5.1 Global Energy Transition in Manufacturing Historic Market Size by Application (2021–2026)
5.2 Global Energy Transition in Manufacturing Forecasted Market Size by Application (2027–2032)
6 North America
6.1 North America Energy Transition in Manufacturing Market Size (2021–2032)
6.2 North America Energy Transition in Manufacturing Market Growth Rate by Country: 2021 vs 2025 vs 2032
6.3 North America Energy Transition in Manufacturing Market Size by Country (2021–2026)
6.4 North America Energy Transition in Manufacturing Market Size by Country (2027–2032)
6.5 United States
6.6 Canada
7 Europe
7.1 Europe Energy Transition in Manufacturing Market Size (2021–2032)
7.2 Europe Energy Transition in Manufacturing Market Growth Rate by Country: 2021 vs 2025 vs 2032
7.3 Europe Energy Transition in Manufacturing Market Size by Country (2021–2026)
7.4 Europe Energy Transition in Manufacturing Market Size by Country (2027–2032)
7.5 Germany
7.6 France
7.7 U.K.
7.8 Italy
7.9 Russia
7.10 Ireland
8 Asia-Pacific
8.1 Asia-Pacific Energy Transition in Manufacturing Market Size (2021–2032)
8.2 Asia-Pacific Energy Transition in Manufacturing Market Growth Rate by Region: 2021 vs 2025 vs 2032
8.3 Asia-Pacific Energy Transition in Manufacturing Market Size by Region (2021–2026)
8.4 Asia-Pacific Energy Transition in Manufacturing Market Size by Region (2027–2032)
8.5 China
8.6 Japan
8.7 South Korea
8.8 Southeast Asia
8.9 India
8.10 Australia & New Zealand
9 Latin America
9.1 Latin America Energy Transition in Manufacturing Market Size (2021–2032)
9.2 Latin America Energy Transition in Manufacturing Market Growth Rate by Country: 2021 vs 2025 vs 2032
9.3 Latin America Energy Transition in Manufacturing Market Size by Country (2021–2026)
9.4 Latin America Energy Transition in Manufacturing Market Size by Country (2027–2032)
9.5 Mexico
9.6 Brazil
10 Middle East & Africa
10.1 Middle East & Africa Energy Transition in Manufacturing Market Size (2021–2032)
10.2 Middle East & Africa Energy Transition in Manufacturing Market Growth Rate by Country: 2021 vs 2025 vs 2032
10.3 Middle East & Africa Energy Transition in Manufacturing Market Size by Country (2021–2026)
10.4 Middle East & Africa Energy Transition in Manufacturing Market Size by Country (2027–2032)
10.5 Israel
10.6 Saudi Arabia
10.7 UAE
11 Key Players Profiles
11.1 Mitsubishi Heavy Industries
11.1.1 Mitsubishi Heavy Industries Company Details
11.1.2 Mitsubishi Heavy Industries Business Overview
11.1.3 Mitsubishi Heavy Industries Energy Transition in Manufacturing Introduction
11.1.4 Mitsubishi Heavy Industries Revenue in Energy Transition in Manufacturing Business (2021–2026)
11.1.5 Mitsubishi Heavy Industries Recent Development
11.2 Toshiba
11.2.1 Toshiba Company Details
11.2.2 Toshiba Business Overview
11.2.3 Toshiba Energy Transition in Manufacturing Introduction
11.2.4 Toshiba Revenue in Energy Transition in Manufacturing Business (2021–2026)
11.2.5 Toshiba Recent Development
11.3 Hitachi Zosen
11.3.1 Hitachi Zosen Company Details
11.3.2 Hitachi Zosen Business Overview
11.3.3 Hitachi Zosen Energy Transition in Manufacturing Introduction
11.3.4 Hitachi Zosen Revenue in Energy Transition in Manufacturing Business (2021–2026)
11.3.5 Hitachi Zosen Recent Development
11.4 Fuji Electric
11.4.1 Fuji Electric Company Details
11.4.2 Fuji Electric Business Overview
11.4.3 Fuji Electric Energy Transition in Manufacturing Introduction
11.4.4 Fuji Electric Revenue in Energy Transition in Manufacturing Business (2021–2026)
11.4.5 Fuji Electric Recent Development
11.5 Panasonic
11.5.1 Panasonic Company Details
11.5.2 Panasonic Business Overview
11.5.3 Panasonic Energy Transition in Manufacturing Introduction
11.5.4 Panasonic Revenue in Energy Transition in Manufacturing Business (2021–2026)
11.5.5 Panasonic Recent Development
11.6 Siemens
11.6.1 Siemens Company Details
11.6.2 Siemens Business Overview
11.6.3 Siemens Energy Transition in Manufacturing Introduction
11.6.4 Siemens Revenue in Energy Transition in Manufacturing Business (2021–2026)
11.6.5 Siemens Recent Development
11.7 ABB
11.7.1 ABB Company Details
11.7.2 ABB Business Overview
11.7.3 ABB Energy Transition in Manufacturing Introduction
11.7.4 ABB Revenue in Energy Transition in Manufacturing Business (2021–2026)
11.7.5 ABB Recent Development
11.8 Schneider Electric
11.8.1 Schneider Electric Company Details
11.8.2 Schneider Electric Business Overview
11.8.3 Schneider Electric Energy Transition in Manufacturing Introduction
11.8.4 Schneider Electric Revenue in Energy Transition in Manufacturing Business (2021–2026)
11.8.5 Schneider Electric Recent Development
11.9 Thyssenkrupp
11.9.1 Thyssenkrupp Company Details
11.9.2 Thyssenkrupp Business Overview
11.9.3 Thyssenkrupp Energy Transition in Manufacturing Introduction
11.9.4 Thyssenkrupp Revenue in Energy Transition in Manufacturing Business (2021–2026)
11.9.5 Thyssenkrupp Recent Development
11.10 Veolia
11.10.1 Veolia Company Details
11.10.2 Veolia Business Overview
11.10.3 Veolia Energy Transition in Manufacturing Introduction
11.10.4 Veolia Revenue in Energy Transition in Manufacturing Business (2021–2026)
11.10.5 Veolia Recent Development
11.11 GE Vernova
11.11.1 GE Vernova Company Details
11.11.2 GE Vernova Business Overview
11.11.3 GE Vernova Energy Transition in Manufacturing Introduction
11.11.4 GE Vernova Revenue in Energy Transition in Manufacturing Business (2021–2026)
11.11.5 GE Vernova Recent Development
11.12 Honeywell
11.12.1 Honeywell Company Details
11.12.2 Honeywell Business Overview
11.12.3 Honeywell Energy Transition in Manufacturing Introduction
11.12.4 Honeywell Revenue in Energy Transition in Manufacturing Business (2021–2026)
11.12.5 Honeywell Recent Development
11.13 Emerson
11.13.1 Emerson Company Details
11.13.2 Emerson Business Overview
11.13.3 Emerson Energy Transition in Manufacturing Introduction
11.13.4 Emerson Revenue in Energy Transition in Manufacturing Business (2021–2026)
11.13.5 Emerson Recent Development
11.14 Cummins
11.14.1 Cummins Company Details
11.14.2 Cummins Business Overview
11.14.3 Cummins Energy Transition in Manufacturing Introduction
11.14.4 Cummins Revenue in Energy Transition in Manufacturing Business (2021–2026)
11.14.5 Cummins Recent Development
11.15 POSCO
11.15.1 POSCO Company Details
11.15.2 POSCO Business Overview
11.15.3 POSCO Energy Transition in Manufacturing Introduction
11.15.4 POSCO Revenue in Energy Transition in Manufacturing Business (2021–2026)
11.15.5 POSCO Recent Development
11.16 Ameresco
11.16.1 Ameresco Company Details
11.16.2 Ameresco Business Overview
11.16.3 Ameresco Energy Transition in Manufacturing Introduction
11.16.4 Ameresco Revenue in Energy Transition in Manufacturing Business (2021–2026)
11.16.5 Ameresco Recent Development
11.17 Veregy
11.17.1 Veregy Company Details
11.17.2 Veregy Business Overview
11.17.3 Veregy Energy Transition in Manufacturing Introduction
11.17.4 Veregy Revenue in Energy Transition in Manufacturing Business (2021–2026)
11.17.5 Veregy Recent Development
11.18 Sulzer
11.18.1 Sulzer Company Details
11.18.2 Sulzer Business Overview
11.18.3 Sulzer Energy Transition in Manufacturing Introduction
11.18.4 Sulzer Revenue in Energy Transition in Manufacturing Business (2021–2026)
11.18.5 Sulzer Recent Development
11.19 Baker Hughes
11.19.1 Baker Hughes Company Details
11.19.2 Baker Hughes Business Overview
11.19.3 Baker Hughes Energy Transition in Manufacturing Introduction
11.19.4 Baker Hughes Revenue in Energy Transition in Manufacturing Business (2021–2026)
11.19.5 Baker Hughes Recent Development
11.20 Wärtsilä Energy
11.20.1 Wärtsilä Energy Company Details
11.20.2 Wärtsilä Energy Business Overview
11.20.3 Wärtsilä Energy Energy Transition in Manufacturing Introduction
11.20.4 Wärtsilä Energy Revenue in Energy Transition in Manufacturing Business (2021–2026)
11.20.5 Wärtsilä Energy Recent Development
11.21 SolydEra
11.21.1 SolydEra Company Details
11.21.2 SolydEra Business Overview
11.21.3 SolydEra Energy Transition in Manufacturing Introduction
11.21.4 SolydEra Revenue in Energy Transition in Manufacturing Business (2021–2026)
11.21.5 SolydEra Recent Development
11.22 TECNALIA
11.22.1 TECNALIA Company Details
11.22.2 TECNALIA Business Overview
11.22.3 TECNALIA Energy Transition in Manufacturing Introduction
11.22.4 TECNALIA Revenue in Energy Transition in Manufacturing Business (2021–2026)
11.22.5 TECNALIA Recent Development
11.23 Harbin Electric Corporation
11.23.1 Harbin Electric Corporation Company Details
11.23.2 Harbin Electric Corporation Business Overview
11.23.3 Harbin Electric Corporation Energy Transition in Manufacturing Introduction
11.23.4 Harbin Electric Corporation Revenue in Energy Transition in Manufacturing Business (2021–2026)
11.23.5 Harbin Electric Corporation Recent Development
11.24 LONGi Green Energy
11.24.1 LONGi Green Energy Company Details
11.24.2 LONGi Green Energy Business Overview
11.24.3 LONGi Green Energy Energy Transition in Manufacturing Introduction
11.24.4 LONGi Green Energy Revenue in Energy Transition in Manufacturing Business (2021–2026)
11.24.5 LONGi Green Energy Recent Development
11.25 CATL
11.25.1 CATL Company Details
11.25.2 CATL Business Overview
11.25.3 CATL Energy Transition in Manufacturing Introduction
11.25.4 CATL Revenue in Energy Transition in Manufacturing Business (2021–2026)
11.25.5 CATL Recent Development
11.26 Envision
11.26.1 Envision Company Details
11.26.2 Envision Business Overview
11.26.3 Envision Energy Transition in Manufacturing Introduction
11.26.4 Envision Revenue in Energy Transition in Manufacturing Business (2021–2026)
11.26.5 Envision Recent Development
11.27 Trinasolar
11.27.1 Trinasolar Company Details
11.27.2 Trinasolar Business Overview
11.27.3 Trinasolar Energy Transition in Manufacturing Introduction
11.27.4 Trinasolar Revenue in Energy Transition in Manufacturing Business (2021–2026)
11.27.5 Trinasolar Recent Development
12 Analyst's Viewpoints/Conclusions
13 Appendix
13.1 Research Methodology
13.1.1 Methodology/Research Approach
13.1.1.1 Research Programs/Design
13.1.1.2 Market Size Estimation
13.1.1.3 Market Breakdown and Data Triangulation
13.1.2 Data Source
13.1.2.1 Secondary Sources
13.1.2.2 Primary Sources
13.2 Author Details
13.3 Disclaimer
List of Tables
 Table 1. Global Energy Transition in Manufacturing Market Size Growth Rate by Type (US$ Million): 2021 vs 2025 vs 2032
 Table 2. Key Players of Single-Point Energy Saving
 Table 3. Key Players of System Optimization
 Table 4. Key Players of Energy Substitution
 Table 5. Key Players of Process Reconfiguration
 Table 6. Key Players of Zero-Carbon Factory
 Table 7. Global Energy Transition in Manufacturing Market Size Growth Rate by Technology (US$ Million): 2021 vs 2025 vs 2032
 Table 8. Key Players of Electrification of End-Use Energy
 Table 9. Key Players of Low-Carbon Fuel Substitution
 Table 10. Key Players of Green Electricity Direct Supply and Microgrids
 Table 11. Key Players of Carbon Capture, Utilization and Storage
 Table 12. Key Players of Waste Heat and Pressure Recovery
 Table 13. Key Players of Others
 Table 14. Global Energy Transition in Manufacturing Market Size Growth Rate by Power (US$ Million): 2021 vs 2025 vs 2032
 Table 15. Key Players of <10 kW
 Table 16. Key Players of 10 kW-100 kW
 Table 17. Key Players of 100 kW-1 MW
 Table 18. Key Players of 1MW-10 MW
 Table 19. Key Players of 10 MW -50 MW
 Table 20. Key Players of >50 MW
 Table 21. Global Energy Transition in Manufacturing Market Size Growth by Application (US$ Million): 2021 vs 2025 vs 2032
 Table 22. Global Energy Transition in Manufacturing Market Size by Region (US$ Million): 2021 vs 2025 vs 2032
 Table 23. Global Energy Transition in Manufacturing Market Size by Region (US$ Million), 2021–2026
 Table 24. Global Energy Transition in Manufacturing Market Share by Region (2021–2026)
 Table 25. Global Energy Transition in Manufacturing Forecasted Market Size by Region (US$ Million), 2027–2032
 Table 26. Global Energy Transition in Manufacturing Market Share by Region (2027–2032)
 Table 27. Energy Transition in Manufacturing Market Trends
 Table 28. Energy Transition in Manufacturing Market Drivers
 Table 29. Energy Transition in Manufacturing Market Challenges
 Table 30. Energy Transition in Manufacturing Market Restraints
 Table 31. Global Energy Transition in Manufacturing Revenue by Players (US$ Million), 2021–2026
 Table 32. Global Energy Transition in Manufacturing Market Share by Players (2021–2026)
 Table 33. Global Top Energy Transition in Manufacturing Players by Tier (Tier 1, Tier 2, and Tier 3), based on Energy Transition in Manufacturing Revenue, 2025
 Table 34. Ranking of Global Top Energy Transition in Manufacturing Companies by Revenue (US$ Million) in 2025
 Table 35. Global 5 Largest Players Market Share by Energy Transition in Manufacturing Revenue (CR5 and HHI), 2021–2026
 Table 36. Global Key Players of Energy Transition in Manufacturing, Headquarters and Area Served
 Table 37. Global Key Players of Energy Transition in Manufacturing, Products and Applications
 Table 38. Global Key Players of Energy Transition in Manufacturing, Date of General Availability (GA)
 Table 39. Mergers and Acquisitions, Expansion Plans
 Table 40. Global Energy Transition in Manufacturing Market Size by Type (US$ Million), 2021–2026
 Table 41. Global Energy Transition in Manufacturing Revenue Market Share by Type (2021–2026)
 Table 42. Global Energy Transition in Manufacturing Forecasted Market Size by Type (US$ Million), 2027–2032
 Table 43. Global Energy Transition in Manufacturing Revenue Market Share by Type (2027–2032)
 Table 44. Global Energy Transition in Manufacturing Market Size by Application (US$ Million), 2021–2026
 Table 45. Global Energy Transition in Manufacturing Revenue Market Share by Application (2021–2026)
 Table 46. Global Energy Transition in Manufacturing Forecasted Market Size by Application (US$ Million), 2027–2032
 Table 47. Global Energy Transition in Manufacturing Revenue Market Share by Application (2027–2032)
 Table 48. North America Energy Transition in Manufacturing Market Size Growth Rate by Country (US$ Million): 2021 vs 2025 vs 2032
 Table 49. North America Energy Transition in Manufacturing Market Size by Country (US$ Million), 2021–2026
 Table 50. North America Energy Transition in Manufacturing Market Size by Country (US$ Million), 2027–2032
 Table 51. Europe Energy Transition in Manufacturing Market Size Growth Rate by Country (US$ Million): 2021 vs 2025 vs 2032
 Table 52. Europe Energy Transition in Manufacturing Market Size by Country (US$ Million), 2021–2026
 Table 53. Europe Energy Transition in Manufacturing Market Size by Country (US$ Million), 2027–2032
 Table 54. Asia-Pacific Energy Transition in Manufacturing Market Size Growth Rate by Region (US$ Million): 2021 vs 2025 vs 2032
 Table 55. Asia-Pacific Energy Transition in Manufacturing Market Size by Region (US$ Million), 2021–2026
 Table 56. Asia-Pacific Energy Transition in Manufacturing Market Size by Region (US$ Million), 2027–2032
 Table 57. Latin America Energy Transition in Manufacturing Market Size Growth Rate by Country (US$ Million): 2021 vs 2025 vs 2032
 Table 58. Latin America Energy Transition in Manufacturing Market Size by Country (US$ Million), 2021–2026
 Table 59. Latin America Energy Transition in Manufacturing Market Size by Country (US$ Million), 2027–2032
 Table 60. Middle East & Africa Energy Transition in Manufacturing Market Size Growth Rate by Country (US$ Million): 2021 vs 2025 vs 2032
 Table 61. Middle East & Africa Energy Transition in Manufacturing Market Size by Country (US$ Million), 2021–2026
 Table 62. Middle East & Africa Energy Transition in Manufacturing Market Size by Country (US$ Million), 2027–2032
 Table 63. Mitsubishi Heavy Industries Company Details
 Table 64. Mitsubishi Heavy Industries Business Overview
 Table 65. Mitsubishi Heavy Industries Energy Transition in Manufacturing Product
 Table 66. Mitsubishi Heavy Industries Revenue in Energy Transition in Manufacturing Business (US$ Million), 2021–2026
 Table 67. Mitsubishi Heavy Industries Recent Development
 Table 68. Toshiba Company Details
 Table 69. Toshiba Business Overview
 Table 70. Toshiba Energy Transition in Manufacturing Product
 Table 71. Toshiba Revenue in Energy Transition in Manufacturing Business (US$ Million), 2021–2026
 Table 72. Toshiba Recent Development
 Table 73. Hitachi Zosen Company Details
 Table 74. Hitachi Zosen Business Overview
 Table 75. Hitachi Zosen Energy Transition in Manufacturing Product
 Table 76. Hitachi Zosen Revenue in Energy Transition in Manufacturing Business (US$ Million), 2021–2026
 Table 77. Hitachi Zosen Recent Development
 Table 78. Fuji Electric Company Details
 Table 79. Fuji Electric Business Overview
 Table 80. Fuji Electric Energy Transition in Manufacturing Product
 Table 81. Fuji Electric Revenue in Energy Transition in Manufacturing Business (US$ Million), 2021–2026
 Table 82. Fuji Electric Recent Development
 Table 83. Panasonic Company Details
 Table 84. Panasonic Business Overview
 Table 85. Panasonic Energy Transition in Manufacturing Product
 Table 86. Panasonic Revenue in Energy Transition in Manufacturing Business (US$ Million), 2021–2026
 Table 87. Panasonic Recent Development
 Table 88. Siemens Company Details
 Table 89. Siemens Business Overview
 Table 90. Siemens Energy Transition in Manufacturing Product
 Table 91. Siemens Revenue in Energy Transition in Manufacturing Business (US$ Million), 2021–2026
 Table 92. Siemens Recent Development
 Table 93. ABB Company Details
 Table 94. ABB Business Overview
 Table 95. ABB Energy Transition in Manufacturing Product
 Table 96. ABB Revenue in Energy Transition in Manufacturing Business (US$ Million), 2021–2026
 Table 97. ABB Recent Development
 Table 98. Schneider Electric Company Details
 Table 99. Schneider Electric Business Overview
 Table 100. Schneider Electric Energy Transition in Manufacturing Product
 Table 101. Schneider Electric Revenue in Energy Transition in Manufacturing Business (US$ Million), 2021–2026
 Table 102. Schneider Electric Recent Development
 Table 103. Thyssenkrupp Company Details
 Table 104. Thyssenkrupp Business Overview
 Table 105. Thyssenkrupp Energy Transition in Manufacturing Product
 Table 106. Thyssenkrupp Revenue in Energy Transition in Manufacturing Business (US$ Million), 2021–2026
 Table 107. Thyssenkrupp Recent Development
 Table 108. Veolia Company Details
 Table 109. Veolia Business Overview
 Table 110. Veolia Energy Transition in Manufacturing Product
 Table 111. Veolia Revenue in Energy Transition in Manufacturing Business (US$ Million), 2021–2026
 Table 112. Veolia Recent Development
 Table 113. GE Vernova Company Details
 Table 114. GE Vernova Business Overview
 Table 115. GE Vernova Energy Transition in Manufacturing Product
 Table 116. GE Vernova Revenue in Energy Transition in Manufacturing Business (US$ Million), 2021–2026
 Table 117. GE Vernova Recent Development
 Table 118. Honeywell Company Details
 Table 119. Honeywell Business Overview
 Table 120. Honeywell Energy Transition in Manufacturing Product
 Table 121. Honeywell Revenue in Energy Transition in Manufacturing Business (US$ Million), 2021–2026
 Table 122. Honeywell Recent Development
 Table 123. Emerson Company Details
 Table 124. Emerson Business Overview
 Table 125. Emerson Energy Transition in Manufacturing Product
 Table 126. Emerson Revenue in Energy Transition in Manufacturing Business (US$ Million), 2021–2026
 Table 127. Emerson Recent Development
 Table 128. Cummins Company Details
 Table 129. Cummins Business Overview
 Table 130. Cummins Energy Transition in Manufacturing Product
 Table 131. Cummins Revenue in Energy Transition in Manufacturing Business (US$ Million), 2021–2026
 Table 132. Cummins Recent Development
 Table 133. POSCO Company Details
 Table 134. POSCO Business Overview
 Table 135. POSCO Energy Transition in Manufacturing Product
 Table 136. POSCO Revenue in Energy Transition in Manufacturing Business (US$ Million), 2021–2026
 Table 137. POSCO Recent Development
 Table 138. Ameresco Company Details
 Table 139. Ameresco Business Overview
 Table 140. Ameresco Energy Transition in Manufacturing Product
 Table 141. Ameresco Revenue in Energy Transition in Manufacturing Business (US$ Million), 2021–2026
 Table 142. Ameresco Recent Development
 Table 143. Veregy Company Details
 Table 144. Veregy Business Overview
 Table 145. Veregy Energy Transition in Manufacturing Product
 Table 146. Veregy Revenue in Energy Transition in Manufacturing Business (US$ Million), 2021–2026
 Table 147. Veregy Recent Development
 Table 148. Sulzer Company Details
 Table 149. Sulzer Business Overview
 Table 150. Sulzer Energy Transition in Manufacturing Product
 Table 151. Sulzer Revenue in Energy Transition in Manufacturing Business (US$ Million), 2021–2026
 Table 152. Sulzer Recent Development
 Table 153. Baker Hughes Company Details
 Table 154. Baker Hughes Business Overview
 Table 155. Baker Hughes Energy Transition in Manufacturing Product
 Table 156. Baker Hughes Revenue in Energy Transition in Manufacturing Business (US$ Million), 2021–2026
 Table 157. Baker Hughes Recent Development
 Table 158. Wärtsilä Energy Company Details
 Table 159. Wärtsilä Energy Business Overview
 Table 160. Wärtsilä Energy Energy Transition in Manufacturing Product
 Table 161. Wärtsilä Energy Revenue in Energy Transition in Manufacturing Business (US$ Million), 2021–2026
 Table 162. Wärtsilä Energy Recent Development
 Table 163. SolydEra Company Details
 Table 164. SolydEra Business Overview
 Table 165. SolydEra Energy Transition in Manufacturing Product
 Table 166. SolydEra Revenue in Energy Transition in Manufacturing Business (US$ Million), 2021–2026
 Table 167. SolydEra Recent Development
 Table 168. TECNALIA Company Details
 Table 169. TECNALIA Business Overview
 Table 170. TECNALIA Energy Transition in Manufacturing Product
 Table 171. TECNALIA Revenue in Energy Transition in Manufacturing Business (US$ Million), 2021–2026
 Table 172. TECNALIA Recent Development
 Table 173. Harbin Electric Corporation Company Details
 Table 174. Harbin Electric Corporation Business Overview
 Table 175. Harbin Electric Corporation Energy Transition in Manufacturing Product
 Table 176. Harbin Electric Corporation Revenue in Energy Transition in Manufacturing Business (US$ Million), 2021–2026
 Table 177. Harbin Electric Corporation Recent Development
 Table 178. LONGi Green Energy Company Details
 Table 179. LONGi Green Energy Business Overview
 Table 180. LONGi Green Energy Energy Transition in Manufacturing Product
 Table 181. LONGi Green Energy Revenue in Energy Transition in Manufacturing Business (US$ Million), 2021–2026
 Table 182. LONGi Green Energy Recent Development
 Table 183. CATL Company Details
 Table 184. CATL Business Overview
 Table 185. CATL Energy Transition in Manufacturing Product
 Table 186. CATL Revenue in Energy Transition in Manufacturing Business (US$ Million), 2021–2026
 Table 187. CATL Recent Development
 Table 188. Envision Company Details
 Table 189. Envision Business Overview
 Table 190. Envision Energy Transition in Manufacturing Product
 Table 191. Envision Revenue in Energy Transition in Manufacturing Business (US$ Million), 2021–2026
 Table 192. Envision Recent Development
 Table 193. Trinasolar Company Details
 Table 194. Trinasolar Business Overview
 Table 195. Trinasolar Energy Transition in Manufacturing Product
 Table 196. Trinasolar Revenue in Energy Transition in Manufacturing Business (US$ Million), 2021–2026
 Table 197. Trinasolar Recent Development
 Table 198. Research Programs/Design for This Report
 Table 199. Key Data Information from Secondary Sources
 Table 200. Key Data Information from Primary Sources
 Table 201. Authors List of This Report


List of Figures
 Figure 1. Energy Transition in Manufacturing Picture
 Figure 2. Global Energy Transition in Manufacturing Market Size Comparison by Type (US$ Million), 2021–2032
 Figure 3. Global Energy Transition in Manufacturing Market Share by Type: 2025 vs 2032
 Figure 4. Single-Point Energy Saving Features
 Figure 5. System Optimization Features
 Figure 6. Energy Substitution Features
 Figure 7. Process Reconfiguration Features
 Figure 8. Zero-Carbon Factory Features
 Figure 9. Global Energy Transition in Manufacturing Market Size Comparison by Technology (US$ Million), 2021–2032
 Figure 10. Electrification of End-Use Energy Features
 Figure 11. Low-Carbon Fuel Substitution Features
 Figure 12. Green Electricity Direct Supply and Microgrids Features
 Figure 13. Carbon Capture, Utilization and Storage Features
 Figure 14. Waste Heat and Pressure Recovery Features
 Figure 15. Others Features
 Figure 16. Global Energy Transition in Manufacturing Market Size Comparison by Power (US$ Million), 2021–2032
 Figure 17. <10 kW Features
 Figure 18. 10 kW-100 kW Features
 Figure 19. 100 kW-1 MW Features
 Figure 20. 1MW-10 MW Features
 Figure 21. 10 MW -50 MW Features
 Figure 22. >50 MW Features
 Figure 23. Global Energy Transition in Manufacturing Market Size by Application (US$ Million), 2021–2032
 Figure 24. Global Energy Transition in Manufacturing Market Share by Application: 2025 vs 2032
 Figure 25. Steel Case Studies
 Figure 26. Chemicals Case Studies
 Figure 27. Cement Case Studies
 Figure 28. Non-ferrous Metals Case Studies
 Figure 29. General Manufacturing Case Studies
 Figure 30. Others Case Studies
 Figure 31. Energy Transition in Manufacturing Report Years Considered
 Figure 32. Global Energy Transition in Manufacturing Market Size (US$ Million), Year-over-Year: 2021–2032
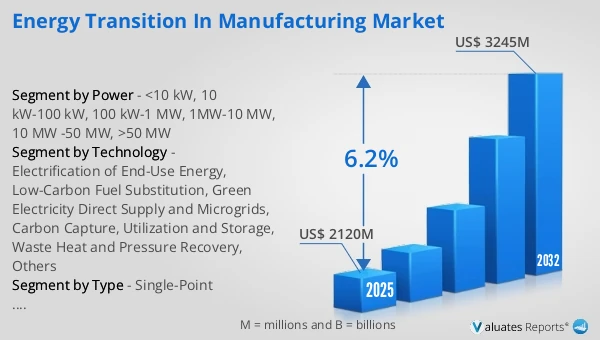
 Figure 33. Global Energy Transition in Manufacturing Market Size, (US$ Million), 2021 vs 2025 vs 2032
 Figure 34. Global Energy Transition in Manufacturing Market Share by Region: 2025 vs 2032
 Figure 35. Global Energy Transition in Manufacturing Market Share by Players in 2025
 Figure 36. Global Energy Transition in Manufacturing Market Share by Company Type (Tier 1, Tier 2, and Tier 3)
 Figure 37. The Top 10 and 5 Players Market Share by Energy Transition in Manufacturing Revenue in 2025
 Figure 38. North America Energy Transition in Manufacturing Market Size YoY Growth (US$ Million), 2021–2032
 Figure 39. North America Energy Transition in Manufacturing Market Share by Country (2021–2032)
 Figure 40. United States Energy Transition in Manufacturing Market Size YoY Growth (US$ Million), 2021–2032
 Figure 41. Canada Energy Transition in Manufacturing Market Size YoY Growth (US$ Million), 2021–2032
 Figure 42. Europe Energy Transition in Manufacturing Market Size YoY Growth (US$ Million), 2021–2032
 Figure 43. Europe Energy Transition in Manufacturing Market Share by Country (2021–2032)
 Figure 44. Germany Energy Transition in Manufacturing Market Size YoY Growth (US$ Million), 2021–2032
 Figure 45. France Energy Transition in Manufacturing Market Size YoY Growth (US$ Million), 2021–2032
 Figure 46. U.K. Energy Transition in Manufacturing Market Size YoY Growth (US$ Million), 2021–2032
 Figure 47. Italy Energy Transition in Manufacturing Market Size YoY Growth (US$ Million), 2021–2032
 Figure 48. Russia Energy Transition in Manufacturing Market Size YoY Growth (US$ Million), 2021–2032
 Figure 49. Ireland Energy Transition in Manufacturing Market Size YoY Growth (US$ Million), 2021–2032
 Figure 50. Asia-Pacific Energy Transition in Manufacturing Market Size YoY Growth (US$ Million), 2021–2032
 Figure 51. Asia-Pacific Energy Transition in Manufacturing Market Share by Region (2021–2032)
 Figure 52. China Energy Transition in Manufacturing Market Size YoY Growth (US$ Million), 2021–2032
 Figure 53. Japan Energy Transition in Manufacturing Market Size YoY Growth (US$ Million), 2021–2032
 Figure 54. South Korea Energy Transition in Manufacturing Market Size YoY Growth (US$ Million), 2021–2032
 Figure 55. Southeast Asia Energy Transition in Manufacturing Market Size YoY Growth (US$ Million), 2021–2032
 Figure 56. India Energy Transition in Manufacturing Market Size YoY Growth (US$ Million), 2021–2032
 Figure 57. Australia & New Zealand Energy Transition in Manufacturing Market Size YoY Growth (US$ Million), 2021–2032
 Figure 58. Latin America Energy Transition in Manufacturing Market Size YoY Growth (US$ Million), 2021–2032
 Figure 59. Latin America Energy Transition in Manufacturing Market Share by Country (2021–2032)
 Figure 60. Mexico Energy Transition in Manufacturing Market Size YoY Growth (US$ Million), 2021–2032
 Figure 61. Brazil Energy Transition in Manufacturing Market Size YoY Growth (US$ Million), 2021–2032
 Figure 62. Middle East & Africa Energy Transition in Manufacturing Market Size YoY Growth (US$ Million), 2021–2032
 Figure 63. Middle East & Africa Energy Transition in Manufacturing Market Share by Country (2021–2032)
 Figure 64. Israel Energy Transition in Manufacturing Market Size YoY Growth (US$ Million), 2021–2032
 Figure 65. Saudi Arabia Energy Transition in Manufacturing Market Size YoY Growth (US$ Million), 2021–2032
 Figure 66. UAE Energy Transition in Manufacturing Market Size YoY Growth (US$ Million), 2021–2032
 Figure 67. Mitsubishi Heavy Industries Revenue Growth Rate in Energy Transition in Manufacturing Business (2021–2026)
 Figure 68. Toshiba Revenue Growth Rate in Energy Transition in Manufacturing Business (2021–2026)
 Figure 69. Hitachi Zosen Revenue Growth Rate in Energy Transition in Manufacturing Business (2021–2026)
 Figure 70. Fuji Electric Revenue Growth Rate in Energy Transition in Manufacturing Business (2021–2026)
 Figure 71. Panasonic Revenue Growth Rate in Energy Transition in Manufacturing Business (2021–2026)
 Figure 72. Siemens Revenue Growth Rate in Energy Transition in Manufacturing Business (2021–2026)
 Figure 73. ABB Revenue Growth Rate in Energy Transition in Manufacturing Business (2021–2026)
 Figure 74. Schneider Electric Revenue Growth Rate in Energy Transition in Manufacturing Business (2021–2026)
 Figure 75. Thyssenkrupp Revenue Growth Rate in Energy Transition in Manufacturing Business (2021–2026)
 Figure 76. Veolia Revenue Growth Rate in Energy Transition in Manufacturing Business (2021–2026)
 Figure 77. GE Vernova Revenue Growth Rate in Energy Transition in Manufacturing Business (2021–2026)
 Figure 78. Honeywell Revenue Growth Rate in Energy Transition in Manufacturing Business (2021–2026)
 Figure 79. Emerson Revenue Growth Rate in Energy Transition in Manufacturing Business (2021–2026)
 Figure 80. Cummins Revenue Growth Rate in Energy Transition in Manufacturing Business (2021–2026)
 Figure 81. POSCO Revenue Growth Rate in Energy Transition in Manufacturing Business (2021–2026)
 Figure 82. Ameresco Revenue Growth Rate in Energy Transition in Manufacturing Business (2021–2026)
 Figure 83. Veregy Revenue Growth Rate in Energy Transition in Manufacturing Business (2021–2026)
 Figure 84. Sulzer Revenue Growth Rate in Energy Transition in Manufacturing Business (2021–2026)
 Figure 85. Baker Hughes Revenue Growth Rate in Energy Transition in Manufacturing Business (2021–2026)
 Figure 86. Wärtsilä Energy Revenue Growth Rate in Energy Transition in Manufacturing Business (2021–2026)
 Figure 87. SolydEra Revenue Growth Rate in Energy Transition in Manufacturing Business (2021–2026)
 Figure 88. TECNALIA Revenue Growth Rate in Energy Transition in Manufacturing Business (2021–2026)
 Figure 89. Harbin Electric Corporation Revenue Growth Rate in Energy Transition in Manufacturing Business (2021–2026)
 Figure 90. LONGi Green Energy Revenue Growth Rate in Energy Transition in Manufacturing Business (2021–2026)
 Figure 91. CATL Revenue Growth Rate in Energy Transition in Manufacturing Business (2021–2026)
 Figure 92. Envision Revenue Growth Rate in Energy Transition in Manufacturing Business (2021–2026)
 Figure 93. Trinasolar Revenue Growth Rate in Energy Transition in Manufacturing Business (2021–2026)
 Figure 94. Bottom-up and Top-down Approaches for This Report
 Figure 95. Data Triangulation
 Figure 96. Key Executives Interviewed
SELECT A FORMAT
Added to Cart
Electronic

$2900

Single User License
Electronic

$4350

Multi User License
Electronic

$5800

Enterprise License
Add to Cart
Buy Now (15% Discount)

OUR CUSTOMER

Accenture

SIMILAR REPORTS