List of Tables
Table 1. High-performance Para-aramid Fiber and Its Composite Materials Market Trends
Table 2. High-performance Para-aramid Fiber and Its Composite Materials Market Drivers & Opportunities
Table 3. High-performance Para-aramid Fiber and Its Composite Materials Market Challenges
Table 4. High-performance Para-aramid Fiber and Its Composite Materials Market Restraints
Table 5. Global High-performance Para-aramid Fiber and Its Composite Materials Revenue by Company (US$ Million), 2021–2026
Table 6. Global High-performance Para-aramid Fiber and Its Composite Materials Revenue Market Share by Company (2021–2026)
Table 7. Key Companies’ R&D and Operations Footprint and Headquarters
Table 8. Key Companies High-performance Para-aramid Fiber and Its Composite Materials Product Type
Table 9. Key Companies General Availability (GA) Timeline for High-performance Para-aramid Fiber and Its Composite Materials
Table 10. Global High-performance Para-aramid Fiber and Its Composite Materials Companies Market Concentration Ratio (CR5 and HHI)
Table 11. Global Companies by Tier (Tier 1, Tier 2, Tier 3), based on High-performance Para-aramid Fiber and Its Composite Materials revenue, 2025
Table 12. Mergers & Acquisitions and Expansion Plans
Table 13. Global High-performance Para-aramid Fiber and Its Composite Materials Sales Value by Type: 2021 vs 2025 vs 2032 (US$ Million)
Table 14. Global High-performance Para-aramid Fiber and Its Composite Materials Sales Value by Type (US$ Million), 2021–2026
Table 15. Global High-performance Para-aramid Fiber and Its Composite Materials Sales Value by Type (US$ Million), 2027–2032
Table 16. Global High-performance Para-aramid Fiber and Its Composite Materials Sales Market Share in Value by Type (2021–2026)
Table 17. Global High-performance Para-aramid Fiber and Its Composite Materials Sales Market Share in Value by Type (2027–2032)
Table 18. Global High-performance Para-aramid Fiber and Its Composite Materials Sales Value by Composite Matrix Type: 2021 vs 2025 vs 2032 (US$ Million)
Table 19. Global High-performance Para-aramid Fiber and Its Composite Materials Sales Value by Composite Matrix Type (US$ Million), 2021–2026
Table 20. Global High-performance Para-aramid Fiber and Its Composite Materials Sales Value by Composite Matrix Type (US$ Million), 2027–2032
Table 21. Global High-performance Para-aramid Fiber and Its Composite Materials Sales Market Share in Value by Composite Matrix Type (2021–2026)
Table 22. Global High-performance Para-aramid Fiber and Its Composite Materials Sales Market Share in Value by Composite Matrix Type (2027–2032)
Table 23. Global High-performance Para-aramid Fiber and Its Composite Materials Sales Value by Processing Technology: 2021 vs 2025 vs 2032 (US$ Million)
Table 24. Global High-performance Para-aramid Fiber and Its Composite Materials Sales Value by Processing Technology (US$ Million), 2021–2026
Table 25. Global High-performance Para-aramid Fiber and Its Composite Materials Sales Value by Processing Technology (US$ Million), 2027–2032
Table 26. Global High-performance Para-aramid Fiber and Its Composite Materials Sales Market Share in Value by Processing Technology (2021–2026)
Table 27. Global High-performance Para-aramid Fiber and Its Composite Materials Sales Market Share in Value by Processing Technology (2027–2032)
Table 28. Global High-performance Para-aramid Fiber and Its Composite Materials Sales Value by Application: 2021 vs 2025 vs 2032 (US$ Million)
Table 29. Global High-performance Para-aramid Fiber and Its Composite Materials Sales Value by Application (US$ Million), 2021–2026
Table 30. Global High-performance Para-aramid Fiber and Its Composite Materials Sales Value by Application (US$ Million), 2027–2032
Table 31. Global High-performance Para-aramid Fiber and Its Composite Materials Sales Market Share in Value by Application (2021–2026)
Table 32. Global High-performance Para-aramid Fiber and Its Composite Materials Sales Market Share in Value by Application (2027–2032)
Table 33. Global High-performance Para-aramid Fiber and Its Composite Materials Sales Value by Region, (US$ Million), 2021 vs 2025 vs 2032
Table 34. Global High-performance Para-aramid Fiber and Its Composite Materials Sales Value by Region (US$ Million), 2021–2026
Table 35. Global High-performance Para-aramid Fiber and Its Composite Materials Sales Value by Region (US$ Million), 2027–2032
Table 36. Global High-performance Para-aramid Fiber and Its Composite Materials Sales Value by Region (%), 2021–2026
Table 37. Global High-performance Para-aramid Fiber and Its Composite Materials Sales Value by Region (%), 2027–2032
Table 38. Key Countries/Regions High-performance Para-aramid Fiber and Its Composite Materials Sales Value Growth Trends, (US$ Million): 2021 vs 2025 vs 2032
Table 39. Key Countries/Regions High-performance Para-aramid Fiber and Its Composite Materials Sales Value, (US$ Million), 2021–2026
Table 40. Key Countries/Regions High-performance Para-aramid Fiber and Its Composite Materials Sales Value, (US$ Million), 2027–2032
Table 41. DuPont Basic Information List
Table 42. DuPont Description and Business Overview
Table 43. DuPont High-performance Para-aramid Fiber and Its Composite Materials Products, Services, and Solutions
Table 44. Revenue (US$ Million) in High-performance Para-aramid Fiber and Its Composite Materials Business of DuPont (2021–2026)
Table 45. DuPont Recent Developments
Table 46. Teijin Basic Information List
Table 47. Teijin Description and Business Overview
Table 48. Teijin High-performance Para-aramid Fiber and Its Composite Materials Products, Services, and Solutions
Table 49. Revenue (US$ Million) in High-performance Para-aramid Fiber and Its Composite Materials Business of Teijin (2021–2026)
Table 50. Teijin Recent Developments
Table 51. Kolon Industries Basic Information List
Table 52. Kolon Industries Description and Business Overview
Table 53. Kolon Industries High-performance Para-aramid Fiber and Its Composite Materials Products, Services, and Solutions
Table 54. Revenue (US$ Million) in High-performance Para-aramid Fiber and Its Composite Materials Business of Kolon Industries (2021–2026)
Table 55. Kolon Industries Recent Developments
Table 56. Hyosung Basic Information List
Table 57. Hyosung Description and Business Overview
Table 58. Hyosung High-performance Para-aramid Fiber and Its Composite Materials Products, Services, and Solutions
Table 59. Revenue (US$ Million) in High-performance Para-aramid Fiber and Its Composite Materials Business of Hyosung (2021–2026)
Table 60. Hyosung Recent Developments
Table 61. Tayho Basic Information List
Table 62. Tayho Description and Business Overview
Table 63. Tayho High-performance Para-aramid Fiber and Its Composite Materials Products, Services, and Solutions
Table 64. Revenue (US$ Million) in High-performance Para-aramid Fiber and Its Composite Materials Business of Tayho (2021–2026)
Table 65. Tayho Recent Developments
Table 66. DuPont Basic Information List
Table 67. DuPont Description and Business Overview
Table 68. DuPont High-performance Para-aramid Fiber and Its Composite Materials Products, Services, and Solutions
Table 69. Revenue (US$ Million) in High-performance Para-aramid Fiber and Its Composite Materials Business of DuPont (2021–2026)
Table 70. DuPont Recent Developments
Table 71. Hexcel Basic Information List
Table 72. Hexcel Description and Business Overview
Table 73. Hexcel High-performance Para-aramid Fiber and Its Composite Materials Products, Services, and Solutions
Table 74. Revenue (US$ Million) in High-performance Para-aramid Fiber and Its Composite Materials Business of Hexcel (2021–2026)
Table 75. Hexcel Recent Developments
Table 76. Toray Industries Basic Information List
Table 77. Toray Industries Description and Business Overview
Table 78. Toray Industries High-performance Para-aramid Fiber and Its Composite Materials Products, Services, and Solutions
Table 79. Revenue (US$ Million) in High-performance Para-aramid Fiber and Its Composite Materials Business of Toray Industries (2021–2026)
Table 80. Toray Industries Recent Developments
Table 81. Solvay Basic Information List
Table 82. Solvay Description and Business Overview
Table 83. Solvay High-performance Para-aramid Fiber and Its Composite Materials Products, Services, and Solutions
Table 84. Revenue (US$ Million) in High-performance Para-aramid Fiber and Its Composite Materials Business of Solvay (2021–2026)
Table 85. Solvay Recent Developments
Table 86. Mitsubishi Chemical Group Basic Information List
Table 87. Mitsubishi Chemical Group Description and Business Overview
Table 88. Mitsubishi Chemical Group High-performance Para-aramid Fiber and Its Composite Materials Products, Services, and Solutions
Table 89. Revenue (US$ Million) in High-performance Para-aramid Fiber and Its Composite Materials Business of Mitsubishi Chemical Group (2021–2026)
Table 90. Mitsubishi Chemical Group Recent Developments
Table 91. SGL Carbon Basic Information List
Table 92. SGL Carbon Description and Business Overview
Table 93. SGL Carbon High-performance Para-aramid Fiber and Its Composite Materials Products, Services, and Solutions
Table 94. Revenue (US$ Million) in High-performance Para-aramid Fiber and Its Composite Materials Business of SGL Carbon (2021–2026)
Table 95. SGL Carbon Recent Developments
Table 96. Revenue (US$ Million) in High-performance Para-aramid Fiber and Its Composite Materials Business of Company 40 (2021–2026)
Table 97. Company 40 Recent Developments
Table 98. Key Raw Materials Lists
Table 99. Key Suppliers of Raw Materials Lists
Table 100. High-performance Para-aramid Fiber and Its Composite Materials Downstream Customers
Table 101. High-performance Para-aramid Fiber and Its Composite Materials Distributors List
Table 102. Research Programs/Design for This Report
Table 103. Key Data Information from Secondary Sources
Table 104. Key Data Information from Primary Sources
List of Figures
Figure 1. High-performance Para-aramid Fiber and Its Composite Materials Product Picture
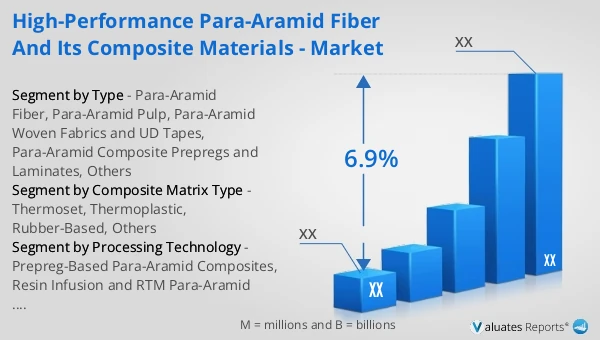
Figure 2. Global High-performance Para-aramid Fiber and Its Composite Materials Sales Value, 2021 vs 2025 vs 2032 (US$ Million)
Figure 3. Global High-performance Para-aramid Fiber and Its Composite Materials Sales Value (US$ Million), 2021–2032
Figure 4. High-performance Para-aramid Fiber and Its Composite Materials Report Years Considered
Figure 5. Global High-performance Para-aramid Fiber and Its Composite Materials Players Revenue Ranking (US$ Million), 2025
Figure 6. The 5 and 10 Largest Companies in the World: Market Share by High-performance Para-aramid Fiber and Its Composite Materials Revenue in 2025
Figure 7. High-performance Para-aramid Fiber and Its Composite Materials Market Share by Company Type (Tier 1, Tier 2, and Tier 3): 2021 vs 2025
Figure 8. Para-Aramid Fiber Picture
Figure 9. Para-Aramid Pulp Picture
Figure 10. Para-Aramid Woven Fabrics and UD Tapes Picture
Figure 11. Para-Aramid Composite Prepregs and Laminates Picture
Figure 12. Others Picture
Figure 13. Global High-performance Para-aramid Fiber and Its Composite Materials Sales Value by Type (US$ Million), 2021 vs 2025 vs 2032
Figure 14. Global High-performance Para-aramid Fiber and Its Composite Materials Sales Value Market Share by Type, 2025 & 2032
Figure 15. Thermoset Picture
Figure 16. Thermoplastic Picture
Figure 17. Rubber-Based Picture
Figure 18. Others Picture
Figure 19. Global High-performance Para-aramid Fiber and Its Composite Materials Sales Value by Composite Matrix Type (US$ Million), 2021 vs 2025 vs 2032
Figure 20. Global High-performance Para-aramid Fiber and Its Composite Materials Sales Value Market Share by Composite Matrix Type, 2025 & 2032
Figure 21. Prepreg-Based Para-Aramid Composites Picture
Figure 22. Resin Infusion and RTM Para-Aramid Composites Picture
Figure 23. Filament Winding Para-Aramid Structures Picture
Figure 24. Compression-Molded Para-Aramid Composite Parts Picture
Figure 25. Global High-performance Para-aramid Fiber and Its Composite Materials Sales Value by Processing Technology (US$ Million), 2021 vs 2025 vs 2032
Figure 26. Global High-performance Para-aramid Fiber and Its Composite Materials Sales Value Market Share by Processing Technology, 2025 & 2032
Figure 27. Product Picture of Protective and Safety Equipment
Figure 28. Product Picture of Automotive
Figure 29. Product Picture of Friction and Sealing Materials
Figure 30. Product Picture of Industrial Reinforcement
Figure 31. Product Picture of Others
Figure 32. Global High-performance Para-aramid Fiber and Its Composite Materials Sales Value by Application (US$ Million), 2021 vs 2025 vs 2032
Figure 33. Global High-performance Para-aramid Fiber and Its Composite Materials Sales Value Market Share by Application, 2025 & 2032
Figure 34. North America High-performance Para-aramid Fiber and Its Composite Materials Sales Value (US$ Million), 2021–2032
Figure 35. North America High-performance Para-aramid Fiber and Its Composite Materials Sales Value by Country (%), 2025 vs 2032
Figure 36. Europe High-performance Para-aramid Fiber and Its Composite Materials Sales Value (US$ Million), 2021–2032
Figure 37. Europe High-performance Para-aramid Fiber and Its Composite Materials Sales Value by Country (%), 2025 vs 2032
Figure 38. Asia Pacific High-performance Para-aramid Fiber and Its Composite Materials Sales Value (US$ Million), 2021–2032
Figure 39. Asia Pacific High-performance Para-aramid Fiber and Its Composite Materials Sales Value by Subregion (%), 2025 vs 2032
Figure 40. South America High-performance Para-aramid Fiber and Its Composite Materials Sales Value (US$ Million), 2021–2032
Figure 41. South America High-performance Para-aramid Fiber and Its Composite Materials Sales Value by Country (%), 2025 vs 2032
Figure 42. Middle East & Africa High-performance Para-aramid Fiber and Its Composite Materials Sales Value (US$ Million), 2021–2032
Figure 43. Middle East & Africa High-performance Para-aramid Fiber and Its Composite Materials Sales Value by Country (%), 2025 vs 2032
Figure 44. Key Countries/Regions High-performance Para-aramid Fiber and Its Composite Materials Sales Value (%), 2021–2032
Figure 45. United States High-performance Para-aramid Fiber and Its Composite Materials Sales Value (US$ Million), 2021–2032
Figure 46. United States High-performance Para-aramid Fiber and Its Composite Materials Sales Value by Type (%), 2025 vs 2032
Figure 47. United States High-performance Para-aramid Fiber and Its Composite Materials Sales Value by Application (%), 2025 vs 2032
Figure 48. Europe High-performance Para-aramid Fiber and Its Composite Materials Sales Value (US$ Million), 2021–2032
Figure 49. Europe High-performance Para-aramid Fiber and Its Composite Materials Sales Value by Type (%), 2025 vs 2032
Figure 50. Europe High-performance Para-aramid Fiber and Its Composite Materials Sales Value by Application (%), 2025 vs 2032
Figure 51. China High-performance Para-aramid Fiber and Its Composite Materials Sales Value (US$ Million), 2021–2032
Figure 52. China High-performance Para-aramid Fiber and Its Composite Materials Sales Value by Type (%), 2025 vs 2032
Figure 53. China High-performance Para-aramid Fiber and Its Composite Materials Sales Value by Application (%), 2025 vs 2032
Figure 54. Japan High-performance Para-aramid Fiber and Its Composite Materials Sales Value (US$ Million), 2021–2032
Figure 55. Japan High-performance Para-aramid Fiber and Its Composite Materials Sales Value by Type (%), 2025 vs 2032
Figure 56. Japan High-performance Para-aramid Fiber and Its Composite Materials Sales Value by Application (%), 2025 vs 2032
Figure 57. South Korea High-performance Para-aramid Fiber and Its Composite Materials Sales Value (US$ Million), 2021–2032
Figure 58. South Korea High-performance Para-aramid Fiber and Its Composite Materials Sales Value by Type (%), 2025 vs 2032
Figure 59. South Korea High-performance Para-aramid Fiber and Its Composite Materials Sales Value by Application (%), 2025 vs 2032
Figure 60. Southeast Asia High-performance Para-aramid Fiber and Its Composite Materials Sales Value (US$ Million), 2021–2032
Figure 61. Southeast Asia High-performance Para-aramid Fiber and Its Composite Materials Sales Value by Type (%), 2025 vs 2032
Figure 62. Southeast Asia High-performance Para-aramid Fiber and Its Composite Materials Sales Value by Application (%), 2025 vs 2032
Figure 63. India High-performance Para-aramid Fiber and Its Composite Materials Sales Value (US$ Million), 2021–2032
Figure 64. India High-performance Para-aramid Fiber and Its Composite Materials Sales Value by Type (%), 2025 vs 2032
Figure 65. India High-performance Para-aramid Fiber and Its Composite Materials Sales Value by Application (%), 2025 vs 2032
Figure 66. High-performance Para-aramid Fiber and Its Composite Materials Value Chain
Figure 67. High-performance Para-aramid Fiber and Its Composite Materials Cost Structure
Figure 68. Channels of Distribution (Direct Sales, and Distribution)
Figure 69. Bottom-up and Top-down Approaches for This Report
Figure 70. Data Triangulation
Figure 71. Key Executives Interviewed