List of Tables
Table 1. Global Metal Deburring Tool Market Value Comparison by Type (2024 VS 2031) & (US$ Million)
Table 2. Global Metal Deburring Tool Market Value by Application (2024 VS 2031) & (US$ Million)
Table 3. Global Metal Deburring Tool Market Competitive Situation by Manufacturers in 2024
Table 4. Global Metal Deburring Tool Sales (K Units) of Key Manufacturers (2020-2025)
Table 5. Global Metal Deburring Tool Sales Market Share by Manufacturers (2020-2025)
Table 6. Global Metal Deburring Tool Revenue (US$ Million) by Manufacturers (2020-2025)
Table 7. Global Metal Deburring Tool Revenue Share by Manufacturers (2020-2025)
Table 8. Global Market Metal Deburring Tool Average Price (US$/Unit) of Key Manufacturers (2020-2025)
Table 9. Global Key Players of Metal Deburring Tool, Industry Ranking, 2022 VS 2023 VS 2024
Table 10. Global Key Manufacturers of Metal Deburring Tool, Manufacturing Sites & Headquarters
Table 11. Global Key Manufacturers of Metal Deburring Tool, Product Type & Application
Table 12. Global Key Manufacturers of Metal Deburring Tool, Date of Enter into This Industry
Table 13. Global Manufacturers Market Concentration Ratio (CR5 and HHI)
Table 14. Global Metal Deburring Tool by Company Type (Tier 1, Tier 2, and Tier 3) & (based on the Revenue in Metal Deburring Tool as of 2024)
Table 15. Manufacturers Mergers & Acquisitions, Expansion Plans
Table 16. Global Metal Deburring Tool Market Size by Region (US$ Million): 2020 VS 2024 VS 2031
Table 17. Global Metal Deburring Tool Sales by Region (2020-2025) & (K Units)
Table 18. Global Metal Deburring Tool Sales Market Share by Region (2020-2025)
Table 19. Global Metal Deburring Tool Sales by Region (2026-2031) & (K Units)
Table 20. Global Metal Deburring Tool Sales Market Share by Region (2026-2031)
Table 21. Global Metal Deburring Tool Revenue by Region (2020-2025) & (US$ Million)
Table 22. Global Metal Deburring Tool Revenue Market Share by Region (2020-2025)
Table 23. Global Metal Deburring Tool Revenue by Region (2026-2031) & (US$ Million)
Table 24. Global Metal Deburring Tool Revenue Market Share by Region (2026-2031)
Table 25. North America Metal Deburring Tool Revenue by Country: 2020 VS 2024 VS 2031 (US$ Million)
Table 26. North America Metal Deburring Tool Sales by Country (2020-2025) & (K Units)
Table 27. North America Metal Deburring Tool Sales by Country (2026-2031) & (K Units)
Table 28. North America Metal Deburring Tool Revenue by Country (2020-2025) & (US$ Million)
Table 29. North America Metal Deburring Tool Revenue by Country (2026-2031) & (US$ Million)
Table 30. Europe Metal Deburring Tool Revenue by Country: 2020 VS 2024 VS 2031 (US$ Million)
Table 31. Europe Metal Deburring Tool Sales by Country (2020-2025) & (K Units)
Table 32. Europe Metal Deburring Tool Sales by Country (2026-2031) & (K Units)
Table 33. Europe Metal Deburring Tool Revenue by Country (2020-2025) & (US$ Million)
Table 34. Europe Metal Deburring Tool Revenue by Country (2026-2031) & (US$ Million)
Table 35. Asia Pacific Metal Deburring Tool Revenue by Region: 2020 VS 2024 VS 2031 (US$ Million)
Table 36. Asia Pacific Metal Deburring Tool Sales by Region (2020-2025) & (K Units)
Table 37. Asia Pacific Metal Deburring Tool Sales by Region (2026-2031) & (K Units)
Table 38. Asia Pacific Metal Deburring Tool Revenue by Region (2020-2025) & (US$ Million)
Table 39. Asia Pacific Metal Deburring Tool Revenue by Region (2026-2031) & (US$ Million)
Table 40. Latin America Metal Deburring Tool Revenue by Country: 2020 VS 2024 VS 2031 (US$ Million)
Table 41. Latin America Metal Deburring Tool Sales by Country (2020-2025) & (K Units)
Table 42. Latin America Metal Deburring Tool Sales by Country (2026-2031) & (K Units)
Table 43. Latin America Metal Deburring Tool Revenue by Country (2020-2025) & (US$ Million)
Table 44. Latin America Metal Deburring Tool Revenue by Country (2026-2031) & (US$ Million)
Table 45. Middle East and Africa Metal Deburring Tool Revenue by Country: 2020 VS 2024 VS 2031 (US$ Million)
Table 46. Middle East and Africa Metal Deburring Tool Sales by Country (2020-2025) & (K Units)
Table 47. Middle East and Africa Metal Deburring Tool Sales by Country (2026-2031) & (K Units)
Table 48. Middle East and Africa Metal Deburring Tool Revenue by Country (2020-2025) & (US$ Million)
Table 49. Middle East and Africa Metal Deburring Tool Revenue by Country (2026-2031) & (US$ Million)
Table 50. Global Metal Deburring Tool Sales (K Units) by Type (2020-2025)
Table 51. Global Metal Deburring Tool Sales (K Units) by Type (2026-2031)
Table 52. Global Metal Deburring Tool Sales Market Share by Type (2020-2025)
Table 53. Global Metal Deburring Tool Sales Market Share by Type (2026-2031)
Table 54. Global Metal Deburring Tool Revenue (US$ Million) by Type (2020-2025)
Table 55. Global Metal Deburring Tool Revenue (US$ Million) by Type (2026-2031)
Table 56. Global Metal Deburring Tool Revenue Market Share by Type (2020-2025)
Table 57. Global Metal Deburring Tool Revenue Market Share by Type (2026-2031)
Table 58. Global Metal Deburring Tool Price (US$/Unit) by Type (2020-2025)
Table 59. Global Metal Deburring Tool Price (US$/Unit) by Type (2026-2031)
Table 60. Global Metal Deburring Tool Sales (K Units) by Application (2020-2025)
Table 61. Global Metal Deburring Tool Sales (K Units) by Application (2026-2031)
Table 62. Global Metal Deburring Tool Sales Market Share by Application (2020-2025)
Table 63. Global Metal Deburring Tool Sales Market Share by Application (2026-2031)
Table 64. Global Metal Deburring Tool Revenue (US$ Million) by Application (2020-2025)
Table 65. Global Metal Deburring Tool Revenue (US$ Million) by Application (2026-2031)
Table 66. Global Metal Deburring Tool Revenue Market Share by Application (2020-2025)
Table 67. Global Metal Deburring Tool Revenue Market Share by Application (2026-2031)
Table 68. Global Metal Deburring Tool Price (US$/Unit) by Application (2020-2025)
Table 69. Global Metal Deburring Tool Price (US$/Unit) by Application (2026-2031)
Table 70. Noga Company Information
Table 71. Noga Description and Business Overview
Table 72. Noga Metal Deburring Tool Sales (K Units), Revenue (US$ Million), Price (US$/Unit) and Gross Margin (2020-2025)
Table 73. Noga Metal Deburring Tool Product
Table 74. Noga Recent Developments/Updates
Table 75. Vargus Company Information
Table 76. Vargus Description and Business Overview
Table 77. Vargus Metal Deburring Tool Sales (K Units), Revenue (US$ Million), Price (US$/Unit) and Gross Margin (2020-2025)
Table 78. Vargus Metal Deburring Tool Product
Table 79. Vargus Recent Developments/Updates
Table 80. APEX Company Information
Table 81. APEX Description and Business Overview
Table 82. APEX Metal Deburring Tool Sales (K Units), Revenue (US$ Million), Price (US$/Unit) and Gross Margin (2020-2025)
Table 83. APEX Metal Deburring Tool Product
Table 84. APEX Recent Developments/Updates
Table 85. ATI Industrial Automation Company Information
Table 86. ATI Industrial Automation Description and Business Overview
Table 87. ATI Industrial Automation Metal Deburring Tool Sales (K Units), Revenue (US$ Million), Price (US$/Unit) and Gross Margin (2020-2025)
Table 88. ATI Industrial Automation Metal Deburring Tool Product
Table 89. ATI Industrial Automation Recent Developments/Updates
Table 90. Ingersoll Rand Company Information
Table 91. Ingersoll Rand Description and Business Overview
Table 92. Ingersoll Rand Metal Deburring Tool Sales (K Units), Revenue (US$ Million), Price (US$/Unit) and Gross Margin (2020-2025)
Table 93. Ingersoll Rand Metal Deburring Tool Product
Table 94. Ingersoll Rand Recent Developments/Updates
Table 95. Parker hannifin Company Information
Table 96. Parker hannifin Description and Business Overview
Table 97. Parker hannifin Metal Deburring Tool Sales (K Units), Revenue (US$ Million), Price (US$/Unit) and Gross Margin (2020-2025)
Table 98. Parker hannifin Metal Deburring Tool Product
Table 99. Parker hannifin Recent Developments/Updates
Table 100. Great Star Company Information
Table 101. Great Star Description and Business Overview
Table 102. Great Star Metal Deburring Tool Sales (K Units), Revenue (US$ Million), Price (US$/Unit) and Gross Margin (2020-2025)
Table 103. Great Star Metal Deburring Tool Product
Table 104. Great Star Recent Developments/Updates
Table 105. Snap-on Company Information
Table 106. Snap-on Description and Business Overview
Table 107. Snap-on Metal Deburring Tool Sales (K Units), Revenue (US$ Million), Price (US$/Unit) and Gross Margin (2020-2025)
Table 108. Snap-on Metal Deburring Tool Product
Table 109. Snap-on Recent Developments/Updates
Table 110. Cogsdill Tool Company Information
Table 111. Cogsdill Tool Description and Business Overview
Table 112. Cogsdill Tool Metal Deburring Tool Sales (K Units), Revenue (US$ Million), Price (US$/Unit) and Gross Margin (2020-2025)
Table 113. Cogsdill Tool Metal Deburring Tool Product
Table 114. Cogsdill Tool Recent Developments/Updates
Table 115. Heule Company Information
Table 116. Heule Description and Business Overview
Table 117. Heule Metal Deburring Tool Sales (K Units), Revenue (US$ Million), Price (US$/Unit) and Gross Margin (2020-2025)
Table 118. Heule Metal Deburring Tool Product
Table 119. Heule Recent Developments/Updates
Table 120. Xebec Technology Company Information
Table 121. Xebec Technology Description and Business Overview
Table 122. Xebec Technology Metal Deburring Tool Sales (K Units), Revenue (US$ Million), Price (US$/Unit) and Gross Margin (2020-2025)
Table 123. Xebec Technology Metal Deburring Tool Product
Table 124. Xebec Technology Recent Developments/Updates
Table 125. Gravostar Company Information
Table 126. Gravostar Description and Business Overview
Table 127. Gravostar Metal Deburring Tool Sales (K Units), Revenue (US$ Million), Price (US$/Unit) and Gross Margin (2020-2025)
Table 128. Gravostar Metal Deburring Tool Product
Table 129. Gravostar Recent Developments/Updates
Table 130. Aks Teknik Company Information
Table 131. Aks Teknik Description and Business Overview
Table 132. Aks Teknik Metal Deburring Tool Sales (K Units), Revenue (US$ Million), Price (US$/Unit) and Gross Margin (2020-2025)
Table 133. Aks Teknik Metal Deburring Tool Product
Table 134. Aks Teknik Recent Developments/Updates
Table 135. Royal Company Information
Table 136. Royal Description and Business Overview
Table 137. Royal Metal Deburring Tool Sales (K Units), Revenue (US$ Million), Price (US$/Unit) and Gross Margin (2020-2025)
Table 138. Royal Metal Deburring Tool Product
Table 139. Royal Recent Developments/Updates
Table 140. REMS Company Information
Table 141. REMS Description and Business Overview
Table 142. REMS Metal Deburring Tool Sales (K Units), Revenue (US$ Million), Price (US$/Unit) and Gross Margin (2020-2025)
Table 143. REMS Metal Deburring Tool Product
Table 144. REMS Recent Developments/Updates
Table 145. KREUZ Company Information
Table 146. KREUZ Description and Business Overview
Table 147. KREUZ Metal Deburring Tool Sales (K Units), Revenue (US$ Million), Price (US$/Unit) and Gross Margin (2020-2025)
Table 148. KREUZ Metal Deburring Tool Product
Table 149. KREUZ Recent Developments/Updates
Table 150. Assfalg GmbH Company Information
Table 151. Assfalg GmbH Description and Business Overview
Table 152. Assfalg GmbH Metal Deburring Tool Sales (K Units), Revenue (US$ Million), Price (US$/Unit) and Gross Margin (2020-2025)
Table 153. Assfalg GmbH Metal Deburring Tool Product
Table 154. Assfalg GmbH Recent Developments/Updates
Table 155. Hozan Company Information
Table 156. Hozan Description and Business Overview
Table 157. Hozan Metal Deburring Tool Sales (K Units), Revenue (US$ Million), Price (US$/Unit) and Gross Margin (2020-2025)
Table 158. Hozan Metal Deburring Tool Product
Table 159. Hozan Recent Developments/Updates
Table 160. Key Raw Materials Lists
Table 161. Raw Materials Key Suppliers Lists
Table 162. Metal Deburring Tool Distributors List
Table 163. Metal Deburring Tool Customers List
Table 164. Metal Deburring Tool Market Trends
Table 165. Metal Deburring Tool Market Drivers
Table 166. Metal Deburring Tool Market Challenges
Table 167. Metal Deburring Tool Market Restraints
Table 168. Research Programs/Design for This Report
Table 169. Key Data Information from Secondary Sources
Table 170. Key Data Information from Primary Sources
Table 171. Authors List of This Report
List of Figures
Figure 1. Product Picture of Metal Deburring Tool
Figure 2. Global Metal Deburring Tool Market Value Comparison by Type (2020-2031) & (US$ Million)
Figure 3. Global Metal Deburring Tool Market Share by Type: 2024 & 2031
Figure 4. Hand Deburring Tools Product Picture
Figure 5. Automatic Deburring Tools Product Picture
Figure 6. Global Metal Deburring Tool Market Value by Application (2020-2031) & (US$ Million)
Figure 7. Global Metal Deburring Tool Market Share by Application: 2024 & 2031
Figure 8. Internal Thread
Figure 9. O-ring Groove
Figure 10. Both Sides of the Board
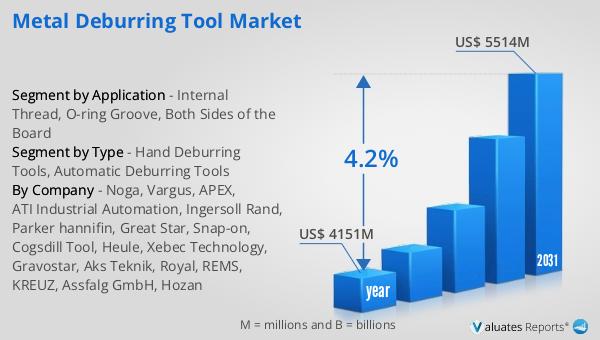
Figure 11. Global Metal Deburring Tool Revenue, (US$ Million), 2020 VS 2024 VS 2031
Figure 12. Global Metal Deburring Tool Market Size (2020-2031) & (US$ Million)
Figure 13. Global Metal Deburring Tool Sales (2020-2031) & (K Units)
Figure 14. Global Metal Deburring Tool Average Price (US$/Unit) & (2020-2031)
Figure 15. Metal Deburring Tool Report Years Considered
Figure 16. Metal Deburring Tool Sales Share by Manufacturers in 2024
Figure 17. Global Metal Deburring Tool Revenue Share by Manufacturers in 2024
Figure 18. Global 5 and 10 Largest Metal Deburring Tool Players: Market Share by Revenue in Metal Deburring Tool in 2024
Figure 19. Metal Deburring Tool Market Share by Company Type (Tier 1, Tier 2, and Tier 3): 2020 VS 2024
Figure 20. Global Metal Deburring Tool Market Size by Region (US$ Million): 2020 VS 2024 VS 2031
Figure 21. North America Metal Deburring Tool Sales Market Share by Country (2020-2031)
Figure 22. North America Metal Deburring Tool Revenue Market Share by Country (2020-2031)
Figure 23. U.S. Metal Deburring Tool Revenue Growth Rate (2020-2031) & (US$ Million)
Figure 24. Canada Metal Deburring Tool Revenue Growth Rate (2020-2031) & (US$ Million)
Figure 25. Europe Metal Deburring Tool Sales Market Share by Country (2020-2031)
Figure 26. Europe Metal Deburring Tool Revenue Market Share by Country (2020-2031)
Figure 27. Germany Metal Deburring Tool Revenue Growth Rate (2020-2031) & (US$ Million)
Figure 28. France Metal Deburring Tool Revenue Growth Rate (2020-2031) & (US$ Million)
Figure 29. U.K. Metal Deburring Tool Revenue Growth Rate (2020-2031) & (US$ Million)
Figure 30. Italy Metal Deburring Tool Revenue Growth Rate (2020-2031) & (US$ Million)
Figure 31. Russia Metal Deburring Tool Revenue Growth Rate (2020-2031) & (US$ Million)
Figure 32. Asia Pacific Metal Deburring Tool Sales Market Share by Region (2020-2031)
Figure 33. Asia Pacific Metal Deburring Tool Revenue Market Share by Region (2020-2031)
Figure 34. China Metal Deburring Tool Revenue Growth Rate (2020-2031) & (US$ Million)
Figure 35. Japan Metal Deburring Tool Revenue Growth Rate (2020-2031) & (US$ Million)
Figure 36. South Korea Metal Deburring Tool Revenue Growth Rate (2020-2031) & (US$ Million)
Figure 37. India Metal Deburring Tool Revenue Growth Rate (2020-2031) & (US$ Million)
Figure 38. Australia Metal Deburring Tool Revenue Growth Rate (2020-2031) & (US$ Million)
Figure 39. Taiwan Metal Deburring Tool Revenue Growth Rate (2020-2031) & (US$ Million)
Figure 40. Indonesia Metal Deburring Tool Revenue Growth Rate (2020-2031) & (US$ Million)
Figure 41. Thailand Metal Deburring Tool Revenue Growth Rate (2020-2031) & (US$ Million)
Figure 42. Malaysia Metal Deburring Tool Revenue Growth Rate (2020-2031) & (US$ Million)
Figure 43. Philippines Metal Deburring Tool Revenue Growth Rate (2020-2031) & (US$ Million)
Figure 44. Latin America Metal Deburring Tool Sales Market Share by Country (2020-2031)
Figure 45. Latin America Metal Deburring Tool Revenue Market Share by Country (2020-2031)
Figure 46. Mexico Metal Deburring Tool Revenue Growth Rate (2020-2031) & (US$ Million)
Figure 47. Brazil Metal Deburring Tool Revenue Growth Rate (2020-2031) & (US$ Million)
Figure 48. Argentina Metal Deburring Tool Revenue Growth Rate (2020-2031) & (US$ Million)
Figure 49. Middle East and Africa Metal Deburring Tool Sales Market Share by Country (2020-2031)
Figure 50. Middle East and Africa Metal Deburring Tool Revenue Market Share by Country (2020-2031)
Figure 51. Turkey Metal Deburring Tool Revenue Growth Rate (2020-2031) & (US$ Million)
Figure 52. Saudi Arabia Metal Deburring Tool Revenue Growth Rate (2020-2031) & (US$ Million)
Figure 53. U.A.E Metal Deburring Tool Revenue Growth Rate (2020-2031) & (US$ Million)
Figure 54. Global Sales Market Share of Metal Deburring Tool by Type (2020-2031)
Figure 55. Global Revenue Market Share of Metal Deburring Tool by Type (2020-2031)
Figure 56. Global Metal Deburring Tool Price (US$/Unit) by Type (2020-2031)
Figure 57. Global Sales Market Share of Metal Deburring Tool by Application (2020-2031)
Figure 58. Global Revenue Market Share of Metal Deburring Tool by Application (2020-2031)
Figure 59. Global Metal Deburring Tool Price (US$/Unit) by Application (2020-2031)
Figure 60. Metal Deburring Tool Value Chain
Figure 61. Channels of Distribution (Direct Vs Distribution)
Figure 62. Bottom-up and Top-down Approaches for This Report
Figure 63. Data Triangulation
Figure 64. Key Executives Interviewed