
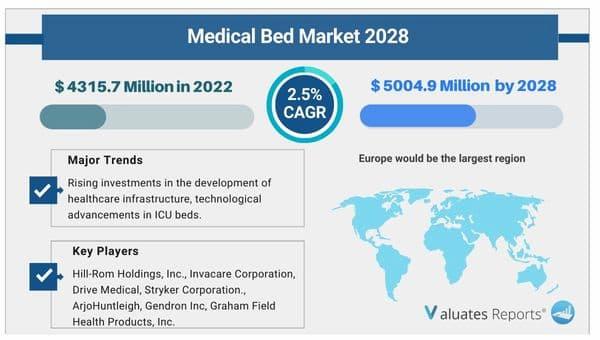
Due to the COVID-19 pandemic, the global Medical Beds market size is estimated to be worth USD 4315.7 Million in 2022 and is forecast to a readjusted size of USD 5004.9 Million by 2028 with a CAGR of 2.5% during the review period.
/
With the development of the medical equipment and various demands from the patient, there are coming more and more categories of multi-function and specialized medical beds. Medical Bed researched in this report includes: Med/Surg Hospital Bed; Home Care Bed; Long Term Care/Rehab Bed; Bariatric Bed; Critical Care Beds. In this report, we divide the medical beds into five types: Maternity Bed, Critical care bed, Medical surgical bed, Long term care bed and other; at the same time we divide the medical beds into three applications: Home care bed, Hospital bed and other.
Over the long term, overall patient and provider demand for health care products and services will continue to grow as a result of a number of factors, including an aging population, longer life expectancies, and an increasing number of sicker patients across all care settings, including hospitals, extended care facilities and in the home. The monopoly power of the leader companies will enhance a lot .The Hill-Rom have made several recent acquisitions, most notably the acquisitions of Welch Allyn Holdings, Inc. (“Welch Allyn”), Trumpf Medical (“Trumpf”), and Virtus, Inc. (“Virtus”), and we plan to make additional acquisitions in the future. There are growing desire demand among developing countries to Invest in Health Care. While industry growth rates in more mature geographic regions such as western and northern Europe and Japan have moderated, in many other geographic markets, where the relative spending on health care is increasing, we expect long-term increasing demand for medical technologies. New hospital construction and hospital refurbishments are expected in regions such as Latin America, the Middle East and many parts of Asia. This could increase overall demand for our products and services. Acuities and Technological Impact is changing. As a result of the growing population of the elderly and obese, health care systems are challenged to treat rising incidences of complex diseases and conditions such as diabetes, congestive heart failure and respiratory disease. As a conclusion, there will be slow growth in the demands of the medical beds in North America, and the America and the Canada, especially America will control the whole North America market. Even the Mexico has a big population, there is nearly no players in medical beds industry, and the demand quantity is very small. The monopoly will make more barriers to the new players . And the technology will be the decisive factors to the stability of the developing of the players.
The objectives of this study are to define, segment, and project the size of the Medical Bed market based on company, product type, end user and key regions.
This report studies the global market size of Medical Bed in key regions like North America, Europe, Asia Pacific, Central & South America and Middle East & Africa, focuses on the consumption of Medical Bed in these regions.
This research report categorizes the global Medical Bed market by top players/brands, region, type and end user. This report also studies the global Medical Bed market status, competition landscape, market share, growth rate, future trends, market drivers, opportunities and challenges, sales channels and distributors.
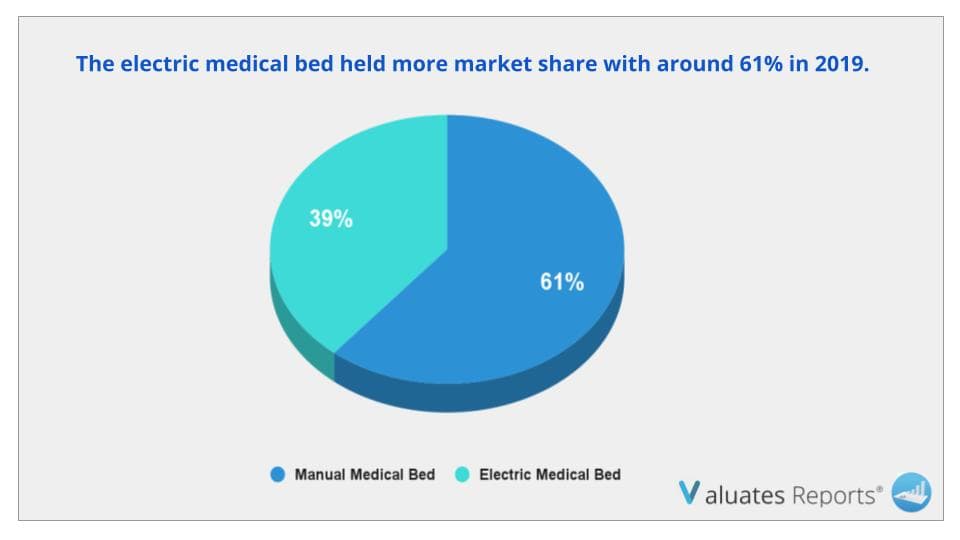
In terms of regions, the largest segment of medical beds would be Europe, with a market share of about 31% in 2019. Following Europe, North America accounted for over 30% of global market. Between the two types of medical beds, the electric medical bed held more market share with around 61% in 2019.
|
Report Metric |
Details |
|
Report Name |
Medical Beds Market |
|
Market size value in 2022 |
USD 4315.7 Million |
|
Revenue forecast in 2028 |
USD 5004.9 Million |
|
Growth Rate |
CAGR 2.5% |
|
Base year considered |
2020 |
|
Forecast Period |
2022-2028 |
|
By Type |
Long Term Care Bed, Maternal Bed, Critical Bed, Medical-Surgical Bed |
|
By Application |
Household Medical Bed, Hospital Medical Bed |
|
Report Coverage |
Revenue & volume forecast, company share, competitive landscape, growth factors, and trends |
|
Segments Covered |
By Type, Application, and Region |
|
Geographic Regions Covered |
North America, Europe, Asia Pacific, Latin America, Middle East & Africa |
Ans. Due to the COVID-19 pandemic, the global Medical Beds market size is estimated to be worth US$ 4315.7 million in 2022 and is forecast to a readjusted size of US$ 5004.9 million by 2028 with a CAGR of 2.5% during the review period.
Ans. Some of the major companies are Hill-Rom Holdings, Inc., Invacare Corporation, Drive Medical, Stryker Corporation., ArjoHuntleigh, Gendron Inc, Graham Field Health Products, Inc., Hard Manufacturing Co, Umano Medical, Transfer Master.
Ans. Yes, the report includes a COVID-19 impact analysis. Also, it is further extended into every individual segment of the report.
Ans. The electric medical bed held more market share with around 61% in 2019.
Ans. In terms of regions, the largest segment of medical beds would be Europe, with a market share of about 31% in 2019. Following Europe, North America accounted for over 30% of global market.
1 Study Coverage
1.1 Medical Beds Product Introduction
1.2 Market by Type
1.2.1 Global Medical Beds Market Size Growth Rate by Type, 2017 VS 2021 VS 2028
1.2.2 Manual Medical Bed
1.2.3 Electric Medical Bed
1.3 Market by Application
1.3.1 Global Medical Beds Market Size Growth Rate by Application, 2017 VS 2021 VS 2028
1.3.2 Hospital
1.3.3 Nursing Home
1.3.4 Home Care
1.3.5 Other
1.4 Study Objectives
1.5 Years Considered
2 Executive Summary
2.1 Global Medical Beds Sales Estimates and Forecasts 2017-2028
2.2 Global Medical Beds Revenue Estimates and Forecasts 2017-2028
2.3 Global Medical Beds Revenue by Region: 2017 VS 2021 VS 2028
2.4 Global Medical Beds Sales by Region
2.4.1 Global Medical Beds Sales by Region (2017-2022)
2.4.2 Global Sales Medical Beds by Region (2023-2028)
2.5 Global Medical Beds Revenue by Region
2.5.1 Global Medical Beds Revenue by Region (2017-2022)
2.5.2 Global Medical Beds Revenue by Region (2023-2028)
2.6 North America
2.7 Europe
2.8 Asia-Pacific
2.9 Latin America
2.10 Middle East & Africa
3 Competition by Manufacturers
3.1 Global Medical Beds Sales by Manufacturers
3.1.1 Global Top Medical Beds Manufacturers by Sales (2017-2022)
3.1.2 Global Medical Beds Sales Market Share by Manufacturers (2017-2022)
3.1.3 Global Top 10 and Top 5 Largest Manufacturers of Medical Beds in 2021
3.2 Global Medical Beds Revenue by Manufacturers
3.2.1 Global Medical Beds Revenue by Manufacturers (2017-2022)
3.2.2 Global Medical Beds Revenue Market Share by Manufacturers (2017-2022)
3.2.3 Global Top 10 and Top 5 Companies by Medical Beds Revenue in 2021
3.3 Global Medical Beds Sales Price by Manufacturers (2017-2022)
3.4 Analysis of Competitive Landscape
3.4.1 Manufacturers Market Concentration Ratio (CR5 and HHI)
3.4.2 Global Medical Beds Market Share by Company Type (Tier 1, Tier 2, and Tier 3)
3.4.3 Global Medical Beds Manufacturers Geographical Distribution
3.5 Mergers & Acquisitions, Expansion Plans
4 Market Size by Type
4.1 Global Medical Beds Sales by Type
4.1.1 Global Medical Beds Historical Sales by Type (2017-2022)
4.1.2 Global Medical Beds Forecasted Sales by Type (2023-2028)
4.1.3 Global Medical Beds Sales Market Share by Type (2017-2028)
4.2 Global Medical Beds Revenue by Type
4.2.1 Global Medical Beds Historical Revenue by Type (2017-2022)
4.2.2 Global Medical Beds Forecasted Revenue by Type (2023-2028)
4.2.3 Global Medical Beds Revenue Market Share by Type (2017-2028)
4.3 Global Medical Beds Price by Type
4.3.1 Global Medical Beds Price by Type (2017-2022)
4.3.2 Global Medical Beds Price Forecast by Type (2023-2028)
5 Market Size by Application
5.1 Global Medical Beds Sales by Application
5.1.1 Global Medical Beds Historical Sales by Application (2017-2022)
5.1.2 Global Medical Beds Forecasted Sales by Application (2023-2028)
5.1.3 Global Medical Beds Sales Market Share by Application (2017-2028)
5.2 Global Medical Beds Revenue by Application
5.2.1 Global Medical Beds Historical Revenue by Application (2017-2022)
5.2.2 Global Medical Beds Forecasted Revenue by Application (2023-2028)
5.2.3 Global Medical Beds Revenue Market Share by Application (2017-2028)
5.3 Global Medical Beds Price by Application
5.3.1 Global Medical Beds Price by Application (2017-2022)
5.3.2 Global Medical Beds Price Forecast by Application (2023-2028)
6 North America
6.1 North America Medical Beds Market Size by Type
6.1.1 North America Medical Beds Sales by Type (2017-2028)
6.1.2 North America Medical Beds Revenue by Type (2017-2028)
6.2 North America Medical Beds Market Size by Application
6.2.1 North America Medical Beds Sales by Application (2017-2028)
6.2.2 North America Medical Beds Revenue by Application (2017-2028)
6.3 North America Medical Beds Market Size by Country
6.3.1 North America Medical Beds Sales by Country (2017-2028)
6.3.2 North America Medical Beds Revenue by Country (2017-2028)
6.3.3 U.S.
6.3.4 Canada
7 Europe
7.1 Europe Medical Beds Market Size by Type
7.1.1 Europe Medical Beds Sales by Type (2017-2028)
7.1.2 Europe Medical Beds Revenue by Type (2017-2028)
7.2 Europe Medical Beds Market Size by Application
7.2.1 Europe Medical Beds Sales by Application (2017-2028)
7.2.2 Europe Medical Beds Revenue by Application (2017-2028)
7.3 Europe Medical Beds Market Size by Country
7.3.1 Europe Medical Beds Sales by Country (2017-2028)
7.3.2 Europe Medical Beds Revenue by Country (2017-2028)
7.3.3 Germany
7.3.4 France
7.3.5 U.K.
7.3.6 Italy
7.3.7 Russia
8 Asia Pacific
8.1 Asia Pacific Medical Beds Market Size by Type
8.1.1 Asia Pacific Medical Beds Sales by Type (2017-2028)
8.1.2 Asia Pacific Medical Beds Revenue by Type (2017-2028)
8.2 Asia Pacific Medical Beds Market Size by Application
8.2.1 Asia Pacific Medical Beds Sales by Application (2017-2028)
8.2.2 Asia Pacific Medical Beds Revenue by Application (2017-2028)
8.3 Asia Pacific Medical Beds Market Size by Region
8.3.1 Asia Pacific Medical Beds Sales by Region (2017-2028)
8.3.2 Asia Pacific Medical Beds Revenue by Region (2017-2028)
8.3.3 China
8.3.4 Japan
8.3.5 South Korea
8.3.6 India
8.3.7 Australia
8.3.8 Taiwan
8.3.9 Indonesia
8.3.10 Thailand
8.3.11 Malaysia
8.3.12 Philippines
9 Latin America
9.1 Latin America Medical Beds Market Size by Type
9.1.1 Latin America Medical Beds Sales by Type (2017-2028)
9.1.2 Latin America Medical Beds Revenue by Type (2017-2028)
9.2 Latin America Medical Beds Market Size by Application
9.2.1 Latin America Medical Beds Sales by Application (2017-2028)
9.2.2 Latin America Medical Beds Revenue by Application (2017-2028)
9.3 Latin America Medical Beds Market Size by Country
9.3.1 Latin America Medical Beds Sales by Country (2017-2028)
9.3.2 Latin America Medical Beds Revenue by Country (2017-2028)
9.3.3 Mexico
9.3.4 Brazil
9.3.5 Argentina
10 Middle East and Africa
10.1 Middle East and Africa Medical Beds Market Size by Type
10.1.1 Middle East and Africa Medical Beds Sales by Type (2017-2028)
10.1.2 Middle East and Africa Medical Beds Revenue by Type (2017-2028)
10.2 Middle East and Africa Medical Beds Market Size by Application
10.2.1 Middle East and Africa Medical Beds Sales by Application (2017-2028)
10.2.2 Middle East and Africa Medical Beds Revenue by Application (2017-2028)
10.3 Middle East and Africa Medical Beds Market Size by Country
10.3.1 Middle East and Africa Medical Beds Sales by Country (2017-2028)
10.3.2 Middle East and Africa Medical Beds Revenue by Country (2017-2028)
10.3.3 Turkey
10.3.4 Saudi Arabia
11 Company Profiles
11.1 Hill-Rom
11.1.1 Hill-Rom Corporation Information
11.1.2 Hill-Rom Overview
11.1.3 Hill-Rom Medical Beds Sales, Price, Revenue and Gross Margin (2017-2022)
11.1.4 Hill-Rom Medical Beds Product Model Numbers, Pictures, Descriptions and Specifications
11.1.5 Hill-Rom Recent Developments
11.2 Stryker
11.2.1 Stryker Corporation Information
11.2.2 Stryker Overview
11.2.3 Stryker Medical Beds Sales, Price, Revenue and Gross Margin (2017-2022)
11.2.4 Stryker Medical Beds Product Model Numbers, Pictures, Descriptions and Specifications
11.2.5 Stryker Recent Developments
11.3 Paramount Bed
11.3.1 Paramount Bed Corporation Information
11.3.2 Paramount Bed Overview
11.3.3 Paramount Bed Medical Beds Sales, Price, Revenue and Gross Margin (2017-2022)
11.3.4 Paramount Bed Medical Beds Product Model Numbers, Pictures, Descriptions and Specifications
11.3.5 Paramount Bed Recent Developments
11.4 Linet Group
11.4.1 Linet Group Corporation Information
11.4.2 Linet Group Overview
11.4.3 Linet Group Medical Beds Sales, Price, Revenue and Gross Margin (2017-2022)
11.4.4 Linet Group Medical Beds Product Model Numbers, Pictures, Descriptions and Specifications
11.4.5 Linet Group Recent Developments
11.5 Arjo
11.5.1 Arjo Corporation Information
11.5.2 Arjo Overview
11.5.3 Arjo Medical Beds Sales, Price, Revenue and Gross Margin (2017-2022)
11.5.4 Arjo Medical Beds Product Model Numbers, Pictures, Descriptions and Specifications
11.5.5 Arjo Recent Developments
11.6 Invacare Corporation
11.6.1 Invacare Corporation Corporation Information
11.6.2 Invacare Corporation Overview
11.6.3 Invacare Corporation Medical Beds Sales, Price, Revenue and Gross Margin (2017-2022)
11.6.4 Invacare Corporation Medical Beds Product Model Numbers, Pictures, Descriptions and Specifications
11.6.5 Invacare Corporation Recent Developments
11.7 Hopefull Medical Equipment
11.7.1 Hopefull Medical Equipment Corporation Information
11.7.2 Hopefull Medical Equipment Overview
11.7.3 Hopefull Medical Equipment Medical Beds Sales, Price, Revenue and Gross Margin (2017-2022)
11.7.4 Hopefull Medical Equipment Medical Beds Product Model Numbers, Pictures, Descriptions and Specifications
11.7.5 Hopefull Medical Equipment Recent Developments
11.8 Stiegelmeyer
11.8.1 Stiegelmeyer Corporation Information
11.8.2 Stiegelmeyer Overview
11.8.3 Stiegelmeyer Medical Beds Sales, Price, Revenue and Gross Margin (2017-2022)
11.8.4 Stiegelmeyer Medical Beds Product Model Numbers, Pictures, Descriptions and Specifications
11.8.5 Stiegelmeyer Recent Developments
11.9 Joerns Healthcare
11.9.1 Joerns Healthcare Corporation Information
11.9.2 Joerns Healthcare Overview
11.9.3 Joerns Healthcare Medical Beds Sales, Price, Revenue and Gross Margin (2017-2022)
11.9.4 Joerns Healthcare Medical Beds Product Model Numbers, Pictures, Descriptions and Specifications
11.9.5 Joerns Healthcare Recent Developments
11.10 Hebei Pukang Medical Instruments
11.10.1 Hebei Pukang Medical Instruments Corporation Information
11.10.2 Hebei Pukang Medical Instruments Overview
11.10.3 Hebei Pukang Medical Instruments Medical Beds Sales, Price, Revenue and Gross Margin (2017-2022)
11.10.4 Hebei Pukang Medical Instruments Medical Beds Product Model Numbers, Pictures, Descriptions and Specifications
11.10.5 Hebei Pukang Medical Instruments Recent Developments
11.11 Malvestio
11.11.1 Malvestio Corporation Information
11.11.2 Malvestio Overview
11.11.3 Malvestio Medical Beds Sales, Price, Revenue and Gross Margin (2017-2022)
11.11.4 Malvestio Medical Beds Product Model Numbers, Pictures, Descriptions and Specifications
11.11.5 Malvestio Recent Developments
11.12 Völker
11.12.1 Völker Corporation Information
11.12.2 Völker Overview
11.12.3 Völker Medical Beds Sales, Price, Revenue and Gross Margin (2017-2022)
11.12.4 Völker Medical Beds Product Model Numbers, Pictures, Descriptions and Specifications
11.12.5 Völker Recent Developments
11.13 Pardo
11.13.1 Pardo Corporation Information
11.13.2 Pardo Overview
11.13.3 Pardo Medical Beds Sales, Price, Revenue and Gross Margin (2017-2022)
11.13.4 Pardo Medical Beds Product Model Numbers, Pictures, Descriptions and Specifications
11.13.5 Pardo Recent Developments
11.14 Hengshui Hengzekang Medical Equipment
11.14.1 Hengshui Hengzekang Medical Equipment Corporation Information
11.14.2 Hengshui Hengzekang Medical Equipment Overview
11.14.3 Hengshui Hengzekang Medical Equipment Medical Beds Sales, Price, Revenue and Gross Margin (2017-2022)
11.14.4 Hengshui Hengzekang Medical Equipment Medical Beds Product Model Numbers, Pictures, Descriptions and Specifications
11.14.5 Hengshui Hengzekang Medical Equipment Recent Developments
11.15 Drive Medical
11.15.1 Drive Medical Corporation Information
11.15.2 Drive Medical Overview
11.15.3 Drive Medical Medical Beds Sales, Price, Revenue and Gross Margin (2017-2022)
11.15.4 Drive Medical Medical Beds Product Model Numbers, Pictures, Descriptions and Specifications
11.15.5 Drive Medical Recent Developments
11.16 Guangzhou Kangshen Science&Technology
11.16.1 Guangzhou Kangshen Science&Technology Corporation Information
11.16.2 Guangzhou Kangshen Science&Technology Overview
11.16.3 Guangzhou Kangshen Science&Technology Medical Beds Sales, Price, Revenue and Gross Margin (2017-2022)
11.16.4 Guangzhou Kangshen Science&Technology Medical Beds Product Model Numbers, Pictures, Descriptions and Specifications
11.16.5 Guangzhou Kangshen Science&Technology Recent Developments
11.17 Changzhou KC-Harvest Medical Equipment
11.17.1 Changzhou KC-Harvest Medical Equipment Corporation Information
11.17.2 Changzhou KC-Harvest Medical Equipment Overview
11.17.3 Changzhou KC-Harvest Medical Equipment Medical Beds Sales, Price, Revenue and Gross Margin (2017-2022)
11.17.4 Changzhou KC-Harvest Medical Equipment Medical Beds Product Model Numbers, Pictures, Descriptions and Specifications
11.17.5 Changzhou KC-Harvest Medical Equipment Recent Developments
11.18 Haelvoet
11.18.1 Haelvoet Corporation Information
11.18.2 Haelvoet Overview
11.18.3 Haelvoet Medical Beds Sales, Price, Revenue and Gross Margin (2017-2022)
11.18.4 Haelvoet Medical Beds Product Model Numbers, Pictures, Descriptions and Specifications
11.18.5 Haelvoet Recent Developments
11.19 Jiangsu Yongfa Medical Equipment Technology
11.19.1 Jiangsu Yongfa Medical Equipment Technology Corporation Information
11.19.2 Jiangsu Yongfa Medical Equipment Technology Overview
11.19.3 Jiangsu Yongfa Medical Equipment Technology Medical Beds Sales, Price, Revenue and Gross Margin (2017-2022)
11.19.4 Jiangsu Yongfa Medical Equipment Technology Medical Beds Product Model Numbers, Pictures, Descriptions and Specifications
11.19.5 Jiangsu Yongfa Medical Equipment Technology Recent Developments
11.20 Kanghui Medical Technology(Suzhou)
11.20.1 Kanghui Medical Technology(Suzhou) Corporation Information
11.20.2 Kanghui Medical Technology(Suzhou) Overview
11.20.3 Kanghui Medical Technology(Suzhou) Medical Beds Sales, Price, Revenue and Gross Margin (2017-2022)
11.20.4 Kanghui Medical Technology(Suzhou) Medical Beds Product Model Numbers, Pictures, Descriptions and Specifications
11.20.5 Kanghui Medical Technology(Suzhou) Recent Developments
12 Industry Chain and Sales Channels Analysis
12.1 Medical Beds Industry Chain Analysis
12.2 Medical Beds Key Raw Materials
12.2.1 Key Raw Materials
12.2.2 Raw Materials Key Suppliers
12.3 Medical Beds Production Mode & Process
12.4 Medical Beds Sales and Marketing
12.4.1 Medical Beds Sales Channels
12.4.2 Medical Beds Distributors
12.5 Medical Beds Customers
13 Market Drivers, Opportunities, Challenges and Risks Factors Analysis
13.1 Medical Beds Industry Trends
13.2 Medical Beds Market Drivers
13.3 Medical Beds Market Challenges
13.4 Medical Beds Market Restraints
14 Key Findings in The Global Medical Beds Study
15 Appendix
15.1 Research Methodology
15.1.1 Methodology/Research Approach
15.1.2 Data Source
15.2 Author Details
15.3 Disclaimer
List of Tables
Table 1. Global Medical Beds Market Size Growth Rate by Type, 2017 VS 2021 VS 2028 (US$ Million)
Table 2. Major Manufacturers of Manual Medical Bed
Table 3. Major Manufacturers of Electric Medical Bed
Table 4. Global Medical Beds Market Size Growth Rate by Application, 2017 VS 2021 VS 2028 (US$ Million)
Table 5. Global Medical Beds Revenue by Region: 2017 VS 2021 VS 2028 (US$ Million)
Table 6. Global Medical Beds Sales by Region (2017-2022) & (K Units)
Table 7. Global Medical Beds Sales Market Share by Region (2017-2022)
Table 8. Global Medical Beds Sales by Region (2023-2028) & (K Units)
Table 9. Global Medical Beds Sales Market Share by Region (2023-2028)
Table 10. Global Medical Beds Revenue by Region (2017-2022) & (US$ Million)
Table 11. Global Medical Beds Revenue Market Share by Region (2017-2022)
Table 12. Global Medical Beds Revenue by Region (2023-2028) & (US$ Million)
Table 13. Global Medical Beds Revenue Market Share by Region (2023-2028)
Table 14. Global Medical Beds Sales by Manufacturers (2017-2022) & (K Units)
Table 15. Global Medical Beds Sales Share by Manufacturers (2017-2022)
Table 16. Global Medical Beds Revenue by Manufacturers (2017-2022) & (US$ Million)
Table 17. Global Medical Beds Revenue Share by Manufacturers (2017-2022)
Table 18. Medical Beds Price by Manufacturers (2017-2022) &(USD/Unit)
Table 19. Global Medical Beds Manufacturers Market Concentration Ratio (CR5 and HHI)
Table 20. Global Medical Beds by Company Type (Tier 1, Tier 2, and Tier 3) & (based on the Revenue in Medical Beds as of 2021)
Table 21. Medical Beds Manufacturing Base Distribution and Headquarters
Table 22. Manufacturers Medical Beds Product Offered
Table 23. Date of Manufacturers Enter into Medical Beds Market
Table 24. Mergers & Acquisitions, Expansion Plans
Table 25. Global Medical Beds Sales by Type (2017-2022) & (K Units)
Table 26. Global Medical Beds Sales by Type (2023-2028) & (K Units)
Table 27. Global Medical Beds Sales Share by Type (2017-2022)
Table 28. Global Medical Beds Sales Share by Type (2023-2028)
Table 29. Global Medical Beds Revenue by Type (2017-2022) & (US$ Million)
Table 30. Global Medical Beds Revenue by Type (2023-2028) & (US$ Million)
Table 31. Global Medical Beds Revenue Share by Type (2017-2022)
Table 32. Global Medical Beds Revenue Share by Type (2023-2028)
Table 33. Medical Beds Price by Type (2017-2022) & (USD/Unit)
Table 34. Global Medical Beds Price Forecast by Type (2023-2028) & (USD/Unit)
Table 35. Global Medical Beds Sales by Application (2017-2022) & (K Units)
Table 36. Global Medical Beds Sales by Application (2023-2028) & (K Units)
Table 37. Global Medical Beds Sales Share by Application (2017-2022)
Table 38. Global Medical Beds Sales Share by Application (2023-2028)
Table 39. Global Medical Beds Revenue by Application (2017-2022) & (US$ Million)
Table 40. Global Medical Beds Revenue by Application (2023-2028) & (US$ Million)
Table 41. Global Medical Beds Revenue Share by Application (2017-2022)
Table 42. Global Medical Beds Revenue Share by Application (2023-2028)
Table 43. Medical Beds Price by Application (2017-2022) & (USD/Unit)
Table 44. Global Medical Beds Price Forecast by Application (2023-2028) & (USD/Unit)
Table 45. North America Medical Beds Sales by Type (2017-2022) & (K Units)
Table 46. North America Medical Beds Sales by Type (2023-2028) & (K Units)
Table 47. North America Medical Beds Revenue by Type (2017-2022) & (US$ Million)
Table 48. North America Medical Beds Revenue by Type (2023-2028) & (US$ Million)
Table 49. North America Medical Beds Sales by Application (2017-2022) & (K Units)
Table 50. North America Medical Beds Sales by Application (2023-2028) & (K Units)
Table 51. North America Medical Beds Revenue by Application (2017-2022) & (US$ Million)
Table 52. North America Medical Beds Revenue by Application (2023-2028) & (US$ Million)
Table 53. North America Medical Beds Sales by Country (2017-2022) & (K Units)
Table 54. North America Medical Beds Sales by Country (2023-2028) & (K Units)
Table 55. North America Medical Beds Revenue by Country (2017-2022) & (US$ Million)
Table 56. North America Medical Beds Revenue by Country (2023-2028) & (US$ Million)
Table 57. Europe Medical Beds Sales by Type (2017-2022) & (K Units)
Table 58. Europe Medical Beds Sales by Type (2023-2028) & (K Units)
Table 59. Europe Medical Beds Revenue by Type (2017-2022) & (US$ Million)
Table 60. Europe Medical Beds Revenue by Type (2023-2028) & (US$ Million)
Table 61. Europe Medical Beds Sales by Application (2017-2022) & (K Units)
Table 62. Europe Medical Beds Sales by Application (2023-2028) & (K Units)
Table 63. Europe Medical Beds Revenue by Application (2017-2022) & (US$ Million)
Table 64. Europe Medical Beds Revenue by Application (2023-2028) & (US$ Million)
Table 65. Europe Medical Beds Sales by Country (2017-2022) & (K Units)
Table 66. Europe Medical Beds Sales by Country (2023-2028) & (K Units)
Table 67. Europe Medical Beds Revenue by Country (2017-2022) & (US$ Million)
Table 68. Europe Medical Beds Revenue by Country (2023-2028) & (US$ Million)
Table 69. Asia Pacific Medical Beds Sales by Type (2017-2022) & (K Units)
Table 70. Asia Pacific Medical Beds Sales by Type (2023-2028) & (K Units)
Table 71. Asia Pacific Medical Beds Revenue by Type (2017-2022) & (US$ Million)
Table 72. Asia Pacific Medical Beds Revenue by Type (2023-2028) & (US$ Million)
Table 73. Asia Pacific Medical Beds Sales by Application (2017-2022) & (K Units)
Table 74. Asia Pacific Medical Beds Sales by Application (2023-2028) & (K Units)
Table 75. Asia Pacific Medical Beds Revenue by Application (2017-2022) & (US$ Million)
Table 76. Asia Pacific Medical Beds Revenue by Application (2023-2028) & (US$ Million)
Table 77. Asia Pacific Medical Beds Sales by Region (2017-2022) & (K Units)
Table 78. Asia Pacific Medical Beds Sales by Region (2023-2028) & (K Units)
Table 79. Asia Pacific Medical Beds Revenue by Region (2017-2022) & (US$ Million)
Table 80. Asia Pacific Medical Beds Revenue by Region (2023-2028) & (US$ Million)
Table 81. Latin America Medical Beds Sales by Type (2017-2022) & (K Units)
Table 82. Latin America Medical Beds Sales by Type (2023-2028) & (K Units)
Table 83. Latin America Medical Beds Revenue by Type (2017-2022) & (US$ Million)
Table 84. Latin America Medical Beds Revenue by Type (2023-2028) & (US$ Million)
Table 85. Latin America Medical Beds Sales by Application (2017-2022) & (K Units)
Table 86. Latin America Medical Beds Sales by Application (2023-2028) & (K Units)
Table 87. Latin America Medical Beds Revenue by Application (2017-2022) & (US$ Million)
Table 88. Latin America Medical Beds Revenue by Application (2023-2028) & (US$ Million)
Table 89. Latin America Medical Beds Sales by Country (2017-2022) & (K Units)
Table 90. Latin America Medical Beds Sales by Country (2023-2028) & (K Units)
Table 91. Latin America Medical Beds Revenue by Country (2017-2022) & (US$ Million)
Table 92. Latin America Medical Beds Revenue by Country (2023-2028) & (US$ Million)
Table 93. Middle East and Africa Medical Beds Sales by Type (2017-2022) & (K Units)
Table 94. Middle East and Africa Medical Beds Sales by Type (2023-2028) & (K Units)
Table 95. Middle East and Africa Medical Beds Revenue by Type (2017-2022) & (US$ Million)
Table 96. Middle East and Africa Medical Beds Revenue by Type (2023-2028) & (US$ Million)
Table 97. Middle East and Africa Medical Beds Sales by Application (2017-2022) & (K Units)
Table 98. Middle East and Africa Medical Beds Sales by Application (2023-2028) & (K Units)
Table 99. Middle East and Africa Medical Beds Revenue by Application (2017-2022) & (US$ Million)
Table 100. Middle East and Africa Medical Beds Revenue by Application (2023-2028) & (US$ Million)
Table 101. Middle East and Africa Medical Beds Sales by Country (2017-2022) & (K Units)
Table 102. Middle East and Africa Medical Beds Sales by Country (2023-2028) & (K Units)
Table 103. Middle East and Africa Medical Beds Revenue by Country (2017-2022) & (US$ Million)
Table 104. Middle East and Africa Medical Beds Revenue by Country (2023-2028) & (US$ Million)
Table 105. Hill-Rom Corporation Information
Table 106. Hill-Rom Description and Major Businesses
Table 107. Hill-Rom Medical Beds Sales (K Units), Revenue (US$ Million), Price (USD/Unit) and Gross Margin (2017-2022)
Table 108. Hill-Rom Medical Beds Product Model Numbers, Pictures, Descriptions and Specifications
Table 109. Hill-Rom Recent Developments
Table 110. Stryker Corporation Information
Table 111. Stryker Description and Major Businesses
Table 112. Stryker Medical Beds Sales (K Units), Revenue (US$ Million), Price (USD/Unit) and Gross Margin (2017-2022)
Table 113. Stryker Medical Beds Product Model Numbers, Pictures, Descriptions and Specifications
Table 114. Stryker Recent Developments
Table 115. Paramount Bed Corporation Information
Table 116. Paramount Bed Description and Major Businesses
Table 117. Paramount Bed Medical Beds Sales (K Units), Revenue (US$ Million), Price (USD/Unit) and Gross Margin (2017-2022)
Table 118. Paramount Bed Medical Beds Product Model Numbers, Pictures, Descriptions and Specifications
Table 119. Paramount Bed Recent Developments
Table 120. Linet Group Corporation Information
Table 121. Linet Group Description and Major Businesses
Table 122. Linet Group Medical Beds Sales (K Units), Revenue (US$ Million), Price (USD/Unit) and Gross Margin (2017-2022)
Table 123. Linet Group Medical Beds Product Model Numbers, Pictures, Descriptions and Specifications
Table 124. Linet Group Recent Developments
Table 125. Arjo Corporation Information
Table 126. Arjo Description and Major Businesses
Table 127. Arjo Medical Beds Sales (K Units), Revenue (US$ Million), Price (USD/Unit) and Gross Margin (2017-2022)
Table 128. Arjo Medical Beds Product Model Numbers, Pictures, Descriptions and Specifications
Table 129. Arjo Recent Developments
Table 130. Invacare Corporation Corporation Information
Table 131. Invacare Corporation Description and Major Businesses
Table 132. Invacare Corporation Medical Beds Sales (K Units), Revenue (US$ Million), Price (USD/Unit) and Gross Margin (2017-2022)
Table 133. Invacare Corporation Medical Beds Product Model Numbers, Pictures, Descriptions and Specifications
Table 134. Invacare Corporation Recent Developments
Table 135. Hopefull Medical Equipment Corporation Information
Table 136. Hopefull Medical Equipment Description and Major Businesses
Table 137. Hopefull Medical Equipment Medical Beds Sales (K Units), Revenue (US$ Million), Price (USD/Unit) and Gross Margin (2017-2022)
Table 138. Hopefull Medical Equipment Medical Beds Product Model Numbers, Pictures, Descriptions and Specifications
Table 139. Hopefull Medical Equipment Recent Developments
Table 140. Stiegelmeyer Corporation Information
Table 141. Stiegelmeyer Description and Major Businesses
Table 142. Stiegelmeyer Medical Beds Sales (K Units), Revenue (US$ Million), Price (USD/Unit) and Gross Margin (2017-2022)
Table 143. Stiegelmeyer Medical Beds Product Model Numbers, Pictures, Descriptions and Specifications
Table 144. Stiegelmeyer Recent Developments
Table 145. Joerns Healthcare Corporation Information
Table 146. Joerns Healthcare Description and Major Businesses
Table 147. Joerns Healthcare Medical Beds Sales (K Units), Revenue (US$ Million), Price (USD/Unit) and Gross Margin (2017-2022)
Table 148. Joerns Healthcare Medical Beds Product Model Numbers, Pictures, Descriptions and Specifications
Table 149. Joerns Healthcare Recent Developments
Table 150. Hebei Pukang Medical Instruments Corporation Information
Table 151. Hebei Pukang Medical Instruments Description and Major Businesses
Table 152. Hebei Pukang Medical Instruments Medical Beds Sales (K Units), Revenue (US$ Million), Price (USD/Unit) and Gross Margin (2017-2022)
Table 153. Hebei Pukang Medical Instruments Medical Beds Product Model Numbers, Pictures, Descriptions and Specifications
Table 154. Hebei Pukang Medical Instruments Recent Developments
Table 155. Malvestio Corporation Information
Table 156. Malvestio Description and Major Businesses
Table 157. Malvestio Medical Beds Sales (K Units), Revenue (US$ Million), Price (USD/Unit) and Gross Margin (2017-2022)
Table 158. Malvestio Medical Beds Product Model Numbers, Pictures, Descriptions and Specifications
Table 159. Malvestio Recent Developments
Table 160. Völker Corporation Information
Table 161. Völker Description and Major Businesses
Table 162. Völker Medical Beds Sales (K Units), Revenue (US$ Million), Price (USD/Unit) and Gross Margin (2017-2022)
Table 163. Völker Medical Beds Product Model Numbers, Pictures, Descriptions and Specifications
Table 164. Völker Recent Developments
Table 165. Pardo Corporation Information
Table 166. Pardo Description and Major Businesses
Table 167. Pardo Medical Beds Sales (K Units), Revenue (US$ Million), Price (USD/Unit) and Gross Margin (2017-2022)
Table 168. Pardo Medical Beds Product Model Numbers, Pictures, Descriptions and Specifications
Table 169. Pardo Recent Developments
Table 170. Hengshui Hengzekang Medical Equipment Corporation Information
Table 171. Hengshui Hengzekang Medical Equipment Description and Major Businesses
Table 172. Hengshui Hengzekang Medical Equipment Medical Beds Sales (K Units), Revenue (US$ Million), Price (USD/Unit) and Gross Margin (2017-2022)
Table 173. Hengshui Hengzekang Medical Equipment Medical Beds Product Model Numbers, Pictures, Descriptions and Specifications
Table 174. Hengshui Hengzekang Medical Equipment Recent Developments
Table 175. Drive Medical Corporation Information
Table 176. Drive Medical Description and Major Businesses
Table 177. Drive Medical Medical Beds Sales (K Units), Revenue (US$ Million), Price (USD/Unit) and Gross Margin (2017-2022)
Table 178. Drive Medical Medical Beds Product Model Numbers, Pictures, Descriptions and Specifications
Table 179. Drive Medical Recent Developments
Table 180. Guangzhou Kangshen Science&Technology Corporation Information
Table 181. Guangzhou Kangshen Science&Technology Description and Major Businesses
Table 182. Guangzhou Kangshen Science&Technology Medical Beds Sales (K Units), Revenue (US$ Million), Price (USD/Unit) and Gross Margin (2017-2022)
Table 183. Guangzhou Kangshen Science&Technology Medical Beds Product Model Numbers, Pictures, Descriptions and Specifications
Table 184. Guangzhou Kangshen Science&Technology Recent Developments
Table 185. Changzhou KC-Harvest Medical Equipment Corporation Information
Table 186. Changzhou KC-Harvest Medical Equipment Description and Major Businesses
Table 187. Changzhou KC-Harvest Medical Equipment Medical Beds Sales (K Units), Revenue (US$ Million), Price (USD/Unit) and Gross Margin (2017-2022)
Table 188. Changzhou KC-Harvest Medical Equipment Medical Beds Product Model Numbers, Pictures, Descriptions and Specifications
Table 189. Changzhou KC-Harvest Medical Equipment Recent Developments
Table 190. Haelvoet Corporation Information
Table 191. Haelvoet Description and Major Businesses
Table 192. Haelvoet Medical Beds Sales (K Units), Revenue (US$ Million), Price (USD/Unit) and Gross Margin (2017-2022)
Table 193. Haelvoet Medical Beds Product Model Numbers, Pictures, Descriptions and Specifications
Table 194. Haelvoet Recent Developments
Table 195. Jiangsu Yongfa Medical Equipment Technology Corporation Information
Table 196. Jiangsu Yongfa Medical Equipment Technology Description and Major Businesses
Table 197. Jiangsu Yongfa Medical Equipment Technology Medical Beds Sales (K Units), Revenue (US$ Million), Price (USD/Unit) and Gross Margin (2017-2022)
Table 198. Jiangsu Yongfa Medical Equipment Technology Medical Beds Product Model Numbers, Pictures, Descriptions and Specifications
Table 199. Jiangsu Yongfa Medical Equipment Technology Recent Developments
Table 200. Kanghui Medical Technology(Suzhou) Corporation Information
Table 201. Kanghui Medical Technology(Suzhou) Description and Major Businesses
Table 202. Kanghui Medical Technology(Suzhou) Medical Beds Sales (K Units), Revenue (US$ Million), Price (USD/Unit) and Gross Margin (2017-2022)
Table 203. Kanghui Medical Technology(Suzhou) Medical Beds Product Model Numbers, Pictures, Descriptions and Specifications
Table 204. Kanghui Medical Technology(Suzhou) Recent Developments
Table 205. Key Raw Materials Lists
Table 206. Raw Materials Key Suppliers Lists
Table 207. Medical Beds Distributors List
Table 208. Medical Beds Customers List
Table 209. Medical Beds Market Trends
Table 210. Medical Beds Market Drivers
Table 211. Medical Beds Market Challenges
Table 212. Medical Beds Market Restraints
Table 213. Research Programs/Design for This Report
Table 214. Key Data Information from Secondary Sources
Table 215. Key Data Information from Primary Sources
List of Figures
Figure 1. Medical Beds Product Picture
Figure 3. Global Medical Beds Market Share by Type in 2021 & 2028
Figure 3. Manual Medical Bed Product Picture
Figure 4. Electric Medical Bed Product Picture
Figure 5. Global Medical Beds Market Share by Application in 2021 & 2028
Figure 6. Hospital
Figure 7. Nursing Home
Figure 8. Home Care
Figure 9. Other
Figure 10. Medical Beds Report Years Considered
Figure 11. Global Medical Beds Sales 2017-2028 (K Units)
Figure 12. Global Medical Beds Revenue, (US$ Million), 2017 VS 2021 VS 2028
Figure 13. Global Medical Beds Revenue 2017-2028 (US$ Million)
Figure 14. Global Medical Beds Revenue Market Share by Region in Percentage: 2021 Versus 2028
Figure 15. Global Medical Beds Sales Market Share by Region (2017-2022)
Figure 16. Global Medical Beds Sales Market Share by Region (2023-2028)
Figure 17. North America Medical Beds Sales YoY (2017-2028) & (K Units)
Figure 18. North America Medical Beds Revenue YoY (2017-2028) & (US$ Million)
Figure 19. Europe Medical Beds Sales YoY (2017-2028) & (K Units)
Figure 20. Europe Medical Beds Revenue YoY (2017-2028) & (US$ Million)
Figure 21. Asia-Pacific Medical Beds Sales YoY (2017-2028) & (K Units)
Figure 22. Asia-Pacific Medical Beds Revenue YoY (2017-2028) & (US$ Million)
Figure 23. Latin America Medical Beds Sales YoY (2017-2028) & (K Units)
Figure 24. Latin America Medical Beds Revenue YoY (2017-2028) & (US$ Million)
Figure 25. Middle East & Africa Medical Beds Sales YoY (2017-2028) & (K Units)
Figure 26. Middle East & Africa Medical Beds Revenue YoY (2017-2028) & (US$ Million)
Figure 27. The Medical Beds Market Share of Top 10 and Top 5 Largest Manufacturers Around the World in 2021
Figure 28. The Top 5 and 10 Largest Manufacturers of Medical Beds in the World: Market Share by Medical Beds Revenue in 2021
Figure 29. Global Medical Beds Market Share by Company Type (Tier 1, Tier 2, and Tier 3): 2017 VS 2021
Figure 30. Global Medical Beds Sales Market Share by Type (2017-2028)
Figure 31. Global Medical Beds Revenue Market Share by Type (2017-2028)
Figure 32. Global Medical Beds Sales Market Share by Application (2017-2028)
Figure 33. Global Medical Beds Revenue Market Share by Application (2017-2028)
Figure 34. North America Medical Beds Sales Market Share by Type (2017-2028)
Figure 35. North America Medical Beds Revenue Market Share by Type (2017-2028)
Figure 36. North America Medical Beds Sales Market Share by Application (2017-2028)
Figure 37. North America Medical Beds Revenue Market Share by Application (2017-2028)
Figure 38. North America Medical Beds Sales Share by Country (2017-2028)
Figure 39. North America Medical Beds Revenue Share by Country (2017-2028)
Figure 40. U.S. Medical Beds Revenue (2017-2028) & (US$ Million)
Figure 41. Canada Medical Beds Revenue (2017-2028) & (US$ Million)
Figure 42. Europe Medical Beds Sales Market Share by Type (2017-2028)
Figure 43. Europe Medical Beds Revenue Market Share by Type (2017-2028)
Figure 44. Europe Medical Beds Sales Market Share by Application (2017-2028)
Figure 45. Europe Medical Beds Revenue Market Share by Application (2017-2028)
Figure 46. Europe Medical Beds Sales Share by Country (2017-2028)
Figure 47. Europe Medical Beds Revenue Share by Country (2017-2028)
Figure 48. Germany Medical Beds Revenue (2017-2028) & (US$ Million)
Figure 49. France Medical Beds Revenue (2017-2028) & (US$ Million)
Figure 50. U.K. Medical Beds Revenue (2017-2028) & (US$ Million)
Figure 51. Italy Medical Beds Revenue (2017-2028) & (US$ Million)
Figure 52. Russia Medical Beds Revenue (2017-2028) & (US$ Million)
Figure 53. Asia Pacific Medical Beds Sales Market Share by Type (2017-2028)
Figure 54. Asia Pacific Medical Beds Revenue Market Share by Type (2017-2028)
Figure 55. Asia Pacific Medical Beds Sales Market Share by Application (2017-2028)
Figure 56. Asia Pacific Medical Beds Revenue Market Share by Application (2017-2028)
Figure 57. Asia Pacific Medical Beds Sales Share by Region (2017-2028)
Figure 58. Asia Pacific Medical Beds Revenue Share by Region (2017-2028)
Figure 59. China Medical Beds Revenue (2017-2028) & (US$ Million)
Figure 60. Japan Medical Beds Revenue (2017-2028) & (US$ Million)
Figure 61. South Korea Medical Beds Revenue (2017-2028) & (US$ Million)
Figure 62. India Medical Beds Revenue (2017-2028) & (US$ Million)
Figure 63. Australia Medical Beds Revenue (2017-2028) & (US$ Million)
Figure 64. Taiwan Medical Beds Revenue (2017-2028) & (US$ Million)
Figure 65. Indonesia Medical Beds Revenue (2017-2028) & (US$ Million)
Figure 66. Thailand Medical Beds Revenue (2017-2028) & (US$ Million)
Figure 67. Malaysia Medical Beds Revenue (2017-2028) & (US$ Million)
Figure 68. Philippines Medical Beds Revenue (2017-2028) & (US$ Million)
Figure 69. Latin America Medical Beds Sales Market Share by Type (2017-2028)
Figure 70. Latin America Medical Beds Revenue Market Share by Type (2017-2028)
Figure 71. Latin America Medical Beds Sales Market Share by Application (2017-2028)
Figure 72. Latin America Medical Beds Revenue Market Share by Application (2017-2028)
Figure 73. Latin America Medical Beds Sales Share by Country (2017-2028)
Figure 74. Latin America Medical Beds Revenue Share by Country (2017-2028)
Figure 75. Mexico Medical Beds Revenue (2017-2028) & (US$ Million)
Figure 76. Brazil Medical Beds Revenue (2017-2028) & (US$ Million)
Figure 77. Argentina Medical Beds Revenue (2017-2028) & (US$ Million)
Figure 78. Middle East and Africa Medical Beds Sales Market Share by Type (2017-2028)
Figure 79. Middle East and Africa Medical Beds Revenue Market Share by Type (2017-2028)
Figure 80. Middle East and Africa Medical Beds Sales Market Share by Application (2017-2028)
Figure 81. Middle East and Africa Medical Beds Revenue Market Share by Application (2017-2028)
Figure 82. Middle East and Africa Medical Beds Sales Share by Country (2017-2028)
Figure 83. Middle East and Africa Medical Beds Revenue Share by Country (2017-2028)
Figure 84. Turkey Medical Beds Revenue (2017-2028) & (US$ Million)
Figure 85. Saudi Arabia Medical Beds Revenue (2017-2028) & (US$ Million)
Figure 86. UAE Medical Beds Revenue (2017-2028) & (US$ Million)
Figure 87. Medical Beds Value Chain
Figure 88. Medical Beds Production Process
Figure 89. Channels of Distribution
Figure 90. Distributors Profiles
Figure 91. Bottom-up and Top-down Approaches for This Report
Figure 92. Data Triangulation
Figure 93. Key Executives Interviewed
$4900
$7350
$9800
HAVE A QUERY?
OUR CUSTOMER

SIMILAR REPORTS