0
U.S. (TOLL FREE)
+1 (315) 215-3225
Automative

0
U.S. (TOLL FREE)
+1 (315) 215-3225
Global Lancets Market Size, Manufacturers, Supply Chain, Sales Channel and Clients, 2025-2031
Published Date: June 2025
|
Report Code: QYRE-Auto-23G2383
Home | Market Reports | Health| Pharmacy
Global Lancets Market Insights Forecast to 2026
BUY CHAPTERS

Global Lancets Market Size, Manufacturers, Supply Chain, Sales Channel and Clients, 2025-2031

Code: QYRE-Auto-23G2383
Report
June 2025
Pages:197
QYResearch
Buy Now with 15% Discount
DESCRIPTION
TABLE OF CONTENT
TABLES & FIGURES

Lancets Market Size

In 2024, the global market size of Lancets was estimated to be worth US$ 1674 million and is forecast to reach approximately US$ 2288 million by 2031 with a CAGR of 4.6% during the forecast period 2025-2031.

Lancets Market

Lancets Market

Lancets are a pricking needle used to obtain drops of blood for testing. Lancets are being increasingly used by patients affected by cardiovascular and endocrine-related complications. Lancets are designed to only be used once, and then disposed of in a safe way. These devices are being used for cholesterol and glucose tests, heelstick screening tests or phenylketonuria (PKU) tests in newborns, as well as for severely burned or scarred emergency patients, extremely obese patients and thrombotic-tendency patients.
Market Drivers:
Growing prevalence of chronic diseases: The rise in chronic conditions like diabetes, which require regular blood glucose monitoring, is a significant driver for lancet demand. As the number of diabetes patients increases globally, the need for lancets continues to grow.
Technological advancements in lancets: Innovations such as ultra-thin needles, painless lancet designs, and easy-to-use lancet devices improve user experience, making blood sampling more comfortable and encouraging more frequent use.
Increase in home-based healthcare: The trend toward home healthcare and self-monitoring for various conditions, especially diabetes, has driven the use of lancets. This allows patients to monitor their health in a more convenient and cost-effective way, increasing the market for these devices.
Aging population: The growing elderly population is more prone to chronic diseases like diabetes, requiring regular blood monitoring. This demographic shift is a major factor pushing the demand for lancets and other monitoring devices.
Rising awareness of preventive healthcare: Increasing awareness of the importance of regular health monitoring, especially for managing conditions like diabetes, has led to higher adoption of lancets for routine blood tests and glucose monitoring.
Market Challenges:
Competition from alternative technologies: Non-invasive blood glucose monitoring methods (such as continuous glucose monitors or sensor-based systems) are gaining traction, potentially reducing the reliance on traditional lancets for blood sampling.
High recurring costs for patients: Lancets are single-use devices, and the recurring cost for people who need frequent testing can become a financial burden, particularly in low-income regions or for uninsured patients, limiting market growth.
Infection risks: Improper or repeated use of lancets can lead to infections, particularly if they are not disposed of properly or if reused by mistake, which poses a health risk and deters their use.
Environmental concerns: Lancets contribute to medical waste, as they are disposable devices, raising concerns about environmental impact. This could lead to regulatory pressures or a shift toward more sustainable alternatives.
Regulatory compliance and approval hurdles: The lancet market is subject to stringent regulations and approval processes from health authorities. This can slow down the introduction of new products and innovations, delaying their availability in the market.
The classification of Lancets includes Ordinary Lancets and Safety Lancets. In 2023, Ordinary Lancets accounted for a share of 61.81% in the global Lancets market. With several hospitals and healthcare facilities converting to safety lancets, this market share is poised for declined. Americas is the largest consumption place, with a consumption market share nearly 40 % in 2022. Following Americas, Europe is the second largest consumption place with the consumption market share of 30 %.

Report Scope

This report aims to provide a comprehensive presentation of the global market for Lancets, with both quantitative and qualitative analysis, to help readers develop business/growth strategies, assess the market competitive situation, analyze their position in the current marketplace, and make informed business decisions regarding Lancets.
The Lancets market size, estimations, and forecasts are provided in terms of sales volume (K Units) and revenue ($ millions), considering 2024 as the base year, with history and forecast data for the period from 2020 to 2031. This report segments the global Lancets market comprehensively. Regional market sizes, concerning products by Type, by Application, and by players, are also provided.
For a more in-depth understanding of the market, the report provides profiles of the competitive landscape, key competitors, and their respective market ranks. The report also discusses technological trends and new product developments.
The report will help the Lancets manufacturers, new entrants, and industry chain related companies in this market with information on the revenues, sales volume, and average price for the overall market and the sub-segments across the different segments, by company, by Type, by Application, and regions.

Scope of Lancets Market Report

Report Metric Details
Report Name Lancets Market
Forecasted market size in 2031 approximately US$ 2288 million
CAGR 4.6%
Forecasted years 2025 - 2031
Segment by Type
  • Safety Lancets
  • Ordinary Lancets
Segment by Application
  • Children's Fingertip Blood Tests
  • Glucose Tests
  • Others
By Region
  • North America (United States, Canada)
  • Europe (Germany, France, UK, Italy, Russia) Rest of Europe
  • Nordic Countries
  • Asia-Pacific (China, Japan, South Korea)
  • Southeast Asia (India, Australia)
  • Rest of Asia
  • Latin America (Mexico, Brazil)
  • Rest of Latin America
  • Middle East & Africa (Turkey, Saudi Arabia, UAE, Rest of MEA)
By Company Roche, Lifescan, BD, Ascensia, Abbott, B. Braun, ARKRAY, Terumo, I-SENS, Nipro, Cardinal Health, ICU Medical, Sarstedt, Sinocare, Yicheng, Yuwell, Greiner Bio One, Guangzhou iCare Medical, Shandong Lianfa, Tianjin Huahong, Owen Mumford, HemoCue, HTL-STREFA, UltiMed, SteriLance Medical
Forecast units USD million in value
Report coverage Revenue and volume forecast, company share, competitive landscape, growth factors and trends

Chapter Outline

  • Chapter 1: Introduces the report scope of the report, executive summary of different market segments (by Type and by Application, etc), including the market size of each market segment, future development potential, and so on. It offers a high-level view of the current state of the market and its likely evolution in the short to mid-term, and long term.
  • Chapter 2: Sales (consumption), revenue of Lancets in global and regional level. It provides a quantitative analysis of the market size and development potential of each region and its main countries and introduces the market development, future development prospects, market space of each country in the world.
  • Chapter 3: Detailed analysis of Lancets manufacturers competitive landscape, price, sales, revenue, market share and industry ranking, latest development plan, merger, and acquisition information, etc.
  • Chapter 4: Provides profiles of key manufacturers, introducing the basic situation of the main companies in the market in detail, including product descriptions and specifications, Lancets sales, revenue, price, gross margin, sales by region, by Type, by Application, and recent development, etc.
  • Chapter 5: Provides the analysis of various market segments by Type, covering the sales, revenue, average price, and development potential of each market segment, to help readers find the blue ocean market in different market segments.
  • Chapter 6: Provides the analysis of various market segments by Application, covering the sales, revenue, average price, and development potential of each market segment, to help readers find the blue ocean market in different downstream markets.
  • Chapter 7: North America by Type, by Application and by country, sales, and revenue for each segment.
  • Chapter 8: APAC by Type, by Application and by country, sales, and revenue for each segment.
  • Chapter 9: Europe by Type, by Application and by country, sales, and revenue for each segment.
  • Chapter 10: Latin America by Type, by Application and by country, sales, and revenue for each segment.
  • Chapter 11: Middle East and Africa by Type, by Application and by country, sales, and revenue for each segment.
  • Chapter 12: Analysis of industrial chain, sales channel, key raw materials, distributors, and customers.
  • Chapter 13: Introduces the market dynamics, latest developments of the market, the driving factors and restrictive factors of the market, the challenges and risks faced by manufacturers in the industry, and the analysis of relevant policies in the industry.
  • Chapter 14: Research Findings and Conclusion.

FAQ for this report

What is the Lancets Market size in 2031?

Ans: The Lancets Market size in 2031 will be approximately US$ 2288 million.

What is the Lancets Market share by type?

Ans: In 2023, Ordinary Lancets accounted for a share of 61.81% in the global Lancets market.

What is the Lancets Market share by region?

Ans: Americas is the largest consumption place, with a consumption market share nearly 40 % in 2022.

Who are the main players in the Lancets Market report?

Ans: The main players in the Lancets Market are Roche, Lifescan, BD, Ascensia, Abbott, B. Braun, ARKRAY, Terumo, I-SENS, Nipro, Cardinal Health, ICU Medical, Sarstedt, Sinocare, Yicheng, Yuwell, Greiner Bio One, Guangzhou iCare Medical, Shandong Lianfa, Tianjin Huahong, Owen Mumford, HemoCue, HTL-STREFA, UltiMed, SteriLance Medical

What are the Application segmentation covered in the Lancets Market report?

Ans: The Applications covered in the Lancets Market report are Children's Fingertip Blood Tests, Glucose Tests, Others

What are the Type segmentation covered in the Lancets Market report?

Ans: The Types covered in the Lancets Market report are Safety Lancets, Ordinary Lancets

Recommended Reports

Blood Glucose Devices

Lancets and Sampling

Continuous & Non-Invasive Monitoring

1 Study Coverage
1.1 Lancets Product Introduction
1.2 Market by Type
1.2.1 Global Lancets Market Size Growth Rate by Type (2020 VS 2024 VS 2031)
1.2.2 Safety Lancets
1.2.3 Ordinary Lancets
1.3 Market by Application
1.3.1 Global Lancets Market Size Growth Rate by Application (2020 VS 2024 VS 2031)
1.3.2 Children's Fingertip Blood Tests
1.3.3 Glucose Tests
1.3.4 Others
1.4 Study Objectives
1.5 Years Considered
2 Executive Summary
2.1 Global Lancets Market Size Estimates and Forecasts
2.1.1 Global Lancets Revenue 2020-2031
2.1.2 Global Lancets Sales 2020-2031
2.2 Lancets Market Size by Region: 2024 Versus 2031
2.3 Lancets Sales by Region (2020-2031)
2.3.1 Global Lancets Sales by Region: 2020-2025
2.3.2 Global Lancets Sales Forecast by Region (2026-2031)
2.3.3 Global Lancets Sales Market Share by Region (2020-2031)
2.4 Lancets Market Estimates and Projections by Region (2026-2031)
2.4.1 Global Lancets Revenue by Region: 2020-2025
2.4.2 Global Lancets Revenue Forecast by Region (2026-2031)
2.4.3 Global Lancets Revenue Market Share by Region (2020-2031)
3 Market Segments
3.1 Breakdown Data by Type
3.1.1 Global Lancets Sales by Type (2020-2031)
3.1.1.1 Global Lancets Sales Volume by Type (2020-2031)
3.1.1.2 Global Lancets Sales Market Share by Type (2020-2031)
3.1.2 Global Lancets Revenue by Type (2020-2031)
3.1.2.1 Global Lancets Revenue by Type (2020-2031)
3.1.2.2 Global Lancets Revenue Market Share by Type (2020-2031)
3.1.3 Lancets Average Selling Price (ASP) by Type (2020-2031)
3.2 Breakdown Data by Application
3.2.1 Global Lancets Sales by Application (2020-2031)
3.2.1.1 Global Lancets Sales Volume by Application (2020-2031)
3.2.1.2 Global Lancets Sales Market Share by Application (2020-2031)
3.2.2 Global Lancets Revenue by Application (2020-2031)
3.2.2.1 Global Lancets Revenue by Application (2020-2031)
3.2.2.2 Global Lancets Revenue Market Share by Application (2020-2031)
3.2.3 Lancets Average Selling Price (ASP) by Application (2020-2031)
3.3 by Type and by Application Crossing Analysis
3.3.1 Safety Lancets of Lancets Revenue Market Share by Application
3.3.2 Ordinary Lancets of Lancets Revenue Market Share by Application
4 Global Lancets by Manufacturers
4.1 Global Top Lancets Manufacturers by Sales (2020-2025)
4.1.1 Global Lancets Sales by Manufacturer (2020-2025)
4.1.2 Global Lancets Sales Market Share by Manufacturer (2020-2025)
4.2 Global Top Lancets Manufacturers by Revenue (2020-2025)
4.2.1 Global Lancets Revenue by Manufacturer (2020-2025)
4.2.2 Global Lancets Revenue Share by Manufacturer (2020-2025)
4.3 Global Lancets Price by Manufacturer (2020-2025)
4.4 Competitive Landscape
4.4.1 Key Lancets Manufacturers Covered: Ranking by Revenue
4.4.2 Global Lancets Market Concentration Ratio (CR5 and HHI) & (2020-2025)
4.4.3 Global Lancets Market Share by Company Type (Tier 1, Tier 2, and Tier 3)
4.5 Global Lancets Manufacturing Base Distribution, Product Type
4.5.1 Lancets Manufacturers Manufacturing Base Distribution, Headquarters
4.5.2 Date of International Manufacturers Enter into Lancets Market
4.5.3 Manufacturers Lancets Product Type and Application
4.5.4 Safety Lancets Market Sales of Lancets by Manufacturer
4.5.5 Ordinary Lancets Market Sales of Lancets by Manufacturer
4.6 Manufacturers Mergers & Acquisitions, Expansion Plans
5 Company Profiles
5.1 Roche
5.1.1 Roche Company Information
5.1.2 Roche Description, Business Overview
5.1.3 Roche Lancets Products Offered
5.1.4 Roche Lancets Sales, Revenue and Gross Margin (2020-2025)
5.1.5 Roche Lancets Sales by Product in 2024
5.1.6 Roche Lancets Sales by Application in 2024
5.1.7 Roche Lancets Sales by Geographic Area in 2024
5.1.8 Roche Recent Developments
5.2 Lifescan
5.2.1 Lifescan Company Information
5.2.2 Lifescan Description, Business Overview
5.2.3 Lifescan Lancets Products Offered
5.2.4 Lifescan Lancets Sales, Revenue and Gross Margin (2020-2025)
5.2.5 Lifescan Lancets Sales by Product in 2024
5.2.6 Lifescan Lancets Sales by Application in 2024
5.2.7 Lifescan Lancets Sales by Geographic Area in 2024
5.2.8 Lifescan Recent Developments
5.3 BD
5.3.1 BD Company Information
5.3.2 BD Description, Business Overview
5.3.3 BD Lancets Products Offered
5.3.4 BD Lancets Sales, Revenue and Gross Margin (2020-2025)
5.3.5 BD Lancets Sales by Product in 2024
5.3.6 BD Lancets Sales by Application in 2024
5.3.7 BD Lancets Sales by Geographic Area in 2024
5.3.8 BD Recent Developments
5.4 Ascensia
5.4.1 Ascensia Company Information
5.4.2 Ascensia Description, Business Overview
5.4.3 Ascensia Lancets Products Offered
5.4.4 Ascensia Lancets Sales, Revenue and Gross Margin (2020-2025)
5.4.5 Ascensia Lancets Sales by Product in 2024
5.4.6 Ascensia Lancets Sales by Application in 2024
5.4.7 Ascensia Lancets Sales by Geographic Area in 2024
5.4.8 Ascensia Recent Developments
5.5 Abbott
5.5.1 Abbott Company Information
5.5.2 Abbott Description, Business Overview
5.5.3 Abbott Lancets Products Offered
5.5.4 Abbott Lancets Sales, Revenue and Gross Margin (2020-2025)
5.5.5 Abbott Lancets Sales by Product in 2024
5.5.6 Abbott Lancets Sales by Application in 2024
5.5.7 Abbott Lancets Sales by Geographic Area in 2024
5.5.8 Abbott Recent Developments
5.6 B. Braun
5.6.1 B. Braun Company Information
5.6.2 B. Braun Description, Business Overview
5.6.3 B. Braun Lancets Products Offered
5.6.4 B. Braun Lancets Sales, Revenue and Gross Margin (2020-2025)
5.6.5 B. Braun Lancets Sales by Product in 2024
5.6.6 B. Braun Lancets Sales by Application in 2024
5.6.7 B. Braun Lancets Sales by Geographic Area in 2024
5.6.8 B. Braun Recent Developments
5.7 ARKRAY
5.7.1 ARKRAY Company Information
5.7.2 ARKRAY Description, Business Overview
5.7.3 ARKRAY Lancets Products Offered
5.7.4 ARKRAY Lancets Sales, Revenue and Gross Margin (2020-2025)
5.7.5 ARKRAY Lancets Sales by Product in 2024
5.7.6 ARKRAY Lancets Sales by Application in 2024
5.7.7 ARKRAY Lancets Sales by Geographic Area in 2024
5.7.8 ARKRAY Recent Developments
5.8 Terumo
5.8.1 Terumo Company Information
5.8.2 Terumo Description, Business Overview
5.8.3 Terumo Lancets Products Offered
5.8.4 Terumo Lancets Sales, Revenue and Gross Margin (2020-2025)
5.8.5 Terumo Lancets Sales by Product in 2024
5.8.6 Terumo Lancets Sales by Application in 2024
5.8.7 Terumo Lancets Sales by Geographic Area in 2024
5.8.8 Terumo Recent Developments
5.9 I-SENS
5.9.1 I-SENS Company Information
5.9.2 I-SENS Description, Business Overview
5.9.3 I-SENS Lancets Products Offered
5.9.4 I-SENS Lancets Sales, Revenue and Gross Margin (2020-2025)
5.9.5 I-SENS Lancets Sales by Product in 2024
5.9.6 I-SENS Lancets Sales by Application in 2024
5.9.7 I-SENS Lancets Sales by Geographic Area in 2024
5.9.8 I-SENS Recent Developments
5.10 Nipro
5.10.1 Nipro Company Information
5.10.2 Nipro Description, Business Overview
5.10.3 Nipro Lancets Products Offered
5.10.4 Nipro Lancets Sales, Revenue and Gross Margin (2020-2025)
5.10.5 Nipro Lancets Sales by Product in 2024
5.10.6 Nipro Lancets Sales by Application in 2024
5.10.7 Nipro Lancets Sales by Geographic Area in 2024
5.10.8 Nipro Recent Developments
5.11 Cardinal Health
5.11.1 Cardinal Health Company Information
5.11.2 Cardinal Health Description, Business Overview
5.11.3 Cardinal Health Lancets Products Offered
5.11.4 Cardinal Health Lancets Sales, Revenue and Gross Margin (2020-2025)
5.11.5 Cardinal Health Lancets Sales by Product in 2024
5.11.6 Cardinal Health Lancets Sales by Application in 2024
5.11.7 Cardinal Health Lancets Sales by Geographic Area in 2024
5.11.8 Cardinal Health Recent Developments
5.12 ICU Medical
5.12.1 ICU Medical Company Information
5.12.2 ICU Medical Description, Business Overview
5.12.3 ICU Medical Lancets Products Offered
5.12.4 ICU Medical Lancets Sales, Revenue and Gross Margin (2020-2025)
5.12.5 ICU Medical Lancets Sales by Product in 2024
5.12.6 ICU Medical Lancets Sales by Application in 2024
5.12.7 ICU Medical Lancets Sales by Geographic Area in 2024
5.12.8 ICU Medical Recent Developments
5.13 Sarstedt
5.13.1 Sarstedt Company Information
5.13.2 Sarstedt Description, Business Overview
5.13.3 Sarstedt Lancets Products Offered
5.13.4 Sarstedt Lancets Sales, Revenue and Gross Margin (2020-2025)
5.13.5 Sarstedt Lancets Sales by Product in 2024
5.13.6 Sarstedt Lancets Sales by Application in 2024
5.13.7 Sarstedt Lancets Sales by Geographic Area in 2024
5.13.8 Sarstedt Recent Developments
5.14 Sinocare
5.14.1 Sinocare Company Information
5.14.2 Sinocare Description, Business Overview
5.14.3 Sinocare Lancets Products Offered
5.14.4 Sinocare Lancets Sales, Revenue and Gross Margin (2020-2025)
5.14.5 Sinocare Lancets Sales by Product in 2024
5.14.6 Sinocare Lancets Sales by Application in 2024
5.14.7 Sinocare Lancets Sales by Geographic Area in 2024
5.14.8 Sinocare Recent Developments
5.15 Yicheng
5.15.1 Yicheng Company Information
5.15.2 Yicheng Description, Business Overview
5.15.3 Yicheng Lancets Products Offered
5.15.4 Yicheng Lancets Sales, Revenue and Gross Margin (2020-2025)
5.15.5 Yicheng Lancets Sales by Product in 2024
5.15.6 Yicheng Lancets Sales by Application in 2024
5.15.7 Yicheng Lancets Sales by Geographic Area in 2024
5.15.8 Yicheng Recent Developments
5.16 Yuwell
5.16.1 Yuwell Company Information
5.16.2 Yuwell Description, Business Overview
5.16.3 Yuwell Lancets Products Offered
5.16.4 Yuwell Lancets Sales, Revenue and Gross Margin (2020-2025)
5.16.5 Yuwell Lancets Sales by Product in 2024
5.16.6 Yuwell Lancets Sales by Application in 2024
5.16.7 Yuwell Lancets Sales by Geographic Area in 2024
5.16.8 Yuwell Recent Developments
5.17 Greiner Bio One
5.17.1 Greiner Bio One Company Information
5.17.2 Greiner Bio One Description, Business Overview
5.17.3 Greiner Bio One Lancets Products Offered
5.17.4 Greiner Bio One Lancets Sales, Revenue and Gross Margin (2020-2025)
5.17.5 Greiner Bio One Lancets Sales by Product in 2024
5.17.6 Greiner Bio One Lancets Sales by Application in 2024
5.17.7 Greiner Bio One Lancets Sales by Geographic Area in 2024
5.17.8 Greiner Bio One Recent Developments
5.18 Guangzhou iCare Medical
5.18.1 Guangzhou iCare Medical Company Information
5.18.2 Guangzhou iCare Medical Description, Business Overview
5.18.3 Guangzhou iCare Medical Lancets Products Offered
5.18.4 Guangzhou iCare Medical Lancets Sales, Revenue and Gross Margin (2020-2025)
5.18.5 Guangzhou iCare Medical Lancets Sales by Product in 2024
5.18.6 Guangzhou iCare Medical Lancets Sales by Application in 2024
5.18.7 Guangzhou iCare Medical Lancets Sales by Geographic Area in 2024
5.18.8 Guangzhou iCare Medical Recent Developments
5.19 Shandong Lianfa
5.19.1 Shandong Lianfa Company Information
5.19.2 Shandong Lianfa Description, Business Overview
5.19.3 Shandong Lianfa Lancets Products Offered
5.19.4 Shandong Lianfa Lancets Sales, Revenue and Gross Margin (2020-2025)
5.19.5 Shandong Lianfa Lancets Sales by Product in 2024
5.19.6 Shandong Lianfa Lancets Sales by Application in 2024
5.19.7 Shandong Lianfa Lancets Sales by Geographic Area in 2024
5.19.8 Shandong Lianfa Recent Developments
5.20 Tianjin Huahong
5.20.1 Tianjin Huahong Company Information
5.20.2 Tianjin Huahong Description, Business Overview
5.20.3 Tianjin Huahong Lancets Products Offered
5.20.4 Tianjin Huahong Lancets Sales, Revenue and Gross Margin (2020-2025)
5.20.5 Tianjin Huahong Lancets Sales by Product in 2024
5.20.6 Tianjin Huahong Lancets Sales by Application in 2024
5.20.7 Tianjin Huahong Lancets Sales by Geographic Area in 2024
5.20.8 Tianjin Huahong Recent Developments
5.21 Owen Mumford
5.21.1 Owen Mumford Company Information
5.21.2 Owen Mumford Description, Business Overview
5.21.3 Owen Mumford Lancets Products Offered
5.21.4 Owen Mumford Lancets Sales, Revenue and Gross Margin (2020-2025)
5.21.5 Owen Mumford Lancets Sales by Product in 2024
5.21.6 Owen Mumford Lancets Sales by Application in 2024
5.21.7 Owen Mumford Lancets Sales by Geographic Area in 2024
5.21.8 Owen Mumford Recent Developments
5.22 HemoCue
5.22.1 HemoCue Company Information
5.22.2 HemoCue Description, Business Overview
5.22.3 HemoCue Lancets Products Offered
5.22.4 HemoCue Lancets Sales, Revenue and Gross Margin (2020-2025)
5.22.5 HemoCue Lancets Sales by Product in 2024
5.22.6 HemoCue Lancets Sales by Application in 2024
5.22.7 HemoCue Lancets Sales by Geographic Area in 2024
5.22.8 HemoCue Recent Developments
5.23 HTL-STREFA
5.23.1 HTL-STREFA Company Information
5.23.2 HTL-STREFA Description, Business Overview
5.23.3 HTL-STREFA Lancets Products Offered
5.23.4 HTL-STREFA Lancets Sales, Revenue and Gross Margin (2020-2025)
5.23.5 HTL-STREFA Lancets Sales by Product in 2024
5.23.6 HTL-STREFA Lancets Sales by Application in 2024
5.23.7 HTL-STREFA Lancets Sales by Geographic Area in 2024
5.23.8 HTL-STREFA Recent Developments
5.24 UltiMed
5.24.1 UltiMed Company Information
5.24.2 UltiMed Description, Business Overview
5.24.3 UltiMed Lancets Products Offered
5.24.4 UltiMed Lancets Sales, Revenue and Gross Margin (2020-2025)
5.24.5 UltiMed Lancets Sales by Product in 2024
5.24.6 UltiMed Lancets Sales by Application in 2024
5.24.7 UltiMed Lancets Sales by Geographic Area in 2024
5.24.8 UltiMed Recent Developments
5.25 SteriLance Medical
5.25.1 SteriLance Medical Company Information
5.25.2 SteriLance Medical Description, Business Overview
5.25.3 SteriLance Medical Lancets Products Offered
5.25.4 SteriLance Medical Lancets Sales, Revenue and Gross Margin (2020-2025)
5.25.5 SteriLance Medical Lancets Sales by Product in 2024
5.25.6 SteriLance Medical Lancets Sales by Application in 2024
5.25.7 SteriLance Medical Lancets Sales by Geographic Area in 2024
5.25.8 SteriLance Medical Recent Developments
6 North America
6.1 North America Lancets Market Size YoY Growth 2020-2031
6.2 North America Lancets Market Facts & Figures by Country
6.2.1 North America Lancets Sales by Country (2020-2031)
6.2.2 North America Lancets Revenue by Country (2020-2031)
6.3 North America Lancets Sales by Type (2020-2025)
6.4 North America Lancets Sales by Application (2020-2025)
7 Asia-Pacific
7.1 Asia-Pacific Lancets Market Size YoY Growth 2020-2031
7.2 Asia-Pacific Lancets Market Facts & Figures by Region
7.2.1 Asia-Pacific Lancets Sales by Region (2020-2031)
7.2.2 Asia-Pacific Lancets Revenue by Region (2020-2031)
7.3 Asia-Pacific Lancets Sales by Type (2020-2025)
7.4 Asia-Pacific Lancets Sales by Application (2020-2025)
8 Europe
8.1 Europe Lancets Market Size YoY Growth 2020-2031
8.2 Europe Lancets Market Facts & Figures by Country
8.2.1 Europe Lancets Sales by Country (2020-2031)
8.2.2 Europe Lancets Revenue by Country (2020-2031)
8.3 Europe Lancets Sales by Type (2020-2025)
8.4 Europe Lancets Sales by Application (2020-2025)
9 Latin America
9.1 Latin America Lancets Market Size YoY Growth 2020-2031
9.2 Latin America Lancets Market Facts & Figures by Country
9.2.1 Latin America Lancets Sales by Country (2020-2031)
9.2.2 Latin America Lancets Revenue by Country (2020-2031)
9.3 Latin America Lancets Sales by Type (2020-2025)
9.4 Latin America Lancets Sales by Application (2020-2025)
10 Middle East and Africa
10.1 Latin America Lancets Market Size YoY Growth 2020-2031
10.2 Middle East and Africa Lancets Market Facts & Figures by Country
10.2.1 Middle East and Africa Lancets Sales by Country (2020-2031)
10.2.2 Middle East and Africa Lancets Revenue by Country (2020-2031)
10.3 Middle East and Africa Lancets Sales by Type (2020-2025)
10.4 Middle East and Africa Lancets Sales by Application (2020-2025)
11 Supply Chain and Sales Channel analysis
11.1 Lancets Supply Chain Analysis
11.2 Lancets Key Raw Materials and Upstream Suppliers
11.3 Lancets Clients Analysis
11.4 Lancets Sales Channel and Sales Model Analysis
11.4.1 Lancets Distribution Channel Analysis: Indirect Sales VS Direct Sales
11.4.2 Lancets Distribution Channel Analysis: Online Sales VS Offline Sales
11.4.3 Lancets Distributors
12 Lancets Market Dynamics
12.1 Lancets Industry Trends
12.2 Lancets Market Drivers
12.3 Lancets Market Challenges
12.4 Lancets Market Restraints
13 Research Findings and Conclusion
14 Appendix
14.1 Research Methodology
14.1.1 Methodology/Research Approach
14.1.1.1 Research Programs/Design
14.1.1.2 Market Size Estimation
14.1.1.3 Market Breakdown and Data Triangulation
14.1.2 Data Source
14.1.2.1 Secondary Sources
14.1.2.2 Primary Sources
14.2 Author Details
14.3 Disclaimer
List of Tables
 Table 1. Global Lancets Market Size Growth Rate by Type (US$ Million): 2020 VS 2024 VS 2031
 Table 2. Global Lancets Market Size Growth by Application (US$ Million): 2020 VS 2024 VS 2031
 Table 3. Global Lancets Market Size by Region (US$ Million): 2024 VS 2031
 Table 4. Global Lancets Sales by Region (2020-2025) & (K Units)
 Table 5. Global Lancets Sales Forecast by Region (2026-2031) & (K Units)
 Table 6. Global Lancets Revenue by Region (2020-2025) & (US$ Million)
 Table 7. Global Lancets Revenue Forecast by Region (2026-2031) & (US$ Million)
 Table 8. Global Lancets Sales Volume by Type (2020-2025) & (K Units)
 Table 9. Global Lancets Sales Volume by Type (2026-2031) & (K Units)
 Table 10. Global Lancets Revenue by Type (2020-2025) & (US$ Million)
 Table 11. Global Lancets Revenue Forecast by Type (2026-2031) & (US$ Million)
 Table 12. Global Lancets Sales Volume by Application (2020-2025) & (K Units)
 Table 13. Global Lancets Sales Volume by Application (2026-2031) & (K Units)
 Table 14. Global Lancets Revenue by Application (2020-2025) & (US$ Million)
 Table 15. Global Lancets Revenue by Application (2026-2031) & (US$ Million)
 Table 16. Global Lancets Sales by Manufacturer (2020-2025) & (K Units)
 Table 17. Global Lancets Sales Share by Manufacturer (2020-2025)
 Table 18. Lancets Revenue by Manufacturer (2020-2025) & (US$ Million)
 Table 19. Lancets Revenue Share by Manufacturer (2020-2025)
 Table 20. Key Manufacturers Lancets Price (2020-2025) & (USD/Unit)
 Table 21. Ranking of Global Top Lancets Manufacturers by Revenue (US$ Million) in 2024
 Table 22. Global Lancets Manufacturers Market Concentration Ratio (CR5 and HHI) & (2020-2025)
 Table 23. Global Lancets by Company Type (Tier 1, Tier 2, and Tier 3) & (based on the Revenue in Lancets as of 2024)
 Table 24. Lancets Manufacturers Manufacturing Base Distribution and Headquarters
 Table 25. Date of International Manufacturers Enter into Lancets Market
 Table 26. Manufacturers Lancets Product Type and Application
 Table 27. Manufacturers Mergers & Acquisitions, Expansion Plans
 Table 28. Roche Company Information
 Table 29. Roche Description and Business Overview
 Table 30. Roche Lancets Product
 Table 31. Roche Lancets Sales (K Units), Revenue (US$ Million), Price (USD/Unit) and Gross Margin (2020-2025)
 Table 32. Roche Sales Proportion of Lancets by Product in 2024
 Table 33. Roche Sales Proportion of Lancets by Application in 2024
 Table 34. Roche Sales Proportion of Lancets by Geographic Area in 2024
 Table 35. Roche Recent Developments
 Table 36. Lifescan Company Information
 Table 37. Lifescan Description and Business Overview
 Table 38. Lifescan Lancets Product
 Table 39. Lifescan Lancets Sales (K Units), Revenue (US$ Million), Price (USD/Unit) and Gross Margin (2020-2025)
 Table 40. Lifescan Sales Proportion of Lancets by Product in 2024
 Table 41. Lifescan Sales Proportion of Lancets by Application in 2024
 Table 42. Lifescan Sales Proportion of Lancets by Geographic Area in 2024
 Table 43. Lifescan Recent Developments
 Table 44. BD Company Information
 Table 45. BD Description and Business Overview
 Table 46. BD Lancets Product
 Table 47. BD Lancets Sales (K Units), Revenue (US$ Million), Price (USD/Unit) and Gross Margin (2020-2025)
 Table 48. BD Sales Proportion of Lancets by Product in 2024
 Table 49. BD Sales Proportion of Lancets by Application in 2024
 Table 50. BD Sales Proportion of Lancets by Geographic Area in 2024
 Table 51. BD Recent Developments
 Table 52. Ascensia Company Information
 Table 53. Ascensia Description and Business Overview
 Table 54. Ascensia Lancets Product
 Table 55. Ascensia Lancets Sales (K Units), Revenue (US$ Million), Price (USD/Unit) and Gross Margin (2020-2025)
 Table 56. Ascensia Sales Proportion of Lancets by Product in 2024
 Table 57. Ascensia Sales Proportion of Lancets by Application in 2024
 Table 58. Ascensia Sales Proportion of Lancets by Geographic Area in 2024
 Table 59. Ascensia Recent Developments
 Table 60. Abbott Company Information
 Table 61. Abbott Description and Business Overview
 Table 62. Abbott Lancets Product
 Table 63. Abbott Lancets Sales (K Units), Revenue (US$ Million), Price (USD/Unit) and Gross Margin (2020-2025)
 Table 64. Abbott Sales Proportion of Lancets by Product in 2024
 Table 65. Abbott Sales Proportion of Lancets by Application in 2024
 Table 66. Abbott Sales Proportion of Lancets by Geographic Area in 2024
 Table 67. Abbott Recent Developments
 Table 68. B. Braun Company Information
 Table 69. B. Braun Description and Business Overview
 Table 70. B. Braun Lancets Product
 Table 71. B. Braun Lancets Sales (K Units), Revenue (US$ Million), Price (USD/Unit) and Gross Margin (2020-2025)
 Table 72. B. Braun Sales Proportion of Lancets by Product in 2024
 Table 73. B. Braun Sales Proportion of Lancets by Application in 2024
 Table 74. B. Braun Sales Proportion of Lancets by Geographic Area in 2024
 Table 75. B. Braun Recent Developments
 Table 76. ARKRAY Company Information
 Table 77. ARKRAY Description and Business Overview
 Table 78. ARKRAY Lancets Product
 Table 79. ARKRAY Lancets Sales (K Units), Revenue (US$ Million), Price (USD/Unit) and Gross Margin (2020-2025)
 Table 80. ARKRAY Sales Proportion of Lancets by Product in 2024
 Table 81. ARKRAY Sales Proportion of Lancets by Application in 2024
 Table 82. ARKRAY Sales Proportion of Lancets by Geographic Area in 2024
 Table 83. ARKRAY Recent Developments
 Table 84. Terumo Company Information
 Table 85. Terumo Description and Business Overview
 Table 86. Terumo Lancets Product
 Table 87. Terumo Lancets Sales (K Units), Revenue (US$ Million), Price (USD/Unit) and Gross Margin (2020-2025)
 Table 88. Terumo Sales Proportion of Lancets by Product in 2024
 Table 89. Terumo Sales Proportion of Lancets by Application in 2024
 Table 90. Terumo Sales Proportion of Lancets by Geographic Area in 2024
 Table 91. Terumo Recent Developments
 Table 92. I-SENS Company Information
 Table 93. I-SENS Description and Business Overview
 Table 94. I-SENS Lancets Product
 Table 95. I-SENS Lancets Sales (K Units), Revenue (US$ Million), Price (USD/Unit) and Gross Margin (2020-2025)
 Table 96. I-SENS Sales Proportion of Lancets by Product in 2024
 Table 97. I-SENS Sales Proportion of Lancets by Application in 2024
 Table 98. I-SENS Sales Proportion of Lancets by Geographic Area in 2024
 Table 99. I-SENS Recent Developments
 Table 100. Nipro Company Information
 Table 101. Nipro Description and Business Overview
 Table 102. Nipro Lancets Product
 Table 103. Nipro Lancets Sales (K Units), Revenue (US$ Million), Price (USD/Unit) and Gross Margin (2020-2025)
 Table 104. Nipro Sales Proportion of Lancets by Product in 2024
 Table 105. Nipro Sales Proportion of Lancets by Application in 2024
 Table 106. Nipro Sales Proportion of Lancets by Geographic Area in 2024
 Table 107. Nipro Recent Developments
 Table 108. Cardinal Health Company Information
 Table 109. Cardinal Health Description and Business Overview
 Table 110. Cardinal Health Lancets Product
 Table 111. Cardinal Health Lancets Sales (K Units), Revenue (US$ Million), Price (USD/Unit) and Gross Margin (2020-2025)
 Table 112. Cardinal Health Sales Proportion of Lancets by Product in 2024
 Table 113. Cardinal Health Sales Proportion of Lancets by Application in 2024
 Table 114. Cardinal Health Sales Proportion of Lancets by Geographic Area in 2024
 Table 115. Cardinal Health Recent Developments
 Table 116. ICU Medical Company Information
 Table 117. ICU Medical Description and Business Overview
 Table 118. ICU Medical Lancets Product
 Table 119. ICU Medical Lancets Sales (K Units), Revenue (US$ Million), Price (USD/Unit) and Gross Margin (2020-2025)
 Table 120. ICU Medical Sales Proportion of Lancets by Product in 2024
 Table 121. ICU Medical Sales Proportion of Lancets by Application in 2024
 Table 122. ICU Medical Sales Proportion of Lancets by Geographic Area in 2024
 Table 123. ICU Medical Recent Developments
 Table 124. Sarstedt Company Information
 Table 125. Sarstedt Description and Business Overview
 Table 126. Sarstedt Lancets Product
 Table 127. Sarstedt Lancets Sales (K Units), Revenue (US$ Million), Price (USD/Unit) and Gross Margin (2020-2025)
 Table 128. Sarstedt Sales Proportion of Lancets by Product in 2024
 Table 129. Sarstedt Sales Proportion of Lancets by Application in 2024
 Table 130. Sarstedt Sales Proportion of Lancets by Geographic Area in 2024
 Table 131. Sarstedt Recent Developments
 Table 132. Sinocare Company Information
 Table 133. Sinocare Description and Business Overview
 Table 134. Sinocare Lancets Product
 Table 135. Sinocare Lancets Sales (K Units), Revenue (US$ Million), Price (USD/Unit) and Gross Margin (2020-2025)
 Table 136. Sinocare Sales Proportion of Lancets by Product in 2024
 Table 137. Sinocare Sales Proportion of Lancets by Application in 2024
 Table 138. Sinocare Sales Proportion of Lancets by Geographic Area in 2024
 Table 139. Sinocare Recent Developments
 Table 140. Yicheng Company Information
 Table 141. Yicheng Description and Business Overview
 Table 142. Yicheng Lancets Product
 Table 143. Yicheng Lancets Sales (K Units), Revenue (US$ Million), Price (USD/Unit) and Gross Margin (2020-2025)
 Table 144. Yicheng Sales Proportion of Lancets by Product in 2024
 Table 145. Yicheng Sales Proportion of Lancets by Application in 2024
 Table 146. Yicheng Sales Proportion of Lancets by Geographic Area in 2024
 Table 147. Yicheng Recent Developments
 Table 148. Yuwell Company Information
 Table 149. Yuwell Description and Business Overview
 Table 150. Yuwell Lancets Product
 Table 151. Yuwell Lancets Sales (K Units), Revenue (US$ Million), Price (USD/Unit) and Gross Margin (2020-2025)
 Table 152. Yuwell Sales Proportion of Lancets by Product in 2024
 Table 153. Yuwell Sales Proportion of Lancets by Application in 2024
 Table 154. Yuwell Sales Proportion of Lancets by Geographic Area in 2024
 Table 155. Yuwell Recent Developments
 Table 156. Greiner Bio One Company Information
 Table 157. Greiner Bio One Description and Business Overview
 Table 158. Greiner Bio One Lancets Product
 Table 159. Greiner Bio One Lancets Sales (K Units), Revenue (US$ Million), Price (USD/Unit) and Gross Margin (2020-2025)
 Table 160. Greiner Bio One Sales Proportion of Lancets by Product in 2024
 Table 161. Greiner Bio One Sales Proportion of Lancets by Application in 2024
 Table 162. Greiner Bio One Sales Proportion of Lancets by Geographic Area in 2024
 Table 163. Greiner Bio One Recent Developments
 Table 164. Guangzhou iCare Medical Company Information
 Table 165. Guangzhou iCare Medical Description and Business Overview
 Table 166. Guangzhou iCare Medical Lancets Product
 Table 167. Guangzhou iCare Medical Lancets Sales (K Units), Revenue (US$ Million), Price (USD/Unit) and Gross Margin (2020-2025)
 Table 168. Guangzhou iCare Medical Sales Proportion of Lancets by Product in 2024
 Table 169. Guangzhou iCare Medical Sales Proportion of Lancets by Application in 2024
 Table 170. Guangzhou iCare Medical Sales Proportion of Lancets by Geographic Area in 2024
 Table 171. Guangzhou iCare Medical Recent Developments
 Table 172. Shandong Lianfa Company Information
 Table 173. Shandong Lianfa Description and Business Overview
 Table 174. Shandong Lianfa Lancets Product
 Table 175. Shandong Lianfa Lancets Sales (K Units), Revenue (US$ Million), Price (USD/Unit) and Gross Margin (2020-2025)
 Table 176. Shandong Lianfa Sales Proportion of Lancets by Product in 2024
 Table 177. Shandong Lianfa Sales Proportion of Lancets by Application in 2024
 Table 178. Shandong Lianfa Sales Proportion of Lancets by Geographic Area in 2024
 Table 179. Shandong Lianfa Recent Developments
 Table 180. Tianjin Huahong Company Information
 Table 181. Tianjin Huahong Description and Business Overview
 Table 182. Tianjin Huahong Lancets Product
 Table 183. Tianjin Huahong Lancets Sales (K Units), Revenue (US$ Million), Price (USD/Unit) and Gross Margin (2020-2025)
 Table 184. Tianjin Huahong Sales Proportion of Lancets by Product in 2024
 Table 185. Tianjin Huahong Sales Proportion of Lancets by Application in 2024
 Table 186. Tianjin Huahong Sales Proportion of Lancets by Geographic Area in 2024
 Table 187. Tianjin Huahong Recent Developments
 Table 188. Owen Mumford Company Information
 Table 189. Owen Mumford Description and Business Overview
 Table 190. Owen Mumford Lancets Product
 Table 191. Owen Mumford Lancets Sales (K Units), Revenue (US$ Million), Price (USD/Unit) and Gross Margin (2020-2025)
 Table 192. Owen Mumford Sales Proportion of Lancets by Product in 2024
 Table 193. Owen Mumford Sales Proportion of Lancets by Application in 2024
 Table 194. Owen Mumford Sales Proportion of Lancets by Geographic Area in 2024
 Table 195. Owen Mumford Recent Developments
 Table 196. HemoCue Company Information
 Table 197. HemoCue Description and Business Overview
 Table 198. HemoCue Lancets Product
 Table 199. HemoCue Lancets Sales (K Units), Revenue (US$ Million), Price (USD/Unit) and Gross Margin (2020-2025)
 Table 200. HemoCue Sales Proportion of Lancets by Product in 2024
 Table 201. HemoCue Sales Proportion of Lancets by Application in 2024
 Table 202. HemoCue Sales Proportion of Lancets by Geographic Area in 2024
 Table 203. HemoCue Recent Developments
 Table 204. HTL-STREFA Company Information
 Table 205. HTL-STREFA Description and Business Overview
 Table 206. HTL-STREFA Lancets Product
 Table 207. HTL-STREFA Lancets Sales (K Units), Revenue (US$ Million), Price (USD/Unit) and Gross Margin (2020-2025)
 Table 208. HTL-STREFA Sales Proportion of Lancets by Product in 2024
 Table 209. HTL-STREFA Sales Proportion of Lancets by Application in 2024
 Table 210. HTL-STREFA Sales Proportion of Lancets by Geographic Area in 2024
 Table 211. HTL-STREFA Recent Developments
 Table 212. UltiMed Company Information
 Table 213. UltiMed Description and Business Overview
 Table 214. UltiMed Lancets Product
 Table 215. UltiMed Lancets Sales (K Units), Revenue (US$ Million), Price (USD/Unit) and Gross Margin (2020-2025)
 Table 216. UltiMed Sales Proportion of Lancets by Product in 2024
 Table 217. UltiMed Sales Proportion of Lancets by Application in 2024
 Table 218. UltiMed Sales Proportion of Lancets by Geographic Area in 2024
 Table 219. UltiMed Recent Developments
 Table 220. SteriLance Medical Company Information
 Table 221. SteriLance Medical Description and Business Overview
 Table 222. SteriLance Medical Lancets Product
 Table 223. SteriLance Medical Lancets Sales (K Units), Revenue (US$ Million), Price (USD/Unit) and Gross Margin (2020-2025)
 Table 224. SteriLance Medical Sales Proportion of Lancets by Product in 2024
 Table 225. SteriLance Medical Sales Proportion of Lancets by Application in 2024
 Table 226. SteriLance Medical Sales Proportion of Lancets by Geographic Area in 2024
 Table 227. SteriLance Medical Recent Developments
 Table 228. North America Lancets Sales by Country (2020-2025) & (K Units)
 Table 229. North America Lancets Sales by Country (2026-2031) & (K Units)
 Table 230. North America Lancets Revenue by Country (2020-2025) & (US$ Million)
 Table 231. North America Lancets Revenue by Country (2026-2031) & (US$ Million)
 Table 232. North America Lancets Sales by Type (2020-2025) & (K Units)
 Table 233. North America Lancets Sales by Application (2020-2025) & (K Units)
 Table 234. Asia-Pacific Lancets Sales by Region (2020-2025) & (K Units)
 Table 235. Asia-Pacific Lancets Sales by Region (2026-2031) & (K Units)
 Table 236. Asia-Pacific Lancets Revenue by Region (2020-2025) & (US$ Million)
 Table 237. Asia-Pacific Lancets Revenue by Region (2026-2031) & (US$ Million)
 Table 238. Asia-Pacific Lancets Sales by Type (2020-2025) & (K Units)
 Table 239. Asia-Pacific Lancets Sales by Application (2020-2025) & (K Units)
 Table 240. Europe Lancets Sales by Country (2020-2025) & (K Units)
 Table 241. Europe Lancets Sales by Country (2026-2031) & (K Units)
 Table 242. Europe Lancets Revenue by Country (2020-2025) & (US$ Million)
 Table 243. Europe Lancets Revenue by Country (2026-2031) & (US$ Million)
 Table 244. Europe Lancets Sales by Type (2020-2025) & (K Units)
 Table 245. Europe Lancets Sales by Application (2020-2025) & (K Units)
 Table 246. Latin America Lancets Sales by Country (2020-2025) & (K Units)
 Table 247. Latin America Lancets Sales by Country (2026-2031) & (K Units)
 Table 248. Latin America Lancets Revenue by Country (2020-2025) & (US$ Million)
 Table 249. Latin America Lancets Revenue by Country (2026-2031) & (US$ Million)
 Table 250. Latin America Lancets Sales by Type (2020-2025) & (K Units)
 Table 251. Latin America Lancets Sales by Application (2020-2025) & (K Units)
 Table 252. Middle East and Africa Lancets Sales by Country (2020-2025) & (K Units)
 Table 253. Middle East and Africa Lancets Sales by Country (2026-2031) & (K Units)
 Table 254. Middle East and Africa Lancets Revenue by Country (2020-2025) & (US$ Million)
 Table 255. Middle East and Africa Lancets Revenue by Country (2026-2031) & (US$ Million)
 Table 256. Middle East and Africa Lancets Sales by Type (2020-2025) & (K Units)
 Table 257. Middle East and Africa Lancets Sales by Application (2020-2025) & (K Units)
 Table 258. Lancets Key Raw Materials, Industry Status and Trend
 Table 259. Lancets Key Raw Materials and Upstream Suppliers
 Table 260. Lancets Clients Status and Trend
 Table 261. Lancets Typical Clients
 Table 262. Lancets Distributors
 Table 263. Lancets Market Trends
 Table 264. Lancets Market Drivers
 Table 265. Lancets Market Challenges
 Table 266. Lancets Market Restraints
 Table 267. Research Programs/Design for This Report
 Table 268. Key Data Information from Secondary Sources
 Table 269. Key Data Information from Primary Sources
 Table 270. QYR Business Unit and Senior & Team Lead Analysts


List of Figures
 Figure 1. Lancets Product Picture
 Figure 2. Global Lancets Market Size by Type (US$ Million): 2020 VS 2024 VS 2031
 Figure 3. Global Lancets Sales Market Share by Type in 2024 & 2031
 Figure 4. Safety Lancets Product Picture
 Figure 5. Ordinary Lancets Product Picture
 Figure 6. Global Lancets Market Size by Application (US$ Million): 2020 VS 2024 VS 2031
 Figure 7. Global Lancets Sales Market Share by Application in 2024 & 2031
 Figure 8. Children's Fingertip Blood Tests
 Figure 9. Glucose Tests
 Figure 10. Others
 Figure 11. Lancets Report Years Considered
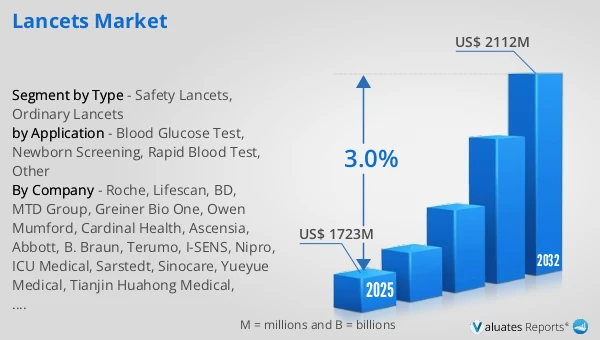
 Figure 12. Global Lancets Revenue, (US$ Million), 2020 VS 2024 VS 2031
 Figure 13. Global Lancets Market Size 2020-2031 (US$ Million)
 Figure 14. Global Lancets Sales 2020-2031 (K Units)
 Figure 15. Global Lancets Sales Market Share Forecast by Region (2020-2031)
 Figure 16. Global Lancets Revenue Market Share by Region (2020-2031)
 Figure 17. Global Lancets Sales Market Share Forecast by Type (2020-2031)
 Figure 18. Global Lancets Revenue Market Share Forecast by Type (2020-2031)
 Figure 19. Lancets Average Selling Price (ASP) by Type (2020-2025) & (USD/Unit)
 Figure 20. Global Lancets Sales Market Share Forecast by Application (2020-2031)
 Figure 21. Global Lancets Revenue Market Share Forecast by Application (2020-2031)
 Figure 22. Lancets Average Selling Price (ASP) by Application (2020-2025) & (USD/Unit)
 Figure 23. Safety Lancets of Lancets Revenue Market Share by Application, 2024 VS 2031
 Figure 24. Ordinary Lancets of Lancets Revenue Market Share by Application, 2024 VS 2031
 Figure 25. Global Lancets Sales Share by Manufacturer in 2024
 Figure 26. Lancets Market Share by Company Type (Tier 1, Tier 2, and Tier 3): 2020 VS 2024
 Figure 27. Safety Lancets Market Sales Proportion by Manufacturer in 2024
 Figure 28. Ordinary Lancets Market Sales Proportion by Manufacturer in 2024
 Figure 29. North America Lancets Revenue 2020-2031 (US$ Million)
 Figure 30. North America Lancets Sales Market Share by Type (2020-2025)
 Figure 31. North America Lancets Sales Market Share by Application (2020-2025)
 Figure 32. Asia-Pacific Lancets Revenue 2020-2031 (US$ Million)
 Figure 33. Asia-Pacific Lancets Sales Market Share by Region (2020-2031)
 Figure 34. Asia-Pacific Lancets Revenue Market Share by Region (2020-2031)
 Figure 35. Asia-Pacific Lancets Sales Market Share by Type (2020-2025)
 Figure 36. Asia-Pacific Lancets Sales Market Share by Application (2020-2025)
 Figure 37. Europe Lancets Revenue Growth Rate 2020-2031 (US$ Million)
 Figure 38. Europe Lancets Sales Market Share by Country (2020-2031)
 Figure 39. Europe Lancets Revenue Market Share by Country (2020-2031)
 Figure 40. Europe Lancets Sales Market Share by Type (2020-2025)
 Figure 41. Europe Lancets Sales Market Share by Application (2020-2025)
 Figure 42. Latin America Lancets Revenue Growth Rate 2020-2031 (US$ Million)
 Figure 43. Latin America Lancets Sales Market Share by Country (2020-2031)
 Figure 44. Latin America Lancets Revenue Market Share by Country (2020-2025)
 Figure 45. Latin America Lancets Sales Market Share by Type (2020-2025)
 Figure 46. Latin America Lancets Sales Market Share by Application (2020-2025)
 Figure 47. Middle East and Africa Lancets Revenue Growth Rate 2020-2031 (US$ Million)
 Figure 48. Middle East and Africa Lancets Sales Market Share by Country (2020-2031)
 Figure 49. Middle East and Africa Lancets Revenue Market Share by Country (2020-2031)
 Figure 50. Middle East and Africa Lancets Sales Market Share by Type (2020-2025)
 Figure 51. Middle East and Africa Lancets Sales Market Share by Application (2020-2025)
 Figure 52. Lancets Supply Chain (Upstream and Downstream Market)
 Figure 53. Global Production Market Share of Lancets Raw Materials by Region in 2024
 Figure 54. Lancets Distribution Channels
 Figure 55. Global Lancets Percentage 2020-2031: Indirect Sales VS Direct Sales
 Figure 56. Global Lancets Percentage 2020-2031: Online Sales VS Offline Sales
 Figure 57. Bottom-up and Top-down Approaches for This Report
 Figure 58. Data Triangulation
 Figure 59. Key Executives Interviewed
SELECT A FORMAT
Added to Cart
Electronic (PDF)

$5900

This license allows only one user to access the PDF.
Electronic (PDF)

$8850

This license allows 1 - 5 user to access the PDF, license is suitable for small groups of 5 users working together
Electronic (PDF)

$11800

This license allows users/teams in a same Enterprise to use this report, various departments within an enterpise can use this report
Add to Cart
Buy Now (15% Discount)

OUR CUSTOMER

Seventh Sense AI

RELATED REPORTS

Global GLP-1 Targeted Peptide Weight Loss Drugs Market Research Report 2025

120 Pages
Type: Report
Code: QYRE-Auto-19A18322
Fri Sep 12 00:00:00 UTC 2025

Add to Cart

Global Stimulant-Free Fat Burners Market Research Report 2025

120 Pages
Type: Report
Code: QYRE-Auto-3E3525
Thu Sep 11 00:00:00 UTC 2025

Add to Cart

Global Test Boosters Market Research Report 2025

120 Pages
Type: Report
Code: QYRE-Auto-35T3049
Thu Sep 11 00:00:00 UTC 2025

Add to Cart

Global Salsalate Market Research Report 2025

120 Pages
Type: Report
Code: QYRE-Auto-33Y1801
Thu Sep 11 00:00:00 UTC 2025

Add to Cart