List of Tables
Table 1. Antineoplastic Agents Market Trends
Table 2. Antineoplastic Agents Market Drivers & Opportunity
Table 3. Antineoplastic Agents Market Challenges
Table 4. Antineoplastic Agents Market Restraints
Table 5. Global Antineoplastic Agents Revenue by Company (2019-2024) & (US$ Million)
Table 6. Global Antineoplastic Agents Revenue Market Share by Company (2019-2024)
Table 7. Key Companies Antineoplastic Agents Manufacturing Base Distribution and Headquarters
Table 8. Key Companies Antineoplastic Agents Product Type
Table 9. Key Companies Time to Begin Mass Production of Antineoplastic Agents
Table 10. Global Antineoplastic Agents Companies Market Concentration Ratio (CR5 and HHI)
Table 11. Global Top Companies Market Share by Company Type (Tier 1, Tier 2, and Tier 3) & (based on the Revenue in Antineoplastic Agents as of 2023)
Table 12. Mergers & Acquisitions, Expansion Plans
Table 13. Global Antineoplastic Agents Sales Value by Type: 2019 VS 2023 VS 2030 (US$ Million)
Table 14. Global Antineoplastic Agents Sales Value by Type (2019-2024) & (US$ Million)
Table 15. Global Antineoplastic Agents Sales Value by Type (2025-2030) & (US$ Million)
Table 16. Global Antineoplastic Agents Sales Market Share in Value by Type (2019-2024) & (%)
Table 17. Global Antineoplastic Agents Sales Market Share in Value by Type (2025-2030) & (%)
Table 18. Global Antineoplastic Agents Sales Value by Application: 2019 VS 2023 VS 2030 (US$ Million)
Table 19. Global Antineoplastic Agents Sales Value by Application (2019-2024) & (US$ Million)
Table 20. Global Antineoplastic Agents Sales Value by Application (2025-2030) & (US$ Million)
Table 21. Global Antineoplastic Agents Sales Market Share in Value by Application (2019-2024) & (%)
Table 22. Global Antineoplastic Agents Sales Market Share in Value by Application (2025-2030) & (%)
Table 23. Global Antineoplastic Agents Sales Value by Region: 2019 VS 2023 VS 2030 (US$ Million)
Table 24. Global Antineoplastic Agents Sales Value by Region (2019-2024) & (US$ Million)
Table 25. Global Antineoplastic Agents Sales Value by Region (2025-2030) & (US$ Million)
Table 26. Global Antineoplastic Agents Sales Value by Region (2019-2024) & (%)
Table 27. Global Antineoplastic Agents Sales Value by Region (2025-2030) & (%)
Table 28. Key Countries/Regions Antineoplastic Agents Sales Value Growth Trends, (US$ Million): 2019 VS 2023 VS 2030
Table 29. Key Countries/Regions Antineoplastic Agents Sales Value, (2019-2024) & (US$ Million)
Table 30. Key Countries/Regions Antineoplastic Agents Sales Value, (2025-2030) & (US$ Million)
Table 31. BMS Basic Information List
Table 32. BMS Description and Business Overview
Table 33. BMS Antineoplastic Agents Products, Services and Solutions
Table 34. Revenue (US$ Million) in Antineoplastic Agents Business of BMS (2019-2024)
Table 35. BMS Recent Developments
Table 36. MSD Basic Information List
Table 37. MSD Description and Business Overview
Table 38. MSD Antineoplastic Agents Products, Services and Solutions
Table 39. Revenue (US$ Million) in Antineoplastic Agents Business of MSD (2019-2024)
Table 40. MSD Recent Developments
Table 41. Johnson & Johnson Basic Information List
Table 42. Johnson & Johnson Description and Business Overview
Table 43. Johnson & Johnson Antineoplastic Agents Products, Services and Solutions
Table 44. Revenue (US$ Million) in Antineoplastic Agents Business of Johnson & Johnson (2019-2024)
Table 45. Johnson & Johnson Recent Developments
Table 46. Pfizer Basic Information List
Table 47. Pfizer Description and Business Overview
Table 48. Pfizer Antineoplastic Agents Products, Services and Solutions
Table 49. Revenue (US$ Million) in Antineoplastic Agents Business of Pfizer (2019-2024)
Table 50. Pfizer Recent Developments
Table 51. AstraZeneca Basic Information List
Table 52. AstraZeneca Description and Business Overview
Table 53. AstraZeneca Antineoplastic Agents Products, Services and Solutions
Table 54. Revenue (US$ Million) in Antineoplastic Agents Business of AstraZeneca (2019-2024)
Table 55. AstraZeneca Recent Developments
Table 56. Novartis Basic Information List
Table 57. Novartis Description and Business Overview
Table 58. Novartis Antineoplastic Agents Products, Services and Solutions
Table 59. Revenue (US$ Million) in Antineoplastic Agents Business of Novartis (2019-2024)
Table 60. Novartis Recent Developments
Table 61. Sanofi Basic Information List
Table 62. Sanofi Description and Business Overview
Table 63. Sanofi Antineoplastic Agents Products, Services and Solutions
Table 64. Revenue (US$ Million) in Antineoplastic Agents Business of Sanofi (2019-2024)
Table 65. Sanofi Recent Developments
Table 66. Celgene Basic Information List
Table 67. Celgene Description and Business Overview
Table 68. Celgene Antineoplastic Agents Products, Services and Solutions
Table 69. Revenue (US$ Million) in Antineoplastic Agents Business of Celgene (2019-2024)
Table 70. Celgene Recent Developments
Table 71. Roche Basic Information List
Table 72. Roche Description and Business Overview
Table 73. Roche Antineoplastic Agents Products, Services and Solutions
Table 74. Revenue (US$ Million) in Antineoplastic Agents Business of Roche (2019-2024)
Table 75. Roche Recent Developments
Table 76. Lilly Basic Information List
Table 77. Lilly Description and Business Overview
Table 78. Lilly Antineoplastic Agents Products, Services and Solutions
Table 79. Revenue (US$ Million) in Antineoplastic Agents Business of Lilly (2019-2024)
Table 80. Lilly Recent Developments
Table 81. Bayer Basic Information List
Table 82. Bayer Description and Business Overview
Table 83. Bayer Antineoplastic Agents Products, Services and Solutions
Table 84. Revenue (US$ Million) in Antineoplastic Agents Business of Bayer (2019-2024)
Table 85. Bayer Recent Developments
Table 86. Abraxis Basic Information List
Table 87. Abraxis Description and Business Overview
Table 88. Abraxis Antineoplastic Agents Products, Services and Solutions
Table 89. Revenue (US$ Million) in Antineoplastic Agents Business of Abraxis (2019-2024)
Table 90. Abraxis Recent Developments
Table 91. Gilead Basic Information List
Table 92. Gilead Description and Business Overview
Table 93. Gilead Antineoplastic Agents Products, Services and Solutions
Table 94. Revenue (US$ Million) in Antineoplastic Agents Business of Gilead (2019-2024)
Table 95. Gilead Recent Developments
Table 96. Wto-Day Order Pharmaceutical Basic Information List
Table 97. Wto-Day Order Pharmaceutical Description and Business Overview
Table 98. Wto-Day Order Pharmaceutical Antineoplastic Agents Products, Services and Solutions
Table 99. Revenue (US$ Million) in Antineoplastic Agents Business of Wto-Day Order Pharmaceutical (2019-2024)
Table 100. Wto-Day Order Pharmaceutical Recent Developments
Table 101. Sinopharm Basic Information List
Table 102. Sinopharm Description and Business Overview
Table 103. Sinopharm Antineoplastic Agents Products, Services and Solutions
Table 104. Revenue (US$ Million) in Antineoplastic Agents Business of Sinopharm (2019-2024)
Table 105. Sinopharm Recent Developments
Table 106. Shandong Lvye Pharmaceutical Basic Information List
Table 107. Shandong Lvye Pharmaceutical Description and Business Overview
Table 108. Shandong Lvye Pharmaceutical Antineoplastic Agents Products, Services and Solutions
Table 109. Revenue (US$ Million) in Antineoplastic Agents Business of Shandong Lvye Pharmaceutical (2019-2024)
Table 110. Shandong Lvye Pharmaceutical Recent Developments
Table 111. CTTQ Basic Information List
Table 112. CTTQ Description and Business Overview
Table 113. CTTQ Antineoplastic Agents Products, Services and Solutions
Table 114. Revenue (US$ Million) in Antineoplastic Agents Business of CTTQ (2019-2024)
Table 115. CTTQ Recent Developments
Table 116. Jiangsu Hengrui Pharmaceutical Basic Information List
Table 117. Jiangsu Hengrui Pharmaceutical Description and Business Overview
Table 118. Jiangsu Hengrui Pharmaceutical Antineoplastic Agents Products, Services and Solutions
Table 119. Revenue (US$ Million) in Antineoplastic Agents Business of Jiangsu Hengrui Pharmaceutical (2019-2024)
Table 120. Jiangsu Hengrui Pharmaceutical Recent Developments
Table 121. Qilu Pharmaceutical Basic Information List
Table 122. Qilu Pharmaceutical Description and Business Overview
Table 123. Qilu Pharmaceutical Antineoplastic Agents Products, Services and Solutions
Table 124. Revenue (US$ Million) in Antineoplastic Agents Business of Qilu Pharmaceutical (2019-2024)
Table 125. Qilu Pharmaceutical Recent Developments
Table 126. Baekdu Mountain Pharmaceutical Basic Information List
Table 127. Baekdu Mountain Pharmaceutical Description and Business Overview
Table 128. Baekdu Mountain Pharmaceutical Antineoplastic Agents Products, Services and Solutions
Table 129. Revenue (US$ Million) in Antineoplastic Agents Business of Baekdu Mountain Pharmaceutical (2019-2024)
Table 130. Baekdu Mountain Pharmaceutical Recent Developments
Table 131. Baida Pharmaceutical Basic Information List
Table 132. Baida Pharmaceutical Description and Business Overview
Table 133. Baida Pharmaceutical Antineoplastic Agents Products, Services and Solutions
Table 134. Revenue (US$ Million) in Antineoplastic Agents Business of Baida Pharmaceutical (2019-2024)
Table 135. Baida Pharmaceutical Recent Developments
Table 136. Jiangsu Haosen Pharmaceutical Group Basic Information List
Table 137. Jiangsu Haosen Pharmaceutical Group Description and Business Overview
Table 138. Jiangsu Haosen Pharmaceutical Group Antineoplastic Agents Products, Services and Solutions
Table 139. Revenue (US$ Million) in Antineoplastic Agents Business of Jiangsu Haosen Pharmaceutical Group (2019-2024)
Table 140. Jiangsu Haosen Pharmaceutical Group Recent Developments
Table 141. Hainan Chang'an International Pharmaceutical Basic Information List
Table 142. Hainan Chang'an International Pharmaceutical Description and Business Overview
Table 143. Hainan Chang'an International Pharmaceutical Antineoplastic Agents Products, Services and Solutions
Table 144. Revenue (US$ Million) in Antineoplastic Agents Business of Hainan Chang'an International Pharmaceutical (2019-2024)
Table 145. Hainan Chang'an International Pharmaceutical Recent Developments
Table 146. Zhejiang Kanglaite Pharmaceutical Basic Information List
Table 147. Zhejiang Kanglaite Pharmaceutical Description and Business Overview
Table 148. Zhejiang Kanglaite Pharmaceutical Antineoplastic Agents Products, Services and Solutions
Table 149. Revenue (US$ Million) in Antineoplastic Agents Business of Zhejiang Kanglaite Pharmaceutical (2019-2024)
Table 150. Zhejiang Kanglaite Pharmaceutical Recent Developments
Table 151. Shandong New Era Pharmaceutical Basic Information List
Table 152. Shandong New Era Pharmaceutical Description and Business Overview
Table 153. Shandong New Era Pharmaceutical Antineoplastic Agents Products, Services and Solutions
Table 154. Revenue (US$ Million) in Antineoplastic Agents Business of Shandong New Era Pharmaceutical (2019-2024)
Table 155. Shandong New Era Pharmaceutical Recent Developments
Table 156. Liaoning Novino Pharmaceutical Basic Information List
Table 157. Liaoning Novino Pharmaceutical Description and Business Overview
Table 158. Liaoning Novino Pharmaceutical Antineoplastic Agents Products, Services and Solutions
Table 159. Revenue (US$ Million) in Antineoplastic Agents Business of Liaoning Novino Pharmaceutical (2019-2024)
Table 160. Liaoning Novino Pharmaceutical Recent Developments
Table 161. Maanshan Fengyuan Pharmaceutical Basic Information List
Table 162. Maanshan Fengyuan Pharmaceutical Description and Business Overview
Table 163. Maanshan Fengyuan Pharmaceutical Antineoplastic Agents Products, Services and Solutions
Table 164. Revenue (US$ Million) in Antineoplastic Agents Business of Maanshan Fengyuan Pharmaceutical (2019-2024)
Table 165. Maanshan Fengyuan Pharmaceutical Recent Developments
Table 166. Meiluo Pharmaceutical Basic Information List
Table 167. Meiluo Pharmaceutical Description and Business Overview
Table 168. Meiluo Pharmaceutical Antineoplastic Agents Products, Services and Solutions
Table 169. Revenue (US$ Million) in Antineoplastic Agents Business of Meiluo Pharmaceutical (2019-2024)
Table 170. Meiluo Pharmaceutical Recent Developments
Table 171. Shandong Luoxin Pharmaceutical Group Basic Information List
Table 172. Shandong Luoxin Pharmaceutical Group Description and Business Overview
Table 173. Shandong Luoxin Pharmaceutical Group Antineoplastic Agents Products, Services and Solutions
Table 174. Revenue (US$ Million) in Antineoplastic Agents Business of Shandong Luoxin Pharmaceutical Group (2019-2024)
Table 175. Shandong Luoxin Pharmaceutical Group Recent Developments
Table 176. Zhejiang Yatai Pharmaceutical Basic Information List
Table 177. Zhejiang Yatai Pharmaceutical Description and Business Overview
Table 178. Zhejiang Yatai Pharmaceutical Antineoplastic Agents Products, Services and Solutions
Table 179. Revenue (US$ Million) in Antineoplastic Agents Business of Zhejiang Yatai Pharmaceutical (2019-2024)
Table 180. Zhejiang Yatai Pharmaceutical Recent Developments
Table 181. Tesaro (GSK) Basic Information List
Table 182. Tesaro (GSK) Description and Business Overview
Table 183. Tesaro (GSK) Antineoplastic Agents Products, Services and Solutions
Table 184. Revenue (US$ Million) in Antineoplastic Agents Business of Tesaro (GSK) (2019-2024)
Table 185. Tesaro (GSK) Recent Developments
Table 186. Eisai Basic Information List
Table 187. Eisai Description and Business Overview
Table 188. Eisai Antineoplastic Agents Products, Services and Solutions
Table 189. Revenue (US$ Million) in Antineoplastic Agents Business of Eisai (2019-2024)
Table 190. Eisai Recent Developments
Table 191. Biogen Idec Basic Information List
Table 192. Biogen Idec Description and Business Overview
Table 193. Biogen Idec Antineoplastic Agents Products, Services and Solutions
Table 194. Revenue (US$ Million) in Antineoplastic Agents Business of Biogen Idec (2019-2024)
Table 195. Biogen Idec Recent Developments
Table 196. Teva Basic Information List
Table 197. Teva Description and Business Overview
Table 198. Teva Antineoplastic Agents Products, Services and Solutions
Table 199. Revenue (US$ Million) in Antineoplastic Agents Business of Teva (2019-2024)
Table 200. Teva Recent Developments
Table 201. AbbVie Basic Information List
Table 202. AbbVie Description and Business Overview
Table 203. AbbVie Antineoplastic Agents Products, Services and Solutions
Table 204. Revenue (US$ Million) in Antineoplastic Agents Business of AbbVie (2019-2024)
Table 205. AbbVie Recent Developments
Table 206. Key Raw Materials Lists
Table 207. Raw Materials Key Suppliers Lists
Table 208. Antineoplastic Agents Downstream Customers
Table 209. Antineoplastic Agents Distributors List
Table 210. Research Programs/Design for This Report
Table 211. Key Data Information from Secondary Sources
Table 212. Key Data Information from Primary Sources
Table 213. Business Unit and Senior & Team Lead Analysts
List of Figures
Figure 1. Antineoplastic Agents Product Picture
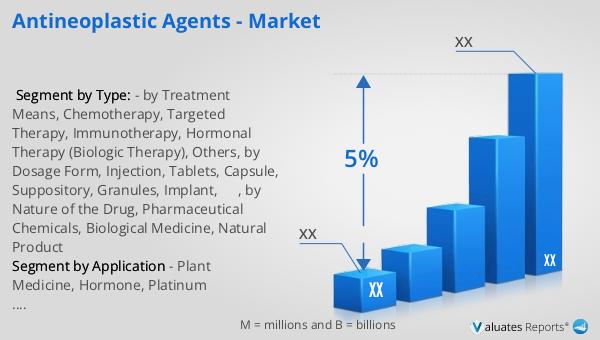
Figure 2. Global Antineoplastic Agents Sales Value, 2019 VS 2023 VS 2030 (US$ Million)
Figure 3. Global Antineoplastic Agents Sales Value (2019-2030) & (US$ Million)
Figure 4. Antineoplastic Agents Report Years Considered
Figure 5. Global Antineoplastic Agents Players Revenue Ranking (2023) & (US$ Million)
Figure 6. The 5 and 10 Largest Manufacturers in the World: Market Share by Antineoplastic Agents Revenue in 2023
Figure 7. Antineoplastic Agents Market Share by Company Type (Tier 1, Tier 2, and Tier 3): 2019 VS 2023
Figure 8. Chemotherapy Picture
Figure 9. Targeted Therapy Picture
Figure 10. Immunotherapy Picture
Figure 11. Hormonal Therapy (Biologic Therapy) Picture
Figure 12. Others Picture
Figure 13. Global Antineoplastic Agents Sales Value by Type (2019 VS 2023 VS 2030) & (US$ Million)
Figure 14. Global Antineoplastic Agents Sales Value Market Share by Type, 2023 & 2030
Figure 15. Product Picture of Plant Medicine
Figure 16. Product Picture of Hormone
Figure 17. Product Picture of Platinum Compounds
Figure 18. Product Picture of Metabolism Of Drug Resistance
Figure 19. Product Picture of Targeting Small Molecules
Figure 20. Product Picture of Drugs For Cancer
Figure 21. Product Picture of Antibiotic
Figure 22. Product Picture of Alkylating Agent
Figure 23. Product Picture of Chemoradiotherapy Protectant
Figure 24. Product Picture of Other
Figure 25. Global Antineoplastic Agents Sales Value by Application (2019 VS 2023 VS 2030) & (US$ Million)
Figure 26. Global Antineoplastic Agents Sales Value Market Share by Application, 2023 & 2030
Figure 27. North America Antineoplastic Agents Sales Value (2019-2030) & (US$ Million)
Figure 28. North America Antineoplastic Agents Sales Value by Country (%), 2023 VS 2030
Figure 29. Europe Antineoplastic Agents Sales Value (2019-2030) & (US$ Million)
Figure 30. Europe Antineoplastic Agents Sales Value by Country (%), 2023 VS 2030
Figure 31. Asia Pacific Antineoplastic Agents Sales Value (2019-2030) & (US$ Million)
Figure 32. Asia Pacific Antineoplastic Agents Sales Value by Country (%), 2023 VS 2030
Figure 33. South America Antineoplastic Agents Sales Value (2019-2030) & (US$ Million)
Figure 34. South America Antineoplastic Agents Sales Value by Country (%), 2023 VS 2030
Figure 35. Middle East & Africa Antineoplastic Agents Sales Value (2019-2030) & (US$ Million)
Figure 36. Middle East & Africa Antineoplastic Agents Sales Value by Country (%), 2023 VS 2030
Figure 37. Key Countries/Regions Antineoplastic Agents Sales Value (%), (2019-2030)
Figure 38. United States Antineoplastic Agents Sales Value, (2019-2030) & (US$ Million)
Figure 39. United States Antineoplastic Agents Sales Value by Type (%), 2023 VS 2030
Figure 40. United States Antineoplastic Agents Sales Value by Application (%), 2023 VS 2030
Figure 41. Europe Antineoplastic Agents Sales Value, (2019-2030) & (US$ Million)
Figure 42. Europe Antineoplastic Agents Sales Value by Type (%), 2023 VS 2030
Figure 43. Europe Antineoplastic Agents Sales Value by Application (%), 2023 VS 2030
Figure 44. China Antineoplastic Agents Sales Value, (2019-2030) & (US$ Million)
Figure 45. China Antineoplastic Agents Sales Value by Type (%), 2023 VS 2030
Figure 46. China Antineoplastic Agents Sales Value by Application (%), 2023 VS 2030
Figure 47. Japan Antineoplastic Agents Sales Value, (2019-2030) & (US$ Million)
Figure 48. Japan Antineoplastic Agents Sales Value by Type (%), 2023 VS 2030
Figure 49. Japan Antineoplastic Agents Sales Value by Application (%), 2023 VS 2030
Figure 50. South Korea Antineoplastic Agents Sales Value, (2019-2030) & (US$ Million)
Figure 51. South Korea Antineoplastic Agents Sales Value by Type (%), 2023 VS 2030
Figure 52. South Korea Antineoplastic Agents Sales Value by Application (%), 2023 VS 2030
Figure 53. Southeast Asia Antineoplastic Agents Sales Value, (2019-2030) & (US$ Million)
Figure 54. Southeast Asia Antineoplastic Agents Sales Value by Type (%), 2023 VS 2030
Figure 55. Southeast Asia Antineoplastic Agents Sales Value by Application (%), 2023 VS 2030
Figure 56. India Antineoplastic Agents Sales Value, (2019-2030) & (US$ Million)
Figure 57. India Antineoplastic Agents Sales Value by Type (%), 2023 VS 2030
Figure 58. India Antineoplastic Agents Sales Value by Application (%), 2023 VS 2030
Figure 59. Antineoplastic Agents Industrial Chain
Figure 60. Antineoplastic Agents Manufacturing Cost Structure
Figure 61. Channels of Distribution (Direct Sales, and Distribution)
Figure 62. Bottom-up and Top-down Approaches for This Report
Figure 63. Data Triangulation