List of Tables
Table 1. Global Comprehensive Nursing Home Market Size Growth Rate by Type (US$ Million): 2020 VS 2024 VS 2031
Table 2. Key Players of Day Care
Table 3. Key Players of Full Day Escort
Table 4. Global Comprehensive Nursing Home Market Size Growth Rate by Operator Type (US$ Million): 2020 VS 2024 VS 2031
Table 5. Key Players of Government-operated Nursing Home
Table 6. Key Players of Private-operated Nursing Home
Table 7. Key Players of Hospital-affiliated Nursing Home
Table 8. Key Players of Corporate/Foundation-operated Facility
Table 9. Global Comprehensive Nursing Home Market Size Growth Rate by Target Group (US$ Million): 2020 VS 2024 VS 2031
Table 10. Key Players of Independent Elderly Care Facility
Table 11. Key Players of Semi-dependent Elderly Care Home
Table 12. Key Players of Dependent Elderly Care Home
Table 13. Key Players of Dementia & Alzheimer’s Care Facility
Table 14. Global Comprehensive Nursing Home Market Size Growth by Application (US$ Million): 2020 VS 2024 VS 2031
Table 15. Global Comprehensive Nursing Home Market Size by Region (US$ Million): 2020 VS 2024 VS 2031
Table 16. Global Comprehensive Nursing Home Market Size by Region (2020-2025) & (US$ Million)
Table 17. Global Comprehensive Nursing Home Market Share by Region (2020-2025)
Table 18. Global Comprehensive Nursing Home Forecasted Market Size by Region (2026-2031) & (US$ Million)
Table 19. Global Comprehensive Nursing Home Market Share by Region (2026-2031)
Table 20. Comprehensive Nursing Home Market Trends
Table 21. Comprehensive Nursing Home Market Drivers
Table 22. Comprehensive Nursing Home Market Challenges
Table 23. Comprehensive Nursing Home Market Restraints
Table 24. Global Comprehensive Nursing Home Revenue by Players (2020-2025) & (US$ Million)
Table 25. Global Comprehensive Nursing Home Market Share by Players (2020-2025)
Table 26. Global Top Comprehensive Nursing Home Players by Company Type (Tier 1, Tier 2, and Tier 3) & (based on the Revenue in Comprehensive Nursing Home as of 2024)
Table 27. Ranking of Global Top Comprehensive Nursing Home Companies by Revenue (US$ Million) in 2024
Table 28. Global 5 Largest Players Market Share by Comprehensive Nursing Home Revenue (CR5 and HHI) & (2020-2025)
Table 29. Global Key Players of Comprehensive Nursing Home, Headquarters and Area Served
Table 30. Global Key Players of Comprehensive Nursing Home, Product and Application
Table 31. Global Key Players of Comprehensive Nursing Home, Date of Enter into This Industry
Table 32. Mergers & Acquisitions, Expansion Plans
Table 33. Global Comprehensive Nursing Home Market Size by Type (2020-2025) & (US$ Million)
Table 34. Global Comprehensive Nursing Home Revenue Market Share by Type (2020-2025)
Table 35. Global Comprehensive Nursing Home Forecasted Market Size by Type (2026-2031) & (US$ Million)
Table 36. Global Comprehensive Nursing Home Revenue Market Share by Type (2026-2031)
Table 37. Global Comprehensive Nursing Home Market Size by Application (2020-2025) & (US$ Million)
Table 38. Global Comprehensive Nursing Home Revenue Market Share by Application (2020-2025)
Table 39. Global Comprehensive Nursing Home Forecasted Market Size by Application (2026-2031) & (US$ Million)
Table 40. Global Comprehensive Nursing Home Revenue Market Share by Application (2026-2031)
Table 41. North America Comprehensive Nursing Home Market Size Growth Rate by Country (US$ Million): 2020 VS 2024 VS 2031
Table 42. North America Comprehensive Nursing Home Market Size by Country (2020-2025) & (US$ Million)
Table 43. North America Comprehensive Nursing Home Market Size by Country (2026-2031) & (US$ Million)
Table 44. Europe Comprehensive Nursing Home Market Size Growth Rate by Country (US$ Million): 2020 VS 2024 VS 2031
Table 45. Europe Comprehensive Nursing Home Market Size by Country (2020-2025) & (US$ Million)
Table 46. Europe Comprehensive Nursing Home Market Size by Country (2026-2031) & (US$ Million)
Table 47. Asia-Pacific Comprehensive Nursing Home Market Size Growth Rate by Region (US$ Million): 2020 VS 2024 VS 2031
Table 48. Asia-Pacific Comprehensive Nursing Home Market Size by Region (2020-2025) & (US$ Million)
Table 49. Asia-Pacific Comprehensive Nursing Home Market Size by Region (2026-2031) & (US$ Million)
Table 50. Latin America Comprehensive Nursing Home Market Size Growth Rate by Country (US$ Million): 2020 VS 2024 VS 2031
Table 51. Latin America Comprehensive Nursing Home Market Size by Country (2020-2025) & (US$ Million)
Table 52. Latin America Comprehensive Nursing Home Market Size by Country (2026-2031) & (US$ Million)
Table 53. Middle East & Africa Comprehensive Nursing Home Market Size Growth Rate by Country (US$ Million): 2020 VS 2024 VS 2031
Table 54. Middle East & Africa Comprehensive Nursing Home Market Size by Country (2020-2025) & (US$ Million)
Table 55. Middle East & Africa Comprehensive Nursing Home Market Size by Country (2026-2031) & (US$ Million)
Table 56. Visiting Angels Company Details
Table 57. Visiting Angels Business Overview
Table 58. Visiting Angels Comprehensive Nursing Home Product
Table 59. Visiting Angels Revenue in Comprehensive Nursing Home Business (2020-2025) & (US$ Million)
Table 60. Visiting Angels Recent Development
Table 61. Columbia Pacific Management Co. Company Details
Table 62. Columbia Pacific Management Co. Business Overview
Table 63. Columbia Pacific Management Co. Comprehensive Nursing Home Product
Table 64. Columbia Pacific Management Co. Revenue in Comprehensive Nursing Home Business (2020-2025) & (US$ Million)
Table 65. Columbia Pacific Management Co. Recent Development
Table 66. Emeritus Corporation Company Details
Table 67. Emeritus Corporation Business Overview
Table 68. Emeritus Corporation Comprehensive Nursing Home Product
Table 69. Emeritus Corporation Revenue in Comprehensive Nursing Home Business (2020-2025) & (US$ Million)
Table 70. Emeritus Corporation Recent Development
Table 71. Watermark Retirement Communities, Inc. Company Details
Table 72. Watermark Retirement Communities, Inc. Business Overview
Table 73. Watermark Retirement Communities, Inc. Comprehensive Nursing Home Product
Table 74. Watermark Retirement Communities, Inc. Revenue in Comprehensive Nursing Home Business (2020-2025) & (US$ Million)
Table 75. Watermark Retirement Communities, Inc. Recent Development
Table 76. Merrill Gardens Company Details
Table 77. Merrill Gardens Business Overview
Table 78. Merrill Gardens Comprehensive Nursing Home Product
Table 79. Merrill Gardens Revenue in Comprehensive Nursing Home Business (2020-2025) & (US$ Million)
Table 80. Merrill Gardens Recent Development
Table 81. RIEI Company Details
Table 82. RIEI Business Overview
Table 83. RIEI Comprehensive Nursing Home Product
Table 84. RIEI Revenue in Comprehensive Nursing Home Business (2020-2025) & (US$ Million)
Table 85. RIEI Recent Development
Table 86. Medical Care Service Company Inc. Company Details
Table 87. Medical Care Service Company Inc. Business Overview
Table 88. Medical Care Service Company Inc. Comprehensive Nursing Home Product
Table 89. Medical Care Service Company Inc. Revenue in Comprehensive Nursing Home Business (2020-2025) & (US$ Million)
Table 90. Medical Care Service Company Inc. Recent Development
Table 91. RPEA Company Details
Table 92. RPEA Business Overview
Table 93. RPEA Comprehensive Nursing Home Product
Table 94. RPEA Revenue in Comprehensive Nursing Home Business (2020-2025) & (US$ Million)
Table 95. RPEA Recent Development
Table 96. Colisee Company Details
Table 97. Colisee Business Overview
Table 98. Colisee Comprehensive Nursing Home Product
Table 99. Colisee Revenue in Comprehensive Nursing Home Business (2020-2025) & (US$ Million)
Table 100. Colisee Recent Development
Table 101. Lendlease Company Details
Table 102. Lendlease Business Overview
Table 103. Lendlease Comprehensive Nursing Home Product
Table 104. Lendlease Revenue in Comprehensive Nursing Home Business (2020-2025) & (US$ Million)
Table 105. Lendlease Recent Development
Table 106. Nichiigakkan Company Details
Table 107. Nichiigakkan Business Overview
Table 108. Nichiigakkan Comprehensive Nursing Home Product
Table 109. Nichiigakkan Revenue in Comprehensive Nursing Home Business (2020-2025) & (US$ Million)
Table 110. Nichiigakkan Recent Development
Table 111. Sompo Holdings Company Details
Table 112. Sompo Holdings Business Overview
Table 113. Sompo Holdings Comprehensive Nursing Home Product
Table 114. Sompo Holdings Revenue in Comprehensive Nursing Home Business (2020-2025) & (US$ Million)
Table 115. Sompo Holdings Recent Development
Table 116. Benesse Holdings Company Details
Table 117. Benesse Holdings Business Overview
Table 118. Benesse Holdings Comprehensive Nursing Home Product
Table 119. Benesse Holdings Revenue in Comprehensive Nursing Home Business (2020-2025) & (US$ Million)
Table 120. Benesse Holdings Recent Development
Table 121. Health Solution Company Details
Table 122. Health Solution Business Overview
Table 123. Health Solution Comprehensive Nursing Home Product
Table 124. Health Solution Revenue in Comprehensive Nursing Home Business (2020-2025) & (US$ Million)
Table 125. Health Solution Recent Development
Table 126. Taikang Home Company Details
Table 127. Taikang Home Business Overview
Table 128. Taikang Home Comprehensive Nursing Home Product
Table 129. Taikang Home Revenue in Comprehensive Nursing Home Business (2020-2025) & (US$ Million)
Table 130. Taikang Home Recent Development
Table 131. Yihua Healthcare Company Details
Table 132. Yihua Healthcare Business Overview
Table 133. Yihua Healthcare Comprehensive Nursing Home Product
Table 134. Yihua Healthcare Revenue in Comprehensive Nursing Home Business (2020-2025) & (US$ Million)
Table 135. Yihua Healthcare Recent Development
Table 136. Hunan Development Group Company Details
Table 137. Hunan Development Group Business Overview
Table 138. Hunan Development Group Comprehensive Nursing Home Product
Table 139. Hunan Development Group Revenue in Comprehensive Nursing Home Business (2020-2025) & (US$ Million)
Table 140. Hunan Development Group Recent Development
Table 141. Langgao Elderly Service Company Details
Table 142. Langgao Elderly Service Business Overview
Table 143. Langgao Elderly Service Comprehensive Nursing Home Product
Table 144. Langgao Elderly Service Revenue in Comprehensive Nursing Home Business (2020-2025) & (US$ Million)
Table 145. Langgao Elderly Service Recent Development
Table 146. Ainong Senior Care Technology Company Details
Table 147. Ainong Senior Care Technology Business Overview
Table 148. Ainong Senior Care Technology Comprehensive Nursing Home Product
Table 149. Ainong Senior Care Technology Revenue in Comprehensive Nursing Home Business (2020-2025) & (US$ Million)
Table 150. Ainong Senior Care Technology Recent Development
Table 151. Yada Senior Living Group Company Details
Table 152. Yada Senior Living Group Business Overview
Table 153. Yada Senior Living Group Comprehensive Nursing Home Product
Table 154. Yada Senior Living Group Revenue in Comprehensive Nursing Home Business (2020-2025) & (US$ Million)
Table 155. Yada Senior Living Group Recent Development
Table 156. Shengquan Group Company Details
Table 157. Shengquan Group Business Overview
Table 158. Shengquan Group Comprehensive Nursing Home Product
Table 159. Shengquan Group Revenue in Comprehensive Nursing Home Business (2020-2025) & (US$ Million)
Table 160. Shengquan Group Recent Development
Table 161. Research Programs/Design for This Report
Table 162. Key Data Information from Secondary Sources
Table 163. Key Data Information from Primary Sources
Table 164. Authors List of This Report
List of Figures
Figure 1. Comprehensive Nursing Home Picture
Figure 2. Global Comprehensive Nursing Home Market Size Comparison by Type (2020-2031) & (US$ Million)
Figure 3. Global Comprehensive Nursing Home Market Share by Type: 2024 VS 2031
Figure 4. Day Care Features
Figure 5. Full Day Escort Features
Figure 6. Global Comprehensive Nursing Home Market Size Comparison by Operator Type (2020-2031) & (US$ Million)
Figure 7. Government-operated Nursing Home Features
Figure 8. Private-operated Nursing Home Features
Figure 9. Hospital-affiliated Nursing Home Features
Figure 10. Corporate/Foundation-operated Facility Features
Figure 11. Global Comprehensive Nursing Home Market Size Comparison by Target Group (2020-2031) & (US$ Million)
Figure 12. Independent Elderly Care Facility Features
Figure 13. Semi-dependent Elderly Care Home Features
Figure 14. Dependent Elderly Care Home Features
Figure 15. Dementia & Alzheimer’s Care Facility Features
Figure 16. Global Comprehensive Nursing Home Market Size by Application (2020-2031) & (US$ Million)
Figure 17. Global Comprehensive Nursing Home Market Share by Application: 2024 VS 2031
Figure 18. Old-Age Case Studies
Figure 19. Disease Care Case Studies
Figure 20. Others Case Studies
Figure 21. Comprehensive Nursing Home Report Years Considered
Figure 22. Global Comprehensive Nursing Home Market Size (US$ Million), Year-over-Year: 2020-2031
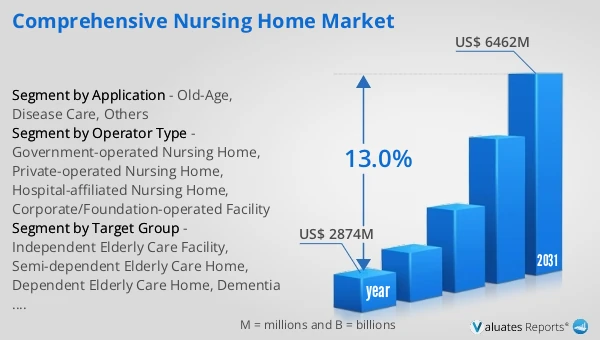
Figure 23. Global Comprehensive Nursing Home Market Size, (US$ Million), 2020 VS 2024 VS 2031
Figure 24. Global Comprehensive Nursing Home Market Share by Region: 2024 VS 2031
Figure 25. Global Comprehensive Nursing Home Market Share by Players in 2024
Figure 26. Global Comprehensive Nursing Home Market Share by Company Type (Tier 1, Tier 2, and Tier 3)
Figure 27. The Top 10 and 5 Players Market Share by Comprehensive Nursing Home Revenue in 2024
Figure 28. North America Comprehensive Nursing Home Market Size YoY Growth (2020-2031) & (US$ Million)
Figure 29. North America Comprehensive Nursing Home Market Share by Country (2020-2031)
Figure 30. United States Comprehensive Nursing Home Market Size YoY Growth (2020-2031) & (US$ Million)
Figure 31. Canada Comprehensive Nursing Home Market Size YoY Growth (2020-2031) & (US$ Million)
Figure 32. Europe Comprehensive Nursing Home Market Size YoY Growth (2020-2031) & (US$ Million)
Figure 33. Europe Comprehensive Nursing Home Market Share by Country (2020-2031)
Figure 34. Germany Comprehensive Nursing Home Market Size YoY Growth (2020-2031) & (US$ Million)
Figure 35. France Comprehensive Nursing Home Market Size YoY Growth (2020-2031) & (US$ Million)
Figure 36. U.K. Comprehensive Nursing Home Market Size YoY Growth (2020-2031) & (US$ Million)
Figure 37. Italy Comprehensive Nursing Home Market Size YoY Growth (2020-2031) & (US$ Million)
Figure 38. Russia Comprehensive Nursing Home Market Size YoY Growth (2020-2031) & (US$ Million)
Figure 39. Ireland Comprehensive Nursing Home Market Size YoY Growth (2020-2031) & (US$ Million)
Figure 40. Asia-Pacific Comprehensive Nursing Home Market Size YoY Growth (2020-2031) & (US$ Million)
Figure 41. Asia-Pacific Comprehensive Nursing Home Market Share by Region (2020-2031)
Figure 42. China Comprehensive Nursing Home Market Size YoY Growth (2020-2031) & (US$ Million)
Figure 43. Japan Comprehensive Nursing Home Market Size YoY Growth (2020-2031) & (US$ Million)
Figure 44. South Korea Comprehensive Nursing Home Market Size YoY Growth (2020-2031) & (US$ Million)
Figure 45. Southeast Asia Comprehensive Nursing Home Market Size YoY Growth (2020-2031) & (US$ Million)
Figure 46. India Comprehensive Nursing Home Market Size YoY Growth (2020-2031) & (US$ Million)
Figure 47. Australia & New Zealand Comprehensive Nursing Home Market Size YoY Growth (2020-2031) & (US$ Million)
Figure 48. Latin America Comprehensive Nursing Home Market Size YoY Growth (2020-2031) & (US$ Million)
Figure 49. Latin America Comprehensive Nursing Home Market Share by Country (2020-2031)
Figure 50. Mexico Comprehensive Nursing Home Market Size YoY Growth (2020-2031) & (US$ Million)
Figure 51. Brazil Comprehensive Nursing Home Market Size YoY Growth (2020-2031) & (US$ Million)
Figure 52. Middle East & Africa Comprehensive Nursing Home Market Size YoY Growth (2020-2031) & (US$ Million)
Figure 53. Middle East & Africa Comprehensive Nursing Home Market Share by Country (2020-2031)
Figure 54. Israel Comprehensive Nursing Home Market Size YoY Growth (2020-2031) & (US$ Million)
Figure 55. Saudi Arabia Comprehensive Nursing Home Market Size YoY Growth (2020-2031) & (US$ Million)
Figure 56. UAE Comprehensive Nursing Home Market Size YoY Growth (2020-2031) & (US$ Million)
Figure 57. Visiting Angels Revenue Growth Rate in Comprehensive Nursing Home Business (2020-2025)
Figure 58. Columbia Pacific Management Co. Revenue Growth Rate in Comprehensive Nursing Home Business (2020-2025)
Figure 59. Emeritus Corporation Revenue Growth Rate in Comprehensive Nursing Home Business (2020-2025)
Figure 60. Watermark Retirement Communities, Inc. Revenue Growth Rate in Comprehensive Nursing Home Business (2020-2025)
Figure 61. Merrill Gardens Revenue Growth Rate in Comprehensive Nursing Home Business (2020-2025)
Figure 62. RIEI Revenue Growth Rate in Comprehensive Nursing Home Business (2020-2025)
Figure 63. Medical Care Service Company Inc. Revenue Growth Rate in Comprehensive Nursing Home Business (2020-2025)
Figure 64. RPEA Revenue Growth Rate in Comprehensive Nursing Home Business (2020-2025)
Figure 65. Colisee Revenue Growth Rate in Comprehensive Nursing Home Business (2020-2025)
Figure 66. Lendlease Revenue Growth Rate in Comprehensive Nursing Home Business (2020-2025)
Figure 67. Nichiigakkan Revenue Growth Rate in Comprehensive Nursing Home Business (2020-2025)
Figure 68. Sompo Holdings Revenue Growth Rate in Comprehensive Nursing Home Business (2020-2025)
Figure 69. Benesse Holdings Revenue Growth Rate in Comprehensive Nursing Home Business (2020-2025)
Figure 70. Health Solution Revenue Growth Rate in Comprehensive Nursing Home Business (2020-2025)
Figure 71. Taikang Home Revenue Growth Rate in Comprehensive Nursing Home Business (2020-2025)
Figure 72. Yihua Healthcare Revenue Growth Rate in Comprehensive Nursing Home Business (2020-2025)
Figure 73. Hunan Development Group Revenue Growth Rate in Comprehensive Nursing Home Business (2020-2025)
Figure 74. Langgao Elderly Service Revenue Growth Rate in Comprehensive Nursing Home Business (2020-2025)
Figure 75. Ainong Senior Care Technology Revenue Growth Rate in Comprehensive Nursing Home Business (2020-2025)
Figure 76. Yada Senior Living Group Revenue Growth Rate in Comprehensive Nursing Home Business (2020-2025)
Figure 77. Shengquan Group Revenue Growth Rate in Comprehensive Nursing Home Business (2020-2025)
Figure 78. Bottom-up and Top-down Approaches for This Report
Figure 79. Data Triangulation
Figure 80. Key Executives Interviewed