0
U.S. (TOLL FREE)
+1 (315) 215-3225
Automative

0
U.S. (TOLL FREE)
+1 (315) 215-3225
Perfusion Device for Blood Purification- Global Market Share and Ranking, Overall Sales and Demand Forecast 2026-2032
Published Date: 2026-01-13
|
Report Code: QYRE-Auto-23L19857
Home | Market Reports | Health| Medical Devices & Equipment
Perfusion Device for Blood Purification Global Market Share and Ranking Overall Sales and Demand Forecast 2026 2032
BUY CHAPTERS

Perfusion Device for Blood Purification- Global Market Share and Ranking, Overall Sales and Demand Forecast 2026-2032

Code: QYRE-Auto-23L19857
Report
2026-01-13
Pages:113
QYResearch
Buy Now with 15% Discount
DESCRIPTION
TABLE OF CONTENT
TABLES & FIGURES

Perfusion Device for Blood Purification- Market Size

The global market for Perfusion Device for Blood Purification was estimated to be worth US$ 1370 million in 2025 and is projected to reach US$ 2428 million, growing at a CAGR of 8.5% from 2026 to 2032.

Perfusion Device for Blood Purification- Market

Perfusion Device for Blood Purification- Market

The potential shifts in the 2025 U.S. tariff framework pose substantial volatility risks to global markets. This report provides a comprehensive assessment of recent tariff adjustments and international strategic countermeasures on Perfusion Device for Blood Purification cross-border industrial footprints, capital allocation patterns, regional economic interdependencies, and supply chain reconfigurations.
In 2025, global Perfusion Device for Blood Purification reached approximately 2,226.1 K units, with an average global market price of around 615.6 USD/unit.
Perfusion Device for Blood Purification refers to a specialized medical device core component that achieves blood purification by utilizing high-performance adsorbent materials (such as activated carbon, polymer resin) encapsulated in a biocompatible housing, functioning to selectively adsorb and remove specific toxic substances (including metabolic wastes, inflammatory factors, endotoxins, drugs, and toxins) from the blood through extracorporeal circulation. It is typically used in conjunction with blood purification equipment like hemodialysis machines, and common types include hemoperfusion cartridges, bilirubin adsorbers, and cytokine adsorption columns, which are widely applied in the treatment of end-stage renal disease, liver failure, sepsis, acute poisoning, and autoimmune diseases due to their high specificity and efficiency in toxin removal.
Demand for Perfusion Device for Blood Purification is primarily driven by the growing global prevalence of chronic diseases such as end-stage renal disease and liver failure, the expanding aging population, the rising incidence of acute critical conditions like sepsis and drug poisoning, as well as the improved accessibility of blood purification treatments supported by enhanced medical infrastructure and expanded medical insurance coverage. Additionally, the deepening clinical recognition of combined treatment regimens (e.g., "hemodialysis + hemoperfusion") and the increasing penetration of treatment in primary medical institutions further boost market demand. Business opportunities lie in developing high-performance adsorbent materials with enhanced specificity and biocompatibility, advancing the R&D of multi-functional perfusion devices for segmented clinical scenarios; promoting localized production to accelerate domestic substitution and reduce costs; constructing an integrated business model of "equipment + consumables + clinical services"; actively expanding overseas markets through obtaining international certifications; and exploring innovative applications in emerging fields such as sub-health regulation and anti-inflammatory therapy.
This report provides a comprehensive view of the global market for Perfusion Device for Blood Purification, covering total sales volume, sales revenue, pricing, the market share and ranking of key companies, along with analyses by region & country, by Adsorbent Material Type, and by Application.
The Perfusion Device for Blood Purification market size, estimations, and forecasts are presented in terms of sales volume (K Units) and revenue ($ millions), with 2025 as the base year and historical and forecast data from 2021 to 2032. The report combines quantitative and qualitative analysis to help readers develop growth strategies, assess the competitive landscape, evaluate their position in the current marketplace, and make informed business decisions regarding Perfusion Device for Blood Purification.
Market Segmentation

Scope of Perfusion Device for Blood Purification- Market Report

Report Metric Details
Report Name Perfusion Device for Blood Purification- Market
CAGR 8.5%
Segment by Adsorbent Material Type
  • Activated Carbon Perfusion Devices
  • Polymer Resin Perfusion Devices
  • Immunoadsorbent Perfusion Devices
  • Specific Toxin Adsorption Devices
Segment by Product Structure
  • Column-Type Perfusion Devices
  • Flat-Sheet Perfusion Devices
  • Hollow Fiber Perfusion Devices
Segment by Usage Mode
  • Disposable Perfusion Devices
  • Reusable Perfusion Devices
Segment by Application
  • Acute Drug/Toxin Poisoning Treatment
  • Uremia Complication Treatment
  • Liver Failure/Hepatic Encephalopathy Treatment
  • Sepsis/Inflammatory Storm Treatment
  • Autoimmune Disease Treatment
  • Others
By Region
  • North America (United States, Canada)
  • Europe (Germany, France, UK, Italy, Russia) Rest of Europe
  • Nordic Countries
  • Asia-Pacific (China, Japan, South Korea)
  • Southeast Asia (India, Australia)
  • Rest of Asia
  • Latin America (Mexico, Brazil)
  • Rest of Latin America
  • Middle East & Africa (Turkey, Saudi Arabia, UAE, Rest of MEA)
Consumption by Region
  • North America (United States, Canada)
  • Europe (Germany, France, UK, Italy, Russia)
  • Asia-Pacific (China, Japan, South Korea, Taiwan)
  • Southeast Asia (India)
  • Latin America (Mexico, Brazil)
By Company Baxter, Allmed Medical Care, Fresenius Medical Care, Asahi Kasei Medical, Nipro, Toray Medical, B. Braun, Nikkiso, WEGO, Jafron, Kangbei, Sansin, Tuoren
Forecast units USD million in value
Report coverage Revenue and volume forecast, company share, competitive landscape, growth factors and trends

Chapter Outline

  • Chapter 1: Introduces the scope of the report and the global market size (value, volume, and price). It also summarizes market dynamics and Recent Developments; identifies key drivers and restraints; outlines challenges and risks for manufacturers; reviews relevant industry policies and U.S. tariff implications.
  • Chapter 2: Provides a detailed analysis of the Perfusion Device for Blood Purification manufacturers' competitive landscape—including pricing, sales and revenue shares, Recent Developments plans, and mergers and acquisitions (M&A).
  • Chapter 3: Analyzes market segmentation by Adsorbent Material Type, presenting the size and growth potential of each segment to help readers identify blue-ocean opportunities.
  • Chapter 4: Analyzes market segmentation by Application, presenting the size and growth potential of each downstream segment to help readers identify blue-ocean opportunities.
  • Chapter 5: Presents Perfusion Device for Blood Purification sales and revenue at the regional level. It offers a quantitative assessment of market size and growth potential by region and summarizes market development, future prospects, addressable space, and country-level market size worldwide.
  • Chapter 6: Presents Perfusion Device for Blood Purification sales and revenue at the country level. It provides segmented data by Adsorbent Material Type and by Application for each country/region.
  • Chapter 7: Profiles key players, detailing the main companies' product sales, revenue, pricing, gross margin, product portfolios, Recent Developments, etc.
  • Chapter 8: Analyzes the industry value chain, including upstream suppliers and downstream applications/customers.
  • Chapter 9: Conclusion.

FAQ for this report

Who are the main players in the Perfusion Device for Blood Purification- Market report?

Ans: The main players in the Perfusion Device for Blood Purification- Market are Baxter, Allmed Medical Care, Fresenius Medical Care, Asahi Kasei Medical, Nipro, Toray Medical, B. Braun, Nikkiso, WEGO, Jafron, Kangbei, Sansin, Tuoren

What are the Application segmentation covered in the Perfusion Device for Blood Purification- Market report?

Ans: The Applications covered in the Perfusion Device for Blood Purification- Market report are Acute Drug/Toxin Poisoning Treatment, Uremia Complication Treatment, Liver Failure/Hepatic Encephalopathy Treatment, Sepsis/Inflammatory Storm Treatment, Autoimmune Disease Treatment, Others

What are the Type segmentation covered in the Perfusion Device for Blood Purification- Market report?

Ans: The Types covered in the Perfusion Device for Blood Purification- Market report are Activated Carbon Perfusion Devices, Polymer Resin Perfusion Devices, Immunoadsorbent Perfusion Devices, Specific Toxin Adsorption Devices

1 Market Overview
1.1 Perfusion Device for Blood Purification Product Introduction
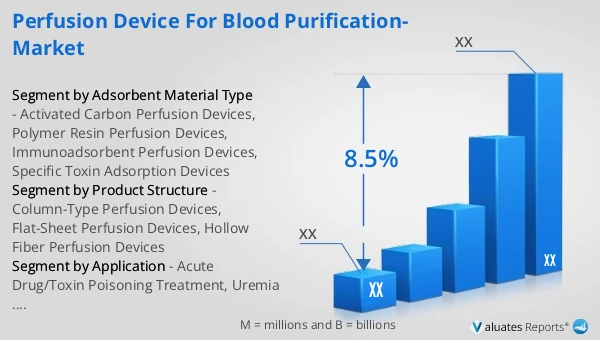
1.2 Global Perfusion Device for Blood Purification Market Size Forecast
1.2.1 Global Perfusion Device for Blood Purification Sales Value (2021–2032)
1.2.2 Global Perfusion Device for Blood Purification Sales Volume (2021–2032)
1.2.3 Global Perfusion Device for Blood Purification Sales Price (2021–2032)
1.3 Perfusion Device for Blood Purification Market Trends & Drivers
1.3.1 Perfusion Device for Blood Purification Industry Trends
1.3.2 Perfusion Device for Blood Purification Market Drivers & Opportunities
1.3.3 Perfusion Device for Blood Purification Market Challenges
1.3.4 Perfusion Device for Blood Purification Market Restraints
1.3.5 Impact of U.S. Tariffs
1.4 Assumptions and Limitations
1.5 Study Objectives
1.6 Years Considered
2 Competitive Analysis by Company
2.1 Global Perfusion Device for Blood Purification Players Revenue Ranking (2025)
2.2 Global Perfusion Device for Blood Purification Revenue by Company (2021–2026)
2.3 Global Perfusion Device for Blood Purification Sales Volume Ranking of Players (2025)
2.4 Global Perfusion Device for Blood Purification Sales Volume by Company (2021–2026)
2.5 Global Perfusion Device for Blood Purification Average Price by Company (2021–2026)
2.6 Key Manufacturers Perfusion Device for Blood Purification Manufacturing Base and Headquarters
2.7 Key Manufacturers Perfusion Device for Blood Purification Product Offerings
2.8 Key Manufacturers Start of Mass Production of Perfusion Device for Blood Purification
2.9 Perfusion Device for Blood Purification Market Competitive Analysis
2.9.1 Perfusion Device for Blood Purification Market Concentration Rate (2021–2026)
2.9.2 Global 5 and 10 Largest Manufacturers by Perfusion Device for Blood Purification Revenue in 2025
2.9.3 Global Companies by Tier (Tier 1, Tier 2, Tier 3), based on Perfusion Device for Blood Purification revenue, 2025
2.10 Mergers & Acquisitions and Expansion
3 Segmentation Perfusion Device for Blood Purification Market Classification
3.1 Introduction by Adsorbent Material Type
3.1.1 Activated Carbon Perfusion Devices
3.1.2 Polymer Resin Perfusion Devices
3.1.3 Immunoadsorbent Perfusion Devices
3.1.4 Specific Toxin Adsorption Devices
3.1.5 Global Perfusion Device for Blood Purification Sales Value by Adsorbent Material Type
3.1.5.1 Global Perfusion Device for Blood Purification Sales Value by Adsorbent Material Type (2021 vs 2025 vs 2032)
3.1.5.2 Global Perfusion Device for Blood Purification Sales Value, by Adsorbent Material Type (2021–2032)
3.1.5.3 Global Perfusion Device for Blood Purification Sales Value, by Adsorbent Material Type (%), 2021–2032
3.1.6 Global Perfusion Device for Blood Purification Sales Volume by Adsorbent Material Type
3.1.6.1 Global Perfusion Device for Blood Purification Sales Volume by Adsorbent Material Type (2021 vs 2025 vs 2032)
3.1.6.2 Global Perfusion Device for Blood Purification Sales Volume, by Adsorbent Material Type (2021–2032)
3.1.6.3 Global Perfusion Device for Blood Purification Sales Volume, by Adsorbent Material Type (%), 2021–2032
3.1.7 Global Perfusion Device for Blood Purification Average Price by Adsorbent Material Type (2021–2032)
3.2 Introduction by Product Structure
3.2.1 Column-Type Perfusion Devices
3.2.2 Flat-Sheet Perfusion Devices
3.2.3 Hollow Fiber Perfusion Devices
3.2.4 Global Perfusion Device for Blood Purification Sales Value by Product Structure
3.2.4.1 Global Perfusion Device for Blood Purification Sales Value by Product Structure (2021 vs 2025 vs 2032)
3.2.4.2 Global Perfusion Device for Blood Purification Sales Value, by Product Structure (2021–2032)
3.2.4.3 Global Perfusion Device for Blood Purification Sales Value, by Product Structure (%), 2021–2032
3.2.5 Global Perfusion Device for Blood Purification Sales Volume by Product Structure
3.2.5.1 Global Perfusion Device for Blood Purification Sales Volume by Product Structure (2021 vs 2025 vs 2032)
3.2.5.2 Global Perfusion Device for Blood Purification Sales Volume, by Product Structure (2021–2032)
3.2.5.3 Global Perfusion Device for Blood Purification Sales Volume, by Product Structure (%), 2021–2032
3.2.6 Global Perfusion Device for Blood Purification Average Price by Product Structure (2021–2032)
3.3 Introduction by Usage Mode
3.3.1 Disposable Perfusion Devices
3.3.2 Reusable Perfusion Devices
3.3.3 Global Perfusion Device for Blood Purification Sales Value by Usage Mode
3.3.3.1 Global Perfusion Device for Blood Purification Sales Value by Usage Mode (2021 vs 2025 vs 2032)
3.3.3.2 Global Perfusion Device for Blood Purification Sales Value, by Usage Mode (2021–2032)
3.3.3.3 Global Perfusion Device for Blood Purification Sales Value, by Usage Mode (%), 2021–2032
3.3.4 Global Perfusion Device for Blood Purification Sales Volume by Usage Mode
3.3.4.1 Global Perfusion Device for Blood Purification Sales Volume by Usage Mode (2021 vs 2025 vs 2032)
3.3.4.2 Global Perfusion Device for Blood Purification Sales Volume, by Usage Mode (2021–2032)
3.3.4.3 Global Perfusion Device for Blood Purification Sales Volume, by Usage Mode (%), 2021–2032
3.3.5 Global Perfusion Device for Blood Purification Average Price by Usage Mode (2021–2032)
4 Segmentation by Application
4.1 Introduction by Application
4.1.1 Acute Drug/Toxin Poisoning Treatment
4.1.2 Uremia Complication Treatment
4.1.3 Liver Failure/Hepatic Encephalopathy Treatment
4.1.4 Sepsis/Inflammatory Storm Treatment
4.1.5 Autoimmune Disease Treatment
4.1.6 Others
4.2 Global Perfusion Device for Blood Purification Sales Value by Application
4.2.1 Global Perfusion Device for Blood Purification Sales Value by Application (2021 vs 2025 vs 2032)
4.2.2 Global Perfusion Device for Blood Purification Sales Value, by Application (2021–2032)
4.2.3 Global Perfusion Device for Blood Purification Sales Value, by Application (%), 2021–2032
4.3 Global Perfusion Device for Blood Purification Sales Volume by Application
4.3.1 Global Perfusion Device for Blood Purification Sales Volume by Application (2021 vs 2025 vs 2032)
4.3.2 Global Perfusion Device for Blood Purification Sales Volume, by Application (2021–2032)
4.3.3 Global Perfusion Device for Blood Purification Sales Volume, by Application (%), 2021–2032
4.4 Global Perfusion Device for Blood Purification Average Price by Application (2021–2032)
5 Segmentation by Region
5.1 Global Perfusion Device for Blood Purification Sales Value by Region
5.1.1 Global Perfusion Device for Blood Purification Sales Value by Region: 2021 vs 2025 vs 2032
5.1.2 Global Perfusion Device for Blood Purification Sales Value by Region (2021–2026)
5.1.3 Global Perfusion Device for Blood Purification Sales Value by Region (2027–2032)
5.1.4 Global Perfusion Device for Blood Purification Sales Value by Region (%), 2021–2032
5.2 Global Perfusion Device for Blood Purification Sales Volume by Region
5.2.1 Global Perfusion Device for Blood Purification Sales Volume by Region: 2021 vs 2025 vs 2032
5.2.2 Global Perfusion Device for Blood Purification Sales Volume by Region (2021–2026)
5.2.3 Global Perfusion Device for Blood Purification Sales Volume by Region (2027–2032)
5.2.4 Global Perfusion Device for Blood Purification Sales Volume by Region (%), 2021–2032
5.3 Global Perfusion Device for Blood Purification Average Price by Region (2021–2032)
5.4 North America
5.4.1 North America Perfusion Device for Blood Purification Sales Value, 2021–2032
5.4.2 North America Perfusion Device for Blood Purification Sales Value by Country (%), 2025 vs 2032
5.5 Europe
5.5.1 Europe Perfusion Device for Blood Purification Sales Value, 2021–2032
5.5.2 Europe Perfusion Device for Blood Purification Sales Value by Country (%), 2025 vs 2032
5.6 Asia Pacific
5.6.1 Asia Pacific Perfusion Device for Blood Purification Sales Value, 2021–2032
5.6.2 Asia Pacific Perfusion Device for Blood Purification Sales Value by Region (%), 2025 vs 2032
5.7 South America
5.7.1 South America Perfusion Device for Blood Purification Sales Value, 2021–2032
5.7.2 South America Perfusion Device for Blood Purification Sales Value by Country (%), 2025 vs 2032
5.8 Middle East & Africa
5.8.1 Middle East & Africa Perfusion Device for Blood Purification Sales Value, 2021–2032
5.8.2 Middle East & Africa Perfusion Device for Blood Purification Sales Value by Country (%), 2025 vs 2032
6 Segmentation by Key Countries/Regions
6.1 Key Countries/Regions Perfusion Device for Blood Purification Sales Value Growth Trends, 2021 vs 2025 vs 2032
6.2 Key Countries/Regions Perfusion Device for Blood Purification Sales Value and Sales Volume
6.2.1 Key Countries/Regions Perfusion Device for Blood Purification Sales Value, 2021–2032
6.2.2 Key Countries/Regions Perfusion Device for Blood Purification Sales Volume, 2021–2032
6.3 United States
6.3.1 United States Perfusion Device for Blood Purification Sales Value, 2021–2032
6.3.2 United States Perfusion Device for Blood Purification Sales Value by Adsorbent Material Type (%), 2025 vs 2032
6.3.3 United States Perfusion Device for Blood Purification Sales Value by Application, 2025 vs 2032
6.4 Europe
6.4.1 Europe Perfusion Device for Blood Purification Sales Value, 2021–2032
6.4.2 Europe Perfusion Device for Blood Purification Sales Value by Adsorbent Material Type (%), 2025 vs 2032
6.4.3 Europe Perfusion Device for Blood Purification Sales Value by Application, 2025 vs 2032
6.5 China
6.5.1 China Perfusion Device for Blood Purification Sales Value, 2021–2032
6.5.2 China Perfusion Device for Blood Purification Sales Value by Adsorbent Material Type (%), 2025 vs 2032
6.5.3 China Perfusion Device for Blood Purification Sales Value by Application, 2025 vs 2032
6.6 Japan
6.6.1 Japan Perfusion Device for Blood Purification Sales Value, 2021–2032
6.6.2 Japan Perfusion Device for Blood Purification Sales Value by Adsorbent Material Type (%), 2025 vs 2032
6.6.3 Japan Perfusion Device for Blood Purification Sales Value by Application, 2025 vs 2032
6.7 South Korea
6.7.1 South Korea Perfusion Device for Blood Purification Sales Value, 2021–2032
6.7.2 South Korea Perfusion Device for Blood Purification Sales Value by Adsorbent Material Type (%), 2025 vs 2032
6.7.3 South Korea Perfusion Device for Blood Purification Sales Value by Application, 2025 vs 2032
6.8 Southeast Asia
6.8.1 Southeast Asia Perfusion Device for Blood Purification Sales Value, 2021–2032
6.8.2 Southeast Asia Perfusion Device for Blood Purification Sales Value by Adsorbent Material Type (%), 2025 vs 2032
6.8.3 Southeast Asia Perfusion Device for Blood Purification Sales Value by Application, 2025 vs 2032
6.9 India
6.9.1 India Perfusion Device for Blood Purification Sales Value, 2021–2032
6.9.2 India Perfusion Device for Blood Purification Sales Value by Adsorbent Material Type (%), 2025 vs 2032
6.9.3 India Perfusion Device for Blood Purification Sales Value by Application, 2025 vs 2032
7 Company Profiles
7.1 Baxter
7.1.1 Baxter Company Information
7.1.2 Baxter Introduction and Business Overview
7.1.3 Baxter Perfusion Device for Blood Purification Sales, Revenue, Price and Gross Margin (2021–2026)
7.1.4 Baxter Perfusion Device for Blood Purification Product Offerings
7.1.5 Baxter Recent Developments
7.2 Allmed Medical Care
7.2.1 Allmed Medical Care Company Information
7.2.2 Allmed Medical Care Introduction and Business Overview
7.2.3 Allmed Medical Care Perfusion Device for Blood Purification Sales, Revenue, Price and Gross Margin (2021–2026)
7.2.4 Allmed Medical Care Perfusion Device for Blood Purification Product Offerings
7.2.5 Allmed Medical Care Recent Developments
7.3 Fresenius Medical Care
7.3.1 Fresenius Medical Care Company Information
7.3.2 Fresenius Medical Care Introduction and Business Overview
7.3.3 Fresenius Medical Care Perfusion Device for Blood Purification Sales, Revenue, Price and Gross Margin (2021–2026)
7.3.4 Fresenius Medical Care Perfusion Device for Blood Purification Product Offerings
7.3.5 Fresenius Medical Care Recent Developments
7.4 Asahi Kasei Medical
7.4.1 Asahi Kasei Medical Company Information
7.4.2 Asahi Kasei Medical Introduction and Business Overview
7.4.3 Asahi Kasei Medical Perfusion Device for Blood Purification Sales, Revenue, Price and Gross Margin (2021–2026)
7.4.4 Asahi Kasei Medical Perfusion Device for Blood Purification Product Offerings
7.4.5 Asahi Kasei Medical Recent Developments
7.5 Nipro
7.5.1 Nipro Company Information
7.5.2 Nipro Introduction and Business Overview
7.5.3 Nipro Perfusion Device for Blood Purification Sales, Revenue, Price and Gross Margin (2021–2026)
7.5.4 Nipro Perfusion Device for Blood Purification Product Offerings
7.5.5 Nipro Recent Developments
7.6 Toray Medical
7.6.1 Toray Medical Company Information
7.6.2 Toray Medical Introduction and Business Overview
7.6.3 Toray Medical Perfusion Device for Blood Purification Sales, Revenue, Price and Gross Margin (2021–2026)
7.6.4 Toray Medical Perfusion Device for Blood Purification Product Offerings
7.6.5 Toray Medical Recent Developments
7.7 B. Braun
7.7.1 B. Braun Company Information
7.7.2 B. Braun Introduction and Business Overview
7.7.3 B. Braun Perfusion Device for Blood Purification Sales, Revenue, Price and Gross Margin (2021–2026)
7.7.4 B. Braun Perfusion Device for Blood Purification Product Offerings
7.7.5 B. Braun Recent Developments
7.8 Nikkiso
7.8.1 Nikkiso Company Information
7.8.2 Nikkiso Introduction and Business Overview
7.8.3 Nikkiso Perfusion Device for Blood Purification Sales, Revenue, Price and Gross Margin (2021–2026)
7.8.4 Nikkiso Perfusion Device for Blood Purification Product Offerings
7.8.5 Nikkiso Recent Developments
7.9 WEGO
7.9.1 WEGO Company Information
7.9.2 WEGO Introduction and Business Overview
7.9.3 WEGO Perfusion Device for Blood Purification Sales, Revenue, Price and Gross Margin (2021–2026)
7.9.4 WEGO Perfusion Device for Blood Purification Product Offerings
7.9.5 WEGO Recent Developments
7.10 Jafron
7.10.1 Jafron Company Information
7.10.2 Jafron Introduction and Business Overview
7.10.3 Jafron Perfusion Device for Blood Purification Sales, Revenue, Price and Gross Margin (2021–2026)
7.10.4 Jafron Perfusion Device for Blood Purification Product Offerings
7.10.5 Jafron Recent Developments
7.11 Kangbei
7.11.1 Kangbei Company Information
7.11.2 Kangbei Introduction and Business Overview
7.11.3 Kangbei Perfusion Device for Blood Purification Sales, Revenue, Price and Gross Margin (2021–2026)
7.11.4 Kangbei Perfusion Device for Blood Purification Product Offerings
7.11.5 Kangbei Recent Developments
7.12 Sansin
7.12.1 Sansin Company Information
7.12.2 Sansin Introduction and Business Overview
7.12.3 Sansin Perfusion Device for Blood Purification Sales, Revenue, Price and Gross Margin (2021–2026)
7.12.4 Sansin Perfusion Device for Blood Purification Product Offerings
7.12.5 Sansin Recent Developments
7.13 Tuoren
7.13.1 Tuoren Company Information
7.13.2 Tuoren Introduction and Business Overview
7.13.3 Tuoren Perfusion Device for Blood Purification Sales, Revenue, Price and Gross Margin (2021–2026)
7.13.4 Tuoren Perfusion Device for Blood Purification Product Offerings
7.13.5 Tuoren Recent Developments
8 Industry Chain Analysis
8.1 Perfusion Device for Blood Purification Industrial Chain
8.2 Perfusion Device for Blood Purification Upstream Analysis
8.2.1 Key Raw Materials
8.2.2 Key Suppliers of Raw Materials
8.2.3 Manufacturing Cost Structure
8.3 Midstream Analysis
8.4 Downstream Analysis (Customer Analysis)
8.5 Sales Model and Sales Channelss
8.5.1 Perfusion Device for Blood Purification Sales Model
8.5.2 Sales Channels
8.5.3 Perfusion Device for Blood Purification Distributors
9 Research Findings and Conclusion
10 Appendix
10.1 Research Methodology
10.1.1 Methodology/Research Approach
10.1.1.1 Research Programs/Design
10.1.1.2 Market Size Estimation
10.1.1.3 Market Breakdown and Data Triangulation
10.1.2 Data Source
10.1.2.1 Secondary Sources
10.1.2.2 Primary Sources
10.2 Author Details
10.3 Disclaimer
List of Tables
 Table 1. Perfusion Device for Blood Purification Market Trends
 Table 2. Perfusion Device for Blood Purification Market Drivers & Opportunities
 Table 3. Perfusion Device for Blood Purification Market Challenges
 Table 4. Perfusion Device for Blood Purification Market Restraints


List of Figures
 Figure 1. Perfusion Device for Blood Purification Product Picture
 Figure 2. Global Perfusion Device for Blood Purification Sales Value, 2021 vs 2025 vs 2032 (US$ Million)
 Figure 3. Global Perfusion Device for Blood Purification Sales Value (US$ Million), 2021–2032
 Figure 4. Global Perfusion Device for Blood Purification Sales Volume (K Units), 2021–2032
 Figure 5. Global Perfusion Device for Blood Purification Sales Price (US$/Unit), 2021–2032
 Figure 6. Perfusion Device for Blood Purification Report Years Considered
 Figure 7. Global Perfusion Device for Blood Purification Players Revenue Ranking (US$ Million), 2025
 Figure 8. Global Perfusion Device for Blood Purification Sales Volume Ranking of Players (K Units), 2025
 Figure 9. The 5 and 10 Largest Manufacturers in the World: Market Share by Perfusion Device for Blood Purification Revenue in 2025
 Figure 10. Perfusion Device for Blood Purification Market Share by Company Type (Tier 1, Tier 2, and Tier 3): 2021 vs 2025
 Figure 11. Activated Carbon Perfusion Devices Picture
 Figure 12. Polymer Resin Perfusion Devices Picture
 Figure 13. Immunoadsorbent Perfusion Devices Picture
 Figure 14. Specific Toxin Adsorption Devices Picture
 Figure 15. Global Perfusion Device for Blood Purification Sales Value by Adsorbent Material Type (US$ Million), 2021 vs 2025 vs 2032
 Figure 16. Global Perfusion Device for Blood Purification Sales Value Market Share by Adsorbent Material Type, 2025 & 2032
 Figure 17. Global Perfusion Device for Blood Purification Sales Volume by Adsorbent Material Type (K Units), 2021 vs 2025 vs 2032
 Figure 18. Global Perfusion Device for Blood Purification Sales Volume Market Share by Adsorbent Material Type, 2025 & 2032
 Figure 19. Global Perfusion Device for Blood Purification Price by Adsorbent Material Type (US$/Unit), 2021–2032
 Figure 20. Column-Type Perfusion Devices Picture
 Figure 21. Flat-Sheet Perfusion Devices Picture
 Figure 22. Hollow Fiber Perfusion Devices Picture
 Figure 23. Global Perfusion Device for Blood Purification Sales Value by Product Structure (US$ Million), 2021 vs 2025 vs 2032
 Figure 24. Global Perfusion Device for Blood Purification Sales Value Market Share by Product Structure, 2025 & 2032
 Figure 25. Global Perfusion Device for Blood Purification Sales Volume by Product Structure (K Units), 2021 vs 2025 vs 2032
 Figure 26. Global Perfusion Device for Blood Purification Sales Volume Market Share by Product Structure, 2025 & 2032
 Figure 27. Global Perfusion Device for Blood Purification Price by Product Structure (US$/Unit), 2021–2032
 Figure 28. Disposable Perfusion Devices Picture
 Figure 29. Reusable Perfusion Devices Picture
 Figure 30. Global Perfusion Device for Blood Purification Sales Value by Usage Mode (US$ Million), 2021 vs 2025 vs 2032
 Figure 31. Global Perfusion Device for Blood Purification Sales Value Market Share by Usage Mode, 2025 & 2032
 Figure 32. Global Perfusion Device for Blood Purification Sales Volume by Usage Mode (K Units), 2021 vs 2025 vs 2032
 Figure 33. Global Perfusion Device for Blood Purification Sales Volume Market Share by Usage Mode, 2025 & 2032
 Figure 34. Global Perfusion Device for Blood Purification Price by Usage Mode (US$/Unit), 2021–2032
 Figure 35. Product Picture of Acute Drug/Toxin Poisoning Treatment
 Figure 36. Product Picture of Uremia Complication Treatment
 Figure 37. Product Picture of Liver Failure/Hepatic Encephalopathy Treatment
 Figure 38. Product Picture of Sepsis/Inflammatory Storm Treatment
 Figure 39. Product Picture of Autoimmune Disease Treatment
 Figure 40. Product Picture of Others
 Figure 41. Global Perfusion Device for Blood Purification Sales Value by Application (US$ Million), 2021 vs 2025 vs 2032
 Figure 42. Global Perfusion Device for Blood Purification Sales Value Market Share by Application, 2025 & 2032
 Figure 43. Global Perfusion Device for Blood Purification Sales Volume by Application (K Units), 2021 vs 2025 vs 2032
 Figure 44. Global Perfusion Device for Blood Purification Sales Volume Market Share by Application, 2025 & 2032
 Figure 45. Global Perfusion Device for Blood Purification Price by Application (US$/Unit), 2021–2032
 Figure 46. North America Perfusion Device for Blood Purification Sales Value (US$ Million), 2021–2032
 Figure 47. North America Perfusion Device for Blood Purification Sales Value by Country (%), 2025 vs 2032
 Figure 48. Europe Perfusion Device for Blood Purification Sales Value (US$ Million), 2021–2032
 Figure 49. Europe Perfusion Device for Blood Purification Sales Value by Country (%), 2025 vs 2032
 Figure 50. Asia Pacific Perfusion Device for Blood Purification Sales Value (US$ Million), 2021–2032
 Figure 51. Asia Pacific Perfusion Device for Blood Purification Sales Value by Region (%), 2025 vs 2032
 Figure 52. South America Perfusion Device for Blood Purification Sales Value (US$ Million), 2021–2032
 Figure 53. South America Perfusion Device for Blood Purification Sales Value by Country (%), 2025 vs 2032
 Figure 54. Middle East & Africa Perfusion Device for Blood Purification Sales Value (US$ Million), 2021–2032
 Figure 55. Middle East & Africa Perfusion Device for Blood Purification Sales Value by Country (%), 2025 vs 2032
 Figure 56. Key Countries/Regions Perfusion Device for Blood Purification Sales Value (%), 2021–2032
 Figure 57. Key Countries/Regions Perfusion Device for Blood Purification Sales Volume (%), 2021–2032
 Figure 58. United States Perfusion Device for Blood Purification Sales Value (US$ Million), 2021–2032
 Figure 59. United States Perfusion Device for Blood Purification Sales Value by Adsorbent Material Type (%), 2025 vs 2032
 Figure 60. United States Perfusion Device for Blood Purification Sales Value by Application (%), 2025 vs 2032
 Figure 61. Europe Perfusion Device for Blood Purification Sales Value (US$ Million), 2021–2032
 Figure 62. Europe Perfusion Device for Blood Purification Sales Value by Adsorbent Material Type (%), 2025 vs 2032
 Figure 63. Europe Perfusion Device for Blood Purification Sales Value by Application (%), 2025 vs 2032
 Figure 64. China Perfusion Device for Blood Purification Sales Value (US$ Million), 2021–2032
 Figure 65. China Perfusion Device for Blood Purification Sales Value by Adsorbent Material Type (%), 2025 vs 2032
 Figure 66. China Perfusion Device for Blood Purification Sales Value by Application (%), 2025 vs 2032
 Figure 67. Japan Perfusion Device for Blood Purification Sales Value (US$ Million), 2021–2032
 Figure 68. Japan Perfusion Device for Blood Purification Sales Value by Adsorbent Material Type (%), 2025 vs 2032
 Figure 69. Japan Perfusion Device for Blood Purification Sales Value by Application (%), 2025 vs 2032
 Figure 70. South Korea Perfusion Device for Blood Purification Sales Value (US$ Million), 2021–2032
 Figure 71. South Korea Perfusion Device for Blood Purification Sales Value by Adsorbent Material Type (%), 2025 vs 2032
 Figure 72. South Korea Perfusion Device for Blood Purification Sales Value by Application (%), 2025 vs 2032
 Figure 73. Southeast Asia Perfusion Device for Blood Purification Sales Value (US$ Million), 2021–2032
 Figure 74. Southeast Asia Perfusion Device for Blood Purification Sales Value by Adsorbent Material Type (%), 2025 vs 2032
 Figure 75. Southeast Asia Perfusion Device for Blood Purification Sales Value by Application (%), 2025 vs 2032
 Figure 76. India Perfusion Device for Blood Purification Sales Value (US$ Million), 2021–2032
 Figure 77. India Perfusion Device for Blood Purification Sales Value by Adsorbent Material Type (%), 2025 vs 2032
 Figure 78. India Perfusion Device for Blood Purification Sales Value by Application (%), 2025 vs 2032
 Figure 79. Perfusion Device for Blood Purification Industrial Chain
 Figure 80. Perfusion Device for Blood Purification Manufacturing Cost Structure
 Figure 81. Channels of Distribution (Direct Sales, and Distribution)
 Figure 82. Bottom-up and Top-down Approaches for This Report
 Figure 83. Data Triangulation
 Figure 84. Key Executives Interviewed
SELECT A FORMAT
Added to Cart
Electronic

$3950

Single User License
Electronic

$5925

Multi User License
Electronic

$7900

Enterprise License
Add to Cart
Buy Now (15% Discount)

OUR CUSTOMER

Samsung SD

SIMILAR REPORTS