Ans: The SSD Rigid-Flex PCB Market witnessing a CAGR of 6.8% during the forecast period 2026-2032.

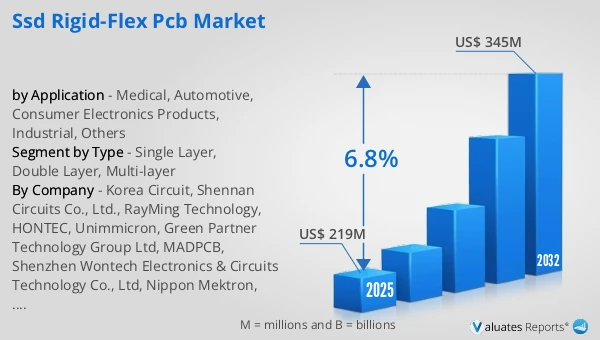
The global SSD Rigid-Flex PCB market was valued at US$ 219 million in 2025 and is anticipated to reach US$ 345 million by 2032, at a CAGR of 6.8% from 2026 to 2032.
The SSD Rigid-Flex PCB Market is experiencing sustained market growth as manufacturers of data storage devices increasingly prioritize compact designs, higher reliability, and improved electrical performance. The rapid expansion of solid-state storage across consumer electronics, enterprise computing, automotive electronics, industrial automation systems, and medical devices continues to influence market size and adoption patterns. One of the key market trends shaping industry development is the growing need for high-density interconnect solutions capable of supporting faster data transmission while reducing overall device footprint. SSD manufacturers are integrating advanced rigid-flex printed circuit board architectures to improve durability, optimize space utilization, and enhance signal integrity in increasingly compact storage devices. The ongoing evolution of data centers, edge computing infrastructure, artificial intelligence applications, and high-performance computing platforms is contributing to higher demand for advanced storage technologies, creating favorable conditions for SSD rigid-flex PCB adoption. In addition, advancements in flexible circuit materials, precision manufacturing technologies, and automated assembly processes are supporting product innovation throughout the value chain. Regulatory requirements related to electronic reliability, quality assurance, and environmental compliance are also encouraging manufacturers to invest in advanced PCB technologies. As a result, market size expansion is being supported by both technological advancements and growing deployment of SSD-based storage systems across multiple industries.
Within the market segmentation by type, multi-layer rigid-flex PCBs account for a significant portion of market share due to their ability to accommodate complex circuitry, support high-speed data transmission, and enable compact SSD designs. As SSDs continue to evolve toward higher storage capacities and faster performance standards, manufacturers increasingly require advanced PCB structures capable of integrating multiple signal and power layers within limited space constraints. Multi-layer configurations offer advantages in signal integrity, electromagnetic interference management, thermal performance, and component density, making them particularly suitable for enterprise SSDs and high-performance storage applications. Double-layer rigid-flex PCBs also maintain a substantial presence across mainstream SSD manufacturing, providing a balance between performance requirements and production costs. These designs are widely adopted in commercial and consumer storage devices where moderate complexity and reliable connectivity are essential. Single-layer rigid-flex PCBs continue to serve specialized applications that require simplified circuit architectures, lightweight construction, and cost-effective production. Market trends indicate increasing adoption of advanced multi-layer technologies as SSD manufacturers pursue miniaturization, enhanced durability, and higher data transfer capabilities. The resulting shift toward sophisticated PCB architectures continues to influence market growth and competitive differentiation across the industry.
Application analysis reveals that consumer electronics products represent one of the largest contributors to market share due to widespread SSD deployment in laptops, gaming systems, tablets, smartphones, portable storage devices, and other connected electronics. Consumer demand for faster boot times, improved storage performance, lower power consumption, and compact product designs has encouraged manufacturers to integrate SSD technologies across a broad range of devices. Automotive applications are emerging as an important area of market growth as modern vehicles increasingly rely on advanced electronic systems, infotainment platforms, autonomous driving technologies, digital cockpit solutions, and vehicle data storage functions. The growing electrification of transportation is further supporting demand for high-reliability electronic components, including rigid-flex PCB solutions. Medical applications also contribute significantly to market development, particularly in diagnostic equipment, portable medical devices, patient monitoring systems, and imaging technologies where compact and highly reliable electronic assemblies are required. Industrial applications continue to expand as automation systems, robotics, industrial control equipment, and smart manufacturing platforms adopt advanced storage technologies to support operational efficiency and data management requirements. Other applications, including telecommunications infrastructure and specialized electronic systems, further diversify demand patterns. The broad adoption of SSDs across these sectors remains a key driver of market growth and evolving market trends.
The competitive landscape of the SSD Rigid-Flex PCB Market consists of several established industry players with extensive manufacturing capabilities, technological expertise, and global customer networks. Korea Circuit has developed strong capabilities in advanced PCB manufacturing and serves multiple high-technology industries requiring sophisticated circuit solutions. Shennan Circuits Co., Ltd. is recognized for its extensive PCB portfolio and ongoing investments in advanced manufacturing technologies that support high-performance electronic applications. RayMing Technology and HONTEC have expanded their offerings in rigid-flex and high-density PCB solutions, addressing the requirements of increasingly complex electronic products. Unimicron and Nippon Mektron are among the prominent market participants with significant experience in advanced PCB production and global supply chain integration. Young Poong Group and Samsung Electro-Mechanics maintain strong positions within the electronics manufacturing ecosystem through continuous investments in research, production capabilities, and technological development. Green Partner Technology Group Ltd, MADPCB, and Shenzhen Wontech Electronics & Circuits Technology Co., Ltd contribute to market competitiveness through specialized manufacturing expertise and customer-focused product development strategies. Across the industry, companies are emphasizing process automation, manufacturing precision, advanced materials adoption, and capacity expansion to address increasing customer requirements. Strategic investments in high-density interconnect technologies, miniaturization capabilities, and quality assurance systems continue to influence market share dynamics and support overall market growth.
From a regional perspective, Asia-Pacific represents the largest market share owing to its concentration of electronics manufacturing facilities, semiconductor production ecosystems, and storage device assembly operations. China, Japan, South Korea, and Taiwan collectively play critical roles in global SSD production and supply chain activities, supporting strong regional demand for advanced rigid-flex PCB solutions. South Korea and Japan benefit from established electronics industries and technological leadership in storage technologies, while China continues to strengthen its manufacturing capabilities through ongoing investments in semiconductor and electronics production infrastructure. North America remains an important market driven by data center expansion, enterprise storage demand, cloud computing investments, and advanced technology development activities. Europe maintains a significant presence supported by automotive electronics manufacturing, industrial automation initiatives, and increasing adoption of digital technologies. Emerging demand across Southeast Asia, particularly in India, reflects growing electronics manufacturing investments and expanding technology infrastructure. Latin America, led by Mexico and Brazil, continues to benefit from increasing electronics production and industrial modernization efforts. Looking ahead, the market forecast remains influenced by continued SSD adoption, advances in storage architecture, increasing demand for compact electronic systems, and ongoing investments in high-performance computing infrastructure. Emerging technologies such as artificial intelligence, edge computing, autonomous systems, and next-generation consumer electronics are expected to create additional opportunities for advanced rigid-flex PCB solutions. Continued innovation in materials science, manufacturing automation, thermal management technologies, and high-density circuit integration is likely to shape future market trends, strengthen market growth prospects, and influence market share development across the global SSD Rigid-Flex PCB Market.
https://reports.valuates.com/market-reports/QYRE-Auto-21V7048/global-co2-generator-sales
Trends
The CO2 Generator Market is witnessing steady market growth as commercial growers increasingly adopt controlled environment agriculture (CEA) techniques to improve crop productivity, resource efficiency, and production consistency. Rising demand for fresh vegetables and fruits throughout the year is encouraging investments in greenhouses, indoor farming facilities, hydroponic systems, and other protected cultivation environments where carbon dioxide enrichment plays an important role in enhancing plant growth. One of the most significant market trends is the growing emphasis on maximizing crop yields from limited cultivation space while reducing exposure to unpredictable weather conditions and environmental stresses. CO2 generators are increasingly being integrated into greenhouse operations to maintain optimal carbon dioxide concentrations that support photosynthesis and plant development. Advances in greenhouse automation, climate control technologies, environmental monitoring systems, and precision agriculture practices are further supporting adoption across commercial cultivation facilities. In addition, increasing awareness among growers regarding the relationship between CO2 supplementation and crop productivity is contributing to market expansion. Supply chain modernization within the horticulture industry, coupled with investments in food security initiatives and sustainable agricultural production, continues to influence market size and long-term industry development. As controlled cultivation methods gain wider acceptance across both developed and emerging agricultural markets, demand for reliable CO2 generation systems is expected to remain an important component of greenhouse infrastructure investments.
Among the major product categories, natural gas CO2 generators account for a substantial share of the market due to their widespread availability, relatively lower operating costs in many regions, and suitability for large-scale greenhouse operations. Commercial growers often prefer natural gas-based systems because they can provide a continuous and efficient source of carbon dioxide while supporting stable greenhouse climate management. Propane CO2 generators also maintain a significant position within the market, particularly in locations where natural gas infrastructure is limited or unavailable. Their operational flexibility and ease of installation make them attractive for a broad range of greenhouse applications. Multi-fuel infrared CO2 generators are gaining increased attention as growers seek equipment capable of delivering greater fuel flexibility, cleaner combustion, and enhanced energy efficiency. These systems are particularly valued in modern controlled environment agriculture facilities that prioritize operational optimization and environmental performance. Market trends indicate that growers are increasingly evaluating equipment based on fuel efficiency, emission control capabilities, maintenance requirements, and integration with automated greenhouse management systems. As greenhouse operators continue to focus on production efficiency and cost management, technological improvements across all generator categories are contributing to market growth and evolving market share dynamics.
Application analysis highlights vegetables as one of the largest contributors to market share, supported by extensive greenhouse cultivation of tomatoes, cucumbers, peppers, lettuce, and other high-value crops. Commercial vegetable producers frequently utilize CO2 enrichment strategies to improve plant growth rates, increase yields, and enhance crop quality. The expansion of greenhouse vegetable production in response to growing consumer demand for year-round fresh produce continues to support market growth across numerous regions. Fruit cultivation also represents an important application segment, particularly in greenhouse-grown berries, strawberries, and specialty fruit crops that benefit from carefully controlled growing conditions. The increasing adoption of protected cultivation methods for premium fruit production is driving demand for advanced environmental management systems, including CO2 generators. Beyond vegetables and fruit, other applications encompass research facilities, plant nurseries, ornamental horticulture operations, and specialized agricultural environments where plant growth optimization is a priority. Market trends indicate that growers are increasingly relying on data-driven cultivation practices that integrate carbon dioxide management with lighting, irrigation, temperature control, and nutrient delivery systems. This broader adoption of precision cultivation techniques continues to strengthen the role of CO2 generators across diverse agricultural applications and supports overall market size expansion.
The competitive landscape of the CO2 Generator Market includes a mix of specialized greenhouse equipment manufacturers and agricultural technology suppliers focused on supporting modern cultivation practices. Titan Controls is widely recognized for its environmental control solutions designed for indoor growing and greenhouse operations, including CO2 management systems. Johnson Gas Appliance has established expertise in gas-fired equipment and heating technologies that support controlled agricultural environments. Hydrofarm serves a broad customer base within the horticulture and indoor cultivation sectors through an extensive portfolio of growing equipment and environmental control products. GGS Structures and HORCONEX are known for their greenhouse infrastructure capabilities, helping growers implement integrated cultivation systems that incorporate climate and carbon dioxide management technologies. Hotbox International and Green Air Products provide greenhouse-focused equipment solutions that support efficient environmental control and crop production. Taylors Garden Buildings contributes expertise in protected cultivation structures and related agricultural applications. Qingzhou Tianhui Machinery and Shandong Jienuo Equipment serve agricultural customers through manufacturing capabilities that support greenhouse modernization and cultivation efficiency. Across the industry, companies are emphasizing product reliability, energy efficiency, automation compatibility, and operational performance to address evolving grower requirements. Investments in technology development and greenhouse integration solutions continue to influence market share and competitive positioning while supporting broader market growth.
Regionally, Europe represents a significant market share due to its well-established greenhouse agriculture sector, particularly in countries with advanced horticultural industries and strong adoption of controlled environment cultivation techniques. The region benefits from extensive greenhouse infrastructure, technological innovation, and ongoing efforts to improve agricultural productivity and sustainability. North America also maintains a substantial position in the market, supported by growing investments in greenhouse vegetable production, indoor farming facilities, and commercial horticulture operations across the United States and Canada. Asia-Pacific is emerging as a key area of market growth as countries such as China, Japan, South Korea, and Taiwan continue to invest in agricultural modernization, food security initiatives, and protected cultivation technologies. Increasing urbanization and demand for high-quality fresh produce are encouraging wider adoption of greenhouse farming practices throughout the region. Southeast Asia, particularly India, is witnessing growing interest in controlled environment agriculture as growers seek to improve productivity and reduce climate-related risks. Latin America, led by Mexico and Brazil, is also expanding its greenhouse cultivation footprint to support export-oriented agricultural production and domestic food demand. Looking ahead, the market forecast is shaped by continued expansion of greenhouse farming, increasing adoption of precision agriculture technologies, and growing emphasis on resource-efficient food production. Advancements in greenhouse automation, environmental monitoring systems, fuel-efficient generator designs, and integrated climate management platforms are expected to influence future market trends. As growers continue to pursue higher productivity, improved crop quality, and greater operational efficiency, these developments are likely to support long-term market growth, expand market size opportunities, and shape future market share across the global CO2 Generator Market.
| Report Metric | Details |
| Report Name | SSD Rigid-Flex PCB Market |
| Accounted market size in 2025 | US$ 219 million |
| Forecasted market size in 2032 | US$ 345 million |
| CAGR | 6.8% |
| Base Year | 2025 |
| Forecasted years | 2026 - 2032 |
| Segment by Type |
|
| by Application |
|
| Production by Region |
|
| Consumption by Region |
|
| By Company | Korea Circuit, Shennan Circuits Co., Ltd., RayMing Technology, HONTEC, Unimmicron, Green Partner Technology Group Ltd, MADPCB, Shenzhen Wontech Electronics & Circuits Technology Co., Ltd, Nippon Mektron, Unimicron, Young Poong Group, Samsung Electro-Mechanics |
| Forecast units | USD million in value |
| Report coverage | Revenue and volume forecast, company share, competitive landscape, growth factors and trends |
Ans: The SSD Rigid-Flex PCB Market witnessing a CAGR of 6.8% during the forecast period 2026-2032.
Ans: The SSD Rigid-Flex PCB Market size in 2032 will be US$ 345 million.
Ans: The main players in the SSD Rigid-Flex PCB Market are Korea Circuit, Shennan Circuits Co., Ltd., RayMing Technology, HONTEC, Unimmicron, Green Partner Technology Group Ltd, MADPCB, Shenzhen Wontech Electronics & Circuits Technology Co., Ltd, Nippon Mektron, Unimicron, Young Poong Group, Samsung Electro-Mechanics
Ans: The Applications covered in the SSD Rigid-Flex PCB Market report are Medical, Automotive, Consumer Electronics Products, Industrial, Others
Ans: The Types covered in the SSD Rigid-Flex PCB Market report are Single Layer, Double Layer, Multi-layer
$2900
$4350
$5800
HAVE A QUERY?
OUR CUSTOMER

SIMILAR REPORTS