
Due to the COVID-19 pandemic, the global Cryogenic Equipment market size is estimated to be worth US$ 16800 million in 2022 and is forecast to a readjusted size of US$ 21040 million by 2028 with a CAGR of 3.8% during the review period.
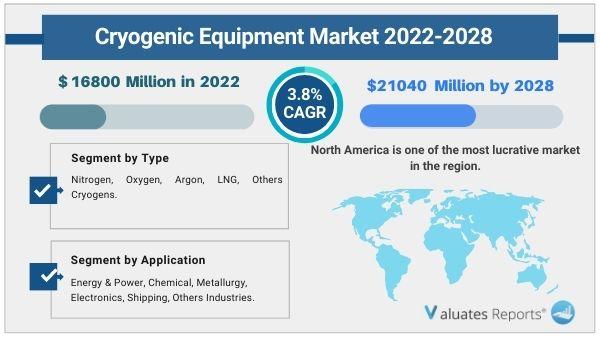
Fully considering the economic change by this health crisis, by Type, Nitrogen accounting for % of the Cryogenic Equipment global market in 2021, is projected to value US$ million by 2028, growing at a revised % CAGR in the post-COVID-19 period. While by Application, Energy & Power was the leading segment, accounting for over percent market share in 2021, and altered to an % CAGR throughout this forecast period. Based on end-user, the energy & power sector is the largest end-user for cryogenic equipment among all the industries. Transportation and storage of LNG is the major application of cryogenic equipment in the energy and power sector. The natural gas segment in the energy & power sector has transformed due to technological advancements and made extraction of natural gas economically viable. Moreover, countries such as the U.S. and China are focusing on reducing carbon emissions, which is expected to increase gas-based generation. With this positive outlook, the demand for cryogenic equipment in this sector is likely to grow during the forecast period. This report focuses on global and United States Cryogenic Equipment market, also covers the segmentation data of other regions in regional level and county level.
Cryogenic Equipment market is segmented by region (country), players, by Type and by Application. Players, stakeholders, and other participants in the global Cryogenic Equipment market will be able to gain the upper hand as they use the report as a powerful resource. The segmental analysis focuses on revenue and forecast by region (country), by Type, and by Application for the period 2017-2028. For the United States market, this report focuses on the Cryogenic Equipment market size by players, by Type and by Application, for the period 2017-2028. The key players include the global and local players, which play important roles in the United States.
Cryogenic Equipment market competitive landscape provides details and data information by players. The report offers a comprehensive analysis and accurate statistics on revenue by the player for the period 2017-2022. It also offers detailed analysis supported by reliable statistics on revenue (global and regional level) by players for the period 2017-2022. Details included are company description, major business, company total revenue and the sales, revenue generated in Cryogenic Equipment business, the date to enter into the Cryogenic Equipment market, Cryogenic Equipment product introduction, recent developments, etc.
|
Report Metric |
Details |
|
Report Name |
Cryogenic Equipment Market |
|
The market size in 2022 |
USD 16800 Million |
|
The revenue forecast in 2028 |
USD 21040 Million |
|
Growth Rate |
Compound Annual Growth Rate (CAGR) of 3.8% from 2022 to 2028 |
|
Market size available for years |
2022-2028 |
|
Forecast units |
Value (USD) |
|
Segments covered |
By Type, Application, and Region |
|
Report coverage |
Revenue & volume forecast, company share, competitive landscape, growth factors, and trends |
|
Geographic regions covered |
North America, Europe, Asia Pacific, Latin America, Middle East & Africa |
Ans. The global Cryogenic Equipment market size is estimated to be worth US$ 16800 million in 2022 and is forecast to a readjusted size of US$ 21040 million by 2028.
Ans. The global Cryogenic Equipment market is expected to grow at a compound annual growth rate of 3.8% from 2022 to 2028.
Ans. Some of the major companies are Air Liquide, Beijing Tianhai Industry., Chart Industries Inc., Cryofab Inc., Cryoquip LLC., Emerson, Flowserve Corporation, Graham Partners, Parker Hannifin, Herose GmbH, INOX India Ltd., Linde Group AG, Taylor-Wharton International LLC., VRV S.P.A, Wessington Cryogenics Ltd.
Table of Contents
1 Study Coverage
1.1 Cryogenic Equipment Product Introduction
1.2 Global Cryogenic Equipment Outlook 2017 VS 2022 VS 2028
1.2.1 Global Cryogenic Equipment Sales in US$ Million for the Year 2017-2028
1.2.2 Global Cryogenic Equipment Sales in Volume for the Year 2017-2028
1.3 United States Cryogenic Equipment Outlook 2017 VS 2022 VS 2028
1.3.1 United States Cryogenic Equipment Sales in US$ Million for the Year 2017-2028
1.3.2 United States Cryogenic Equipment Sales in Volume for the Year 2017-2028
1.4 Cryogenic Equipment Market Size, United States VS Global, 2017 VS 2022 VS 2028
1.4.1 The Market Share of United States Cryogenic Equipment in Global, 2017 VS 2022 VS 2028
1.4.2 The Growth Rate of Cryogenic Equipment Market Size, United States VS Global, 2017 VS 2022 VS 2028
1.5 Cryogenic Equipment Market Dynamics
1.5.1 Cryogenic Equipment Industry Trends
1.5.2 Cryogenic Equipment Market Drivers
1.5.3 Cryogenic Equipment Market Challenges
1.5.4 Cryogenic Equipment Market Restraints
1.6 Study Objectives
1.7 Years Considered
2 Market by Type
2.1 Cryogenic Equipment Market Segment by Type
2.1.1 Nitrogen
2.1.2 Oxygen
2.1.3 Argon
2.1.4 LNG
2.1.5 Others Cryogens
2.2 Global Cryogenic Equipment Market Size by Type
2.2.1 Global Cryogenic Equipment Sales in Value, by Type (2017, 2022 & 2028)
2.2.2 Global Cryogenic Equipment Sales in Volume, by Type (2017, 2022 & 2028)
2.2.3 Global Cryogenic Equipment Average Selling Price (ASP) by Type (2017, 2022 & 2028)
2.3 United States Cryogenic Equipment Market Size by Type
2.3.1 United States Cryogenic Equipment Sales in Value, by Type (2017, 2022 & 2028)
2.3.2 United States Cryogenic Equipment Sales in Volume, by Type (2017, 2022 & 2028)
2.3.3 United States Cryogenic Equipment Average Selling Price (ASP) by Type (2017, 2022 & 2028)
3 Market by Application
3.1 Cryogenic Equipment Market Segment by Application
3.1.1 Energy & Power
3.1.2 Chemical
3.1.3 Metallurgy
3.1.4 Electronics
3.1.5 Shipping
3.1.6 Others Industries
3.2 Global Cryogenic Equipment Market Size by Application
3.2.1 Global Cryogenic Equipment Sales in Value, by Application (2017, 2022 & 2028)
3.2.2 Global Cryogenic Equipment Sales in Volume, by Application (2017, 2022 & 2028)
3.3.3 Global Cryogenic Equipment Average Selling Price (ASP) by Application (2017, 2022 & 2028)
3.3 United States Cryogenic Equipment Market Size by Application
3.3.1 United States Cryogenic Equipment Sales in Value, by Application (2017, 2022 & 2028)
3.3.2 United States Cryogenic Equipment Sales in Volume, by Application (2017, 2022 & 2028)
3.3.3 United States Cryogenic Equipment Average Selling Price (ASP) by Application (2017, 2022 & 2028)
4 Global Cryogenic Equipment Competitor Landscape by Company
4.1 Global Cryogenic Equipment Market Size by Company
4.1.1 Top Global Cryogenic Equipment Manufacturers Ranked by Revenue (2021)
4.1.2 Global Cryogenic Equipment Revenue by Manufacturer (2017-2022)
4.1.3 Global Cryogenic Equipment Sales by Manufacturer (2017-2022)
4.1.4 Global Cryogenic Equipment Price by Manufacturer (2017-2022)
4.2 Global Cryogenic Equipment Concentration Ratio (CR)
4.2.1 Cryogenic Equipment Market Concentration Ratio (CR) (2017-2022)
4.2.2 Global Top 5 and Top 10 Largest Manufacturers of Cryogenic Equipment in 2021
4.2.3 Global Cryogenic Equipment Market Share by Company Type (Tier 1, Tier 2, and Tier 3)
4.3 Global Cryogenic Equipment Manufacturing Base Distribution, Product Type
4.3.1 Global Cryogenic Equipment Manufacturers, Headquarters and Distribution of Producing Region
4.3.2 Manufacturers Cryogenic Equipment Product Type
4.3.3 Date of International Manufacturers Enter into Cryogenic Equipment Market
4.4 Manufacturers Mergers & Acquisitions, Expansion Plans
4.5 United States Cryogenic Equipment Market Size by Company
4.5.1 Top Cryogenic Equipment Players in United States, Ranked by Revenue (2021)
4.5.2 United States Cryogenic Equipment Revenue by Players (2020, 2021 & 2022)
4.5.3 United States Cryogenic Equipment Sales by Players (2020, 2021 & 2022)
5 Global Cryogenic Equipment Market Size by Region
5.1 Global Cryogenic Equipment Market Size by Region: 2017 VS 2022 VS 2028
5.2 Global Cryogenic Equipment Market Size in Volume by Region (2017-2028)
5.2.1 Global Cryogenic Equipment Sales in Volume by Region: 2017-2022
5.2.2 Global Cryogenic Equipment Sales in Volume Forecast by Region (2023-2028)
5.3 Global Cryogenic Equipment Market Size in Value by Region (2017-2028)
5.3.1 Global Cryogenic Equipment Sales in Value by Region: 2017-2022
5.3.2 Global Cryogenic Equipment Sales in Value by Region: 2023-2028
6 Segment in Region Level & Country Level
6.1 North America
6.1.1 North America Cryogenic Equipment Market Size YoY Growth 2017-2028
6.1.2 North America Cryogenic Equipment Market Facts & Figures by Country (2017, 2022 & 2028)
6.1.3 U.S.
6.1.4 Canada
6.2 Asia-Pacific
6.2.1 Asia-Pacific Cryogenic Equipment Market Size YoY Growth 2017-2028
6.2.2 Asia-Pacific Cryogenic Equipment Market Facts & Figures by Region (2017, 2022 & 2028)
6.2.3 China
6.2.4 Japan
6.2.5 South Korea
6.2.6 India
6.2.7 Australia
6.2.8 Taiwan
6.2.9 Indonesia
6.2.10 Thailand
6.2.11 Malaysia
6.2.12 Philippines
6.3 Europe
6.3.1 Europe Cryogenic Equipment Market Size YoY Growth 2017-2028
6.3.2 Europe Cryogenic Equipment Market Facts & Figures by Country (2017, 2022 & 2028)
6.3.3 Germany
6.3.4 France
6.3.5 U.K.
6.3.6 Italy
6.3.7 Russia
6.4 Latin America
6.4.1 Latin America Cryogenic Equipment Market Size YoY Growth 2017-2028
6.4.2 Latin America Cryogenic Equipment Market Facts & Figures by Country (2017, 2022 & 2028)
6.4.3 Mexico
6.4.4 Brazil
6.4.5 Argentina
6.5 Middle East and Africa
6.5.1 Middle East and Africa Cryogenic Equipment Market Size YoY Growth 2017-2028
6.5.2 Middle East and Africa Cryogenic Equipment Market Facts & Figures by Country (2017, 2022 & 2028)
6.5.3 Turkey
6.5.4 Saudi Arabia
6.5.5 U.A.E
7 Company Profiles
7.1 Air Liquide
7.1.1 Air Liquide Corporation Information
7.1.2 Air Liquide Description and Business Overview
7.1.3 Air Liquide Cryogenic Equipment Sales, Revenue and Gross Margin (2017-2022)
7.1.4 Air Liquide Cryogenic Equipment Products Offered
7.1.5 Air Liquide Recent Development
7.2 Beijing Tianhai Industry.
7.2.1 Beijing Tianhai Industry. Corporation Information
7.2.2 Beijing Tianhai Industry. Description and Business Overview
7.2.3 Beijing Tianhai Industry. Cryogenic Equipment Sales, Revenue and Gross Margin (2017-2022)
7.2.4 Beijing Tianhai Industry. Cryogenic Equipment Products Offered
7.2.5 Beijing Tianhai Industry. Recent Development
7.3 Chart Industries Inc.
7.3.1 Chart Industries Inc. Corporation Information
7.3.2 Chart Industries Inc. Description and Business Overview
7.3.3 Chart Industries Inc. Cryogenic Equipment Sales, Revenue and Gross Margin (2017-2022)
7.3.4 Chart Industries Inc. Cryogenic Equipment Products Offered
7.3.5 Chart Industries Inc. Recent Development
7.4 Cryofab Inc.
7.4.1 Cryofab Inc. Corporation Information
7.4.2 Cryofab Inc. Description and Business Overview
7.4.3 Cryofab Inc. Cryogenic Equipment Sales, Revenue and Gross Margin (2017-2022)
7.4.4 Cryofab Inc. Cryogenic Equipment Products Offered
7.4.5 Cryofab Inc. Recent Development
7.5 Cryoquip LLC.
7.5.1 Cryoquip LLC. Corporation Information
7.5.2 Cryoquip LLC. Description and Business Overview
7.5.3 Cryoquip LLC. Cryogenic Equipment Sales, Revenue and Gross Margin (2017-2022)
7.5.4 Cryoquip LLC. Cryogenic Equipment Products Offered
7.5.5 Cryoquip LLC. Recent Development
7.6 Emerson
7.6.1 Emerson Corporation Information
7.6.2 Emerson Description and Business Overview
7.6.3 Emerson Cryogenic Equipment Sales, Revenue and Gross Margin (2017-2022)
7.6.4 Emerson Cryogenic Equipment Products Offered
7.6.5 Emerson Recent Development
7.7 Flowserve Corporation
7.7.1 Flowserve Corporation Corporation Information
7.7.2 Flowserve Corporation Description and Business Overview
7.7.3 Flowserve Corporation Cryogenic Equipment Sales, Revenue and Gross Margin (2017-2022)
7.7.4 Flowserve Corporation Cryogenic Equipment Products Offered
7.7.5 Flowserve Corporation Recent Development
7.8 Graham Partners
7.8.1 Graham Partners Corporation Information
7.8.2 Graham Partners Description and Business Overview
7.8.3 Graham Partners Cryogenic Equipment Sales, Revenue and Gross Margin (2017-2022)
7.8.4 Graham Partners Cryogenic Equipment Products Offered
7.8.5 Graham Partners Recent Development
7.9 Parker Hannifin
7.9.1 Parker Hannifin Corporation Information
7.9.2 Parker Hannifin Description and Business Overview
7.9.3 Parker Hannifin Cryogenic Equipment Sales, Revenue and Gross Margin (2017-2022)
7.9.4 Parker Hannifin Cryogenic Equipment Products Offered
7.9.5 Parker Hannifin Recent Development
7.10 Herose GmbH
7.10.1 Herose GmbH Corporation Information
7.10.2 Herose GmbH Description and Business Overview
7.10.3 Herose GmbH Cryogenic Equipment Sales, Revenue and Gross Margin (2017-2022)
7.10.4 Herose GmbH Cryogenic Equipment Products Offered
7.10.5 Herose GmbH Recent Development
7.11 INOX India Ltd.
7.11.1 INOX India Ltd. Corporation Information
7.11.2 INOX India Ltd. Description and Business Overview
7.11.3 INOX India Ltd. Cryogenic Equipment Sales, Revenue and Gross Margin (2017-2022)
7.11.4 INOX India Ltd. Cryogenic Equipment Products Offered
7.11.5 INOX India Ltd. Recent Development
7.12 Linde Group AG
7.12.1 Linde Group AG Corporation Information
7.12.2 Linde Group AG Description and Business Overview
7.12.3 Linde Group AG Cryogenic Equipment Sales, Revenue and Gross Margin (2017-2022)
7.12.4 Linde Group AG Products Offered
7.12.5 Linde Group AG Recent Development
7.13 Taylor-Wharton International LLC.
7.13.1 Taylor-Wharton International LLC. Corporation Information
7.13.2 Taylor-Wharton International LLC. Description and Business Overview
7.13.3 Taylor-Wharton International LLC. Cryogenic Equipment Sales, Revenue and Gross Margin (2017-2022)
7.13.4 Taylor-Wharton International LLC. Products Offered
7.13.5 Taylor-Wharton International LLC. Recent Development
7.14 VRV S.P.A
7.14.1 VRV S.P.A Corporation Information
7.14.2 VRV S.P.A Description and Business Overview
7.14.3 VRV S.P.A Cryogenic Equipment Sales, Revenue and Gross Margin (2017-2022)
7.14.4 VRV S.P.A Products Offered
7.14.5 VRV S.P.A Recent Development
7.15 Wessington Cryogenics Ltd.
7.15.1 Wessington Cryogenics Ltd. Corporation Information
7.15.2 Wessington Cryogenics Ltd. Description and Business Overview
7.15.3 Wessington Cryogenics Ltd. Cryogenic Equipment Sales, Revenue and Gross Margin (2017-2022)
7.15.4 Wessington Cryogenics Ltd. Products Offered
7.15.5 Wessington Cryogenics Ltd. Recent Development
8 Industry Chain and Sales Channels Analysis
8.1 Cryogenic Equipment Industry Chain Analysis
8.2 Cryogenic Equipment Key Raw Materials
8.2.1 Key Raw Materials
8.2.2 Cryogenic Equipment Distributors
8.3 Cryogenic Equipment Production Mode & Process
8.4 Cryogenic Equipment Sales and Marketing
8.4.1 Cryogenic Equipment Sales Channels
8.4.2 Cryogenic Equipment Distributors
8.5 Cryogenic Equipment Customers
9 Research Findings and Conclusion
10 Appendix
10.1 Research Methodology
10.1.1 Methodology/Research Approach
10.1.2 Data Source
10.2 Author Details
10.3 Disclaimer
List of Tables
Table 1. Cryogenic Equipment CAGR in Value, United States VS Global, 2017 VS 2022 VS 2028
Table 2. Cryogenic Equipment Market Trends
Table 3. Cryogenic Equipment Market Drivers
Table 4. Cryogenic Equipment Market Challenges
Table 5. Cryogenic Equipment Market Restraints
Table 6. Global Cryogenic Equipment Sales by Type: 2017 VS 2022 VS 2028 (US$ Million)
Table 7. United States Cryogenic Equipment Sales by Type: 2017 VS 2022 VS 2028 (US$ Million)
Table 8. Global Cryogenic Equipment Sales by Application: 2017 VS 2022 VS 2028 (US$ Million)
Table 9. United States Cryogenic Equipment Sales by Application: 2017 VS 2022 VS 2028 (US$ Million)
Table 10. Top Cryogenic Equipment Manufacturers in Global Market, Ranking by Revenue (2021)
Table 11. Global Cryogenic Equipment Revenue by Manufacturer, (US$ Million), 2017-2022
Table 12. Global Cryogenic Equipment Revenue Share by Manufacturer, 2017-2022
Table 13. Global Cryogenic Equipment Sales by Manufacturer, (K Units), 2017-2022
Table 14. Global Cryogenic Equipment Sales Share by Manufacturer, 2017-2022
Table 15. Global Cryogenic Equipment Price by Manufacturer (2017-2022) & (USD/Unit)
Table 16. Global Cryogenic Equipment Manufacturers Market Concentration Ratio (CR5 and HHI)
Table 17. Global Cryogenic Equipment by Company Type (Tier 1, Tier 2, and Tier 3) & (based on the Revenue in Cryogenic Equipment as of 2021)
Table 18. Top Players of Cryogenic Equipment in Global Market, Headquarters and Distribution of Producing Region
Table 19. Manufacturers Cryogenic Equipment Product Type
Table 20. Date of International Manufacturers Enter into Cryogenic Equipment Market
Table 21. Manufacturers Mergers & Acquisitions, Expansion Plans
Table 22. Top Cryogenic Equipment Players in United States Market, Ranking by Revenue (2021)
Table 23. United States Cryogenic Equipment Revenue by Players, (US$ Million), 2020, 2021 & 2022
Table 24. United States Cryogenic Equipment Revenue Share by Players, 2020, 2021 & 2022
Table 25. United States Cryogenic Equipment Sales by Players, (K Units), 2020, 2021 & 2022
Table 26. United States Cryogenic Equipment Sales Share by Players, 2020, 2021 & 2022
Table 27. Global Cryogenic Equipment Market Size by Region (US$ Million): 2017 VS 2022 VS 2028
Table 28. Global Cryogenic Equipment Sales in Volume by Region (2017-2022) & (K Units)
Table 29. Global Cryogenic Equipment Sales in Volume Forecast by Region (2023-2028) & (K Units)
Table 30. Global Cryogenic Equipment Sales in Value by Region (2017-2022) & (US$ Million)
Table 31. Global Cryogenic Equipment Sales in Value Forecast by Region (2023-2028) & (US$ Million)
Table 32. North America Cryogenic Equipment Sales in Volume by Country (2017-2028) & (K Units)
Table 33. North America Cryogenic Equipment Sales in Value by Country (2017-2028) & (US$ Million)
Table 34. Asia Pacific Cryogenic Equipment Sales in Volume by Region (2017-2028) & (K Units)
Table 35. Asia Pacific Cryogenic Equipment Sales in Value by Region (2017-2028) & (US$ Million)
Table 36. Europe Cryogenic Equipment Sales in Volume by Country (2017-2028) & (K Units)
Table 37. Europe Cryogenic Equipment Sales in Value by Country (2017-2028) & (US$ Million)
Table 38. Latin America Cryogenic Equipment Sales in Volume by Country (2017-2028) & (K Units)
Table 39. Latin Americaa Cryogenic Equipment Sales in Value by Country (2017-2028) & (US$ Million)
Table 40. Middle East and Africa Cryogenic Equipment Sales in Volume by Country (2017-2028) & (K Units)
Table 41. Middle East and Africa Cryogenic Equipment Sales in Value by Country (2017-2028) & (US$ Million)
Table 42. Air Liquide Corporation Information
Table 43. Air Liquide Description and Business Overview
Table 44. Air Liquide Cryogenic Equipment Sales (K Units), Revenue (US$ Million), Price (USD/Unit) and Gross Margin (2017-2022)
Table 45. Air Liquide Cryogenic Equipment Product
Table 46. Air Liquide Recent Development
Table 47. Beijing Tianhai Industry. Corporation Information
Table 48. Beijing Tianhai Industry. Description and Business Overview
Table 49. Beijing Tianhai Industry. Cryogenic Equipment Sales (K Units), Revenue (US$ Million), Price (USD/Unit) and Gross Margin (2017-2022)
Table 50. Beijing Tianhai Industry. Product
Table 51. Beijing Tianhai Industry. Recent Development
Table 52. Chart Industries Inc. Corporation Information
Table 53. Chart Industries Inc. Description and Business Overview
Table 54. Chart Industries Inc. Cryogenic Equipment Sales (K Units), Revenue (US$ Million), Price (USD/Unit) and Gross Margin (2017-2022)
Table 55. Chart Industries Inc. Product
Table 56. Chart Industries Inc. Recent Development
Table 57. Cryofab Inc. Corporation Information
Table 58. Cryofab Inc. Description and Business Overview
Table 59. Cryofab Inc. Cryogenic Equipment Sales (K Units), Revenue (US$ Million), Price (USD/Unit) and Gross Margin (2017-2022)
Table 60. Cryofab Inc. Product
Table 61. Cryofab Inc. Recent Development
Table 62. Cryoquip LLC. Corporation Information
Table 63. Cryoquip LLC. Description and Business Overview
Table 64. Cryoquip LLC. Cryogenic Equipment Sales (K Units), Revenue (US$ Million), Price (USD/Unit) and Gross Margin (2017-2022)
Table 65. Cryoquip LLC. Product
Table 66. Cryoquip LLC. Recent Development
Table 67. Emerson Corporation Information
Table 68. Emerson Description and Business Overview
Table 69. Emerson Cryogenic Equipment Sales (K Units), Revenue (US$ Million), Price (USD/Unit) and Gross Margin (2017-2022)
Table 70. Emerson Product
Table 71. Emerson Recent Development
Table 72. Flowserve Corporation Corporation Information
Table 73. Flowserve Corporation Description and Business Overview
Table 74. Flowserve Corporation Cryogenic Equipment Sales (K Units), Revenue (US$ Million), Price (USD/Unit) and Gross Margin (2017-2022)
Table 75. Flowserve Corporation Product
Table 76. Flowserve Corporation Recent Development
Table 77. Graham Partners Corporation Information
Table 78. Graham Partners Description and Business Overview
Table 79. Graham Partners Cryogenic Equipment Sales (K Units), Revenue (US$ Million), Price (USD/Unit) and Gross Margin (2017-2022)
Table 80. Graham Partners Product
Table 81. Graham Partners Recent Development
Table 82. Parker Hannifin Corporation Information
Table 83. Parker Hannifin Description and Business Overview
Table 84. Parker Hannifin Cryogenic Equipment Sales (K Units), Revenue (US$ Million), Price (USD/Unit) and Gross Margin (2017-2022)
Table 85. Parker Hannifin Product
Table 86. Parker Hannifin Recent Development
Table 87. Herose GmbH Corporation Information
Table 88. Herose GmbH Description and Business Overview
Table 89. Herose GmbH Cryogenic Equipment Sales (K Units), Revenue (US$ Million), Price (USD/Unit) and Gross Margin (2017-2022)
Table 90. Herose GmbH Product
Table 91. Herose GmbH Recent Development
Table 92. INOX India Ltd. Corporation Information
Table 93. INOX India Ltd. Description and Business Overview
Table 94. INOX India Ltd. Cryogenic Equipment Sales (K Units), Revenue (US$ Million), Price (USD/Unit) and Gross Margin (2017-2022)
Table 95. INOX India Ltd. Product
Table 96. INOX India Ltd. Recent Development
Table 97. Linde Group AG Corporation Information
Table 98. Linde Group AG Description and Business Overview
Table 99. Linde Group AG Cryogenic Equipment Sales (K Units), Revenue (US$ Million), Price (USD/Unit) and Gross Margin (2017-2022)
Table 100. Linde Group AG Product
Table 101. Linde Group AG Recent Development
Table 102. Taylor-Wharton International LLC. Corporation Information
Table 103. Taylor-Wharton International LLC. Description and Business Overview
Table 104. Taylor-Wharton International LLC. Cryogenic Equipment Sales (K Units), Revenue (US$ Million), Price (USD/Unit) and Gross Margin (2017-2022)
Table 105. Taylor-Wharton International LLC. Product
Table 106. Taylor-Wharton International LLC. Recent Development
Table 107. VRV S.P.A Corporation Information
Table 108. VRV S.P.A Description and Business Overview
Table 109. VRV S.P.A Cryogenic Equipment Sales (K Units), Revenue (US$ Million), Price (USD/Unit) and Gross Margin (2017-2022)
Table 110. VRV S.P.A Product
Table 111. VRV S.P.A Recent Development
Table 112. Wessington Cryogenics Ltd. Corporation Information
Table 113. Wessington Cryogenics Ltd. Description and Business Overview
Table 114. Wessington Cryogenics Ltd. Cryogenic Equipment Sales (K Units), Revenue (US$ Million), Price (USD/Unit) and Gross Margin (2017-2022)
Table 115. Wessington Cryogenics Ltd. Product
Table 116. Wessington Cryogenics Ltd. Recent Development
Table 117. Key Raw Materials Lists
Table 118. Raw Materials Key Suppliers Lists
Table 119. Cryogenic Equipment Customers List
Table 120. Cryogenic Equipment Distributors List
Table 121. Research Programs/Design for This Report
Table 122. Key Data Information from Secondary Sources
Table 123. Key Data Information from Primary Sources
List of Figures
Figure 1. Cryogenic Equipment Product Picture
Figure 2. Global Cryogenic Equipment Revenue, (US$ Million), 2017 VS 2022 VS 2028
Figure 3. Global Cryogenic Equipment Market Size 2017-2028 (US$ Million)
Figure 4. Global Cryogenic Equipment Sales 2017-2028 (K Units)
Figure 5. United States Cryogenic Equipment Revenue, (US$ Million), 2017 VS 2022 VS 2028
Figure 6. United States Cryogenic Equipment Market Size 2017-2028 (US$ Million)
Figure 7. United States Cryogenic Equipment Sales 2017-2028 (K Units)
Figure 8. United States Cryogenic Equipment Market Share in Global, in Value (US$ Million) 2017-2028
Figure 9. United States Cryogenic Equipment Market Share in Global, in Volume (K Units) 2017-2028
Figure 10. Cryogenic Equipment Report Years Considered
Figure 11. Product Picture of Nitrogen
Figure 12. Product Picture of Oxygen
Figure 13. Product Picture of Argon
Figure 14. Product Picture of LNG
Figure 15. Product Picture of Others Cryogens
Figure 16. Global Cryogenic Equipment Market Share by Type in 2022 & 2028
Figure 17. Global Cryogenic Equipment Sales in Value by Type (2017-2028) & (US$ Million)
Figure 18. Global Cryogenic Equipment Sales Market Share in Value by Type (2017-2028)
Figure 19. Global Cryogenic Equipment Sales by Type (2017-2028) & (K Units)
Figure 20. Global Cryogenic Equipment Sales Market Share in Volume by Type (2017-2028)
Figure 21. Global Cryogenic Equipment Price by Type (2017-2028) & (USD/Unit)
Figure 22. United States Cryogenic Equipment Market Share by Type in 2022 & 2028
Figure 23. United States Cryogenic Equipment Sales in Value by Type (2017-2028) & (US$ Million)
Figure 24. United States Cryogenic Equipment Sales Market Share in Value by Type (2017-2028)
Figure 25. United States Cryogenic Equipment Sales by Type (2017-2028) & (K Units)
Figure 26. United States Cryogenic Equipment Sales Market Share in Volume by Type (2017-2028)
Figure 27. United States Cryogenic Equipment Price by Type (2017-2028) & (USD/Unit)
Figure 28. Product Picture of Energy & Power
Figure 29. Product Picture of Chemical
Figure 30. Product Picture of Metallurgy
Figure 31. Product Picture of Electronics
Figure 32. Product Picture of Shipping
Figure 33. Product Picture of Others Industries
Figure 34. Global Cryogenic Equipment Market Share by Application in 2022 & 2028
Figure 35. Global Cryogenic Equipment Sales in Value by Application (2017-2028) & (US$ Million)
Figure 36. Global Cryogenic Equipment Sales Market Share in Value by Application (2017-2028)
Figure 37. Global Cryogenic Equipment Sales by Application (2017-2028) & (K Units)
Figure 38. Global Cryogenic Equipment Sales Market Share in Volume by Application (2017-2028)
Figure 39. Global Cryogenic Equipment Price by Application (2017-2028) & (USD/Unit)
Figure 40. United States Cryogenic Equipment Market Share by Application in 2022 & 2028
Figure 41. United States Cryogenic Equipment Sales in Value by Application (2017-2028) & (US$ Million)
Figure 42. United States Cryogenic Equipment Sales Market Share in Value by Application (2017-2028)
Figure 43. United States Cryogenic Equipment Sales by Application (2017-2028) & (K Units)
Figure 44. United States Cryogenic Equipment Sales Market Share in Volume by Application (2017-2028)
Figure 45. United States Cryogenic Equipment Price by Application (2017-2028) & (USD/Unit)
Figure 46. North America Cryogenic Equipment Sales in Volume Growth Rate 2017-2028 (K Units)
Figure 47. North America Cryogenic Equipment Sales in Value Growth Rate 2017-2028 (US$ Million)
Figure 48. U.S. Cryogenic Equipment Sales in Value Growth Rate (2017-2028) & (US$ Million)
Figure 49. Canada Cryogenic Equipment Sales in Value Growth Rate (2017-2028) & (US$ Million)
Figure 50. Europe Cryogenic Equipment Sales in Volume Growth Rate 2017-2028 (K Units)
Figure 51. Europe Cryogenic Equipment Sales in Value Growth Rate 2017-2028 (US$ Million)
Figure 52. Germany Cryogenic Equipment Sales in Value Growth Rate (2017-2028) & (US$ Million)
Figure 53. France Cryogenic Equipment Sales in Value Growth Rate (2017-2028) & (US$ Million)
Figure 54. U.K. Cryogenic Equipment Sales in Value Growth Rate (2017-2028) & (US$ Million)
Figure 55. Italy Cryogenic Equipment Sales in Value Growth Rate (2017-2028) & (US$ Million)
Figure 56. Russia Cryogenic Equipment Sales in Value Growth Rate (2017-2028) & (US$ Million)
Figure 57. Asia-Pacific Cryogenic Equipment Sales in Volume Growth Rate 2017-2028 (K Units)
Figure 58. Asia-Pacific Cryogenic Equipment Sales in Value Growth Rate 2017-2028 (US$ Million)
Figure 59. China Cryogenic Equipment Sales in Value Growth Rate (2017-2028) & (US$ Million)
Figure 60. Japan Cryogenic Equipment Sales in Value Growth Rate (2017-2028) & (US$ Million)
Figure 61. South Korea Cryogenic Equipment Sales in Value Growth Rate (2017-2028) & (US$ Million)
Figure 62. India Cryogenic Equipment Sales in Value Growth Rate (2017-2028) & (US$ Million)
Figure 63. Australia Cryogenic Equipment Sales in Value Growth Rate (2017-2028) & (US$ Million)
Figure 64. Taiwan Cryogenic Equipment Sales in Value Growth Rate (2017-2028) & (US$ Million)
Figure 65. Indonesia Cryogenic Equipment Sales in Value Growth Rate (2017-2028) & (US$ Million)
Figure 66. Thailand Cryogenic Equipment Sales in Value Growth Rate (2017-2028) & (US$ Million)
Figure 67. Malaysia Cryogenic Equipment Sales in Value Growth Rate (2017-2028) & (US$ Million)
Figure 68. Philippines Cryogenic Equipment Sales in Value Growth Rate (2017-2028) & (US$ Million)
Figure 69. Latin America Cryogenic Equipment Sales in Volume Growth Rate 2017-2028 (K Units)
Figure 70. Latin America Cryogenic Equipment Sales in Value Growth Rate 2017-2028 (US$ Million)
Figure 71. Mexico Cryogenic Equipment Sales in Value Growth Rate (2017-2028) & (US$ Million)
Figure 72. Brazil Cryogenic Equipment Sales in Value Growth Rate (2017-2028) & (US$ Million)
Figure 73. Argentina Cryogenic Equipment Sales in Value Growth Rate (2017-2028) & (US$ Million)
Figure 74. Middle East & Africa Cryogenic Equipment Sales in Volume Growth Rate 2017-2028 (K Units)
Figure 75. Middle East & Africa Cryogenic Equipment Sales in Value Growth Rate 2017-2028 (US$ Million)
Figure 76. Turkey Cryogenic Equipment Sales in Value Growth Rate (2017-2028) & (US$ Million)
Figure 77. Saudi Arabia Cryogenic Equipment Sales in Value Growth Rate (2017-2028) & (US$ Million)
Figure 78. U.A.E Cryogenic Equipment Sales in Value Growth Rate (2017-2028) & (US$ Million)
Figure 79. Cryogenic Equipment Value Chain
Figure 80. Cryogenic Equipment Production Process
Figure 81. Channels of Distribution
Figure 82. Distributors Profiles
Figure 83. Bottom-up and Top-down Approaches for This Report
Figure 84. Data Triangulation
Figure 85. Key Executives Interviewed
$4350
$8700
HAVE A QUERY?
OUR CUSTOMER

SIMILAR REPORTS