List of Tables
Table 1. Global HVAC Operations, Maintenance, and Repair Services Market Size Growth Rate by Type (US$ Million): 2021 vs 2025 vs 2032
Table 2. Key Players of Routine Operation and Management Services
Table 3. Key Players of Preventive Maintenance Services
Table 4. Key Players of Proactive Condition-Based Maintenance Services
Table 5. Key Players of Corrective Fault Repair Services
Table 6. Key Players of Others
Table 7. Global HVAC Operations, Maintenance, and Repair Services Market Size Growth Rate by Service Modules (US$ Million): 2021 vs 2025 vs 2032
Table 8. Key Players of Cold and Heat Source System Services
Table 9. Key Players of Air Handling and Delivery System Services
Table 10. Key Players of Water System Services
Table 11. Key Players of Control System Services
Table 12. Key Players of Others
Table 13. Global HVAC Operations, Maintenance, and Repair Services Market Size Growth Rate by Service Modes (US$ Million): 2021 vs 2025 vs 2032
Table 14. Key Players of Turnkey Maintenance Service
Table 15. Key Players of Partial Package Service
Table 16. Key Players of Time and Materials Service
Table 17. Key Players of Others
Table 18. Global HVAC Operations, Maintenance, and Repair Services Market Size Growth by Application (US$ Million): 2021 vs 2025 vs 2032
Table 19. Global HVAC Operations, Maintenance, and Repair Services Market Size by Region (US$ Million): 2021 vs 2025 vs 2032
Table 20. Global HVAC Operations, Maintenance, and Repair Services Market Size by Region (US$ Million), 2021–2026
Table 21. Global HVAC Operations, Maintenance, and Repair Services Market Share by Region (2021–2026)
Table 22. Global HVAC Operations, Maintenance, and Repair Services Forecasted Market Size by Region (US$ Million), 2027–2032
Table 23. Global HVAC Operations, Maintenance, and Repair Services Market Share by Region (2027–2032)
Table 24. HVAC Operations, Maintenance, and Repair Services Market Trends
Table 25. HVAC Operations, Maintenance, and Repair Services Market Drivers
Table 26. HVAC Operations, Maintenance, and Repair Services Market Challenges
Table 27. HVAC Operations, Maintenance, and Repair Services Market Restraints
Table 28. Global HVAC Operations, Maintenance, and Repair Services Revenue by Players (US$ Million), 2021–2026
Table 29. Global HVAC Operations, Maintenance, and Repair Services Market Share by Players (2021–2026)
Table 30. Global Top HVAC Operations, Maintenance, and Repair Services Players by Tier (Tier 1, Tier 2, and Tier 3), based on HVAC Operations, Maintenance, and Repair Services Revenue, 2025
Table 31. Ranking of Global Top HVAC Operations, Maintenance, and Repair Services Companies by Revenue (US$ Million) in 2025
Table 32. Global 5 Largest Players Market Share by HVAC Operations, Maintenance, and Repair Services Revenue (CR5 and HHI), 2021–2026
Table 33. Global Key Players of HVAC Operations, Maintenance, and Repair Services, Headquarters and Area Served
Table 34. Global Key Players of HVAC Operations, Maintenance, and Repair Services, Products and Applications
Table 35. Global Key Players of HVAC Operations, Maintenance, and Repair Services, Date of General Availability (GA)
Table 36. Mergers and Acquisitions, Expansion Plans
Table 37. Global HVAC Operations, Maintenance, and Repair Services Market Size by Type (US$ Million), 2021–2026
Table 38. Global HVAC Operations, Maintenance, and Repair Services Revenue Market Share by Type (2021–2026)
Table 39. Global HVAC Operations, Maintenance, and Repair Services Forecasted Market Size by Type (US$ Million), 2027–2032
Table 40. Global HVAC Operations, Maintenance, and Repair Services Revenue Market Share by Type (2027–2032)
Table 41. Global HVAC Operations, Maintenance, and Repair Services Market Size by Application (US$ Million), 2021–2026
Table 42. Global HVAC Operations, Maintenance, and Repair Services Revenue Market Share by Application (2021–2026)
Table 43. Global HVAC Operations, Maintenance, and Repair Services Forecasted Market Size by Application (US$ Million), 2027–2032
Table 44. Global HVAC Operations, Maintenance, and Repair Services Revenue Market Share by Application (2027–2032)
Table 45. North America HVAC Operations, Maintenance, and Repair Services Market Size Growth Rate by Country (US$ Million): 2021 vs 2025 vs 2032
Table 46. North America HVAC Operations, Maintenance, and Repair Services Market Size by Country (US$ Million), 2021–2026
Table 47. North America HVAC Operations, Maintenance, and Repair Services Market Size by Country (US$ Million), 2027–2032
Table 48. Europe HVAC Operations, Maintenance, and Repair Services Market Size Growth Rate by Country (US$ Million): 2021 vs 2025 vs 2032
Table 49. Europe HVAC Operations, Maintenance, and Repair Services Market Size by Country (US$ Million), 2021–2026
Table 50. Europe HVAC Operations, Maintenance, and Repair Services Market Size by Country (US$ Million), 2027–2032
Table 51. Asia-Pacific HVAC Operations, Maintenance, and Repair Services Market Size Growth Rate by Region (US$ Million): 2021 vs 2025 vs 2032
Table 52. Asia-Pacific HVAC Operations, Maintenance, and Repair Services Market Size by Region (US$ Million), 2021–2026
Table 53. Asia-Pacific HVAC Operations, Maintenance, and Repair Services Market Size by Region (US$ Million), 2027–2032
Table 54. Latin America HVAC Operations, Maintenance, and Repair Services Market Size Growth Rate by Country (US$ Million): 2021 vs 2025 vs 2032
Table 55. Latin America HVAC Operations, Maintenance, and Repair Services Market Size by Country (US$ Million), 2021–2026
Table 56. Latin America HVAC Operations, Maintenance, and Repair Services Market Size by Country (US$ Million), 2027–2032
Table 57. Middle East & Africa HVAC Operations, Maintenance, and Repair Services Market Size Growth Rate by Country (US$ Million): 2021 vs 2025 vs 2032
Table 58. Middle East & Africa HVAC Operations, Maintenance, and Repair Services Market Size by Country (US$ Million), 2021–2026
Table 59. Middle East & Africa HVAC Operations, Maintenance, and Repair Services Market Size by Country (US$ Million), 2027–2032
Table 60. Johnson Controls Company Details
Table 61. Johnson Controls Business Overview
Table 62. Johnson Controls HVAC Operations, Maintenance, and Repair Services Product
Table 63. Johnson Controls Revenue in HVAC Operations, Maintenance, and Repair Services Business (US$ Million), 2021–2026
Table 64. Johnson Controls Recent Development
Table 65. Trane Company Details
Table 66. Trane Business Overview
Table 67. Trane HVAC Operations, Maintenance, and Repair Services Product
Table 68. Trane Revenue in HVAC Operations, Maintenance, and Repair Services Business (US$ Million), 2021–2026
Table 69. Trane Recent Development
Table 70. NAC Mechanical & Electrical Services Company Details
Table 71. NAC Mechanical & Electrical Services Business Overview
Table 72. NAC Mechanical & Electrical Services HVAC Operations, Maintenance, and Repair Services Product
Table 73. NAC Mechanical & Electrical Services Revenue in HVAC Operations, Maintenance, and Repair Services Business (US$ Million), 2021–2026
Table 74. NAC Mechanical & Electrical Services Recent Development
Table 75. Pilot Company Careers Company Details
Table 76. Pilot Company Careers Business Overview
Table 77. Pilot Company Careers HVAC Operations, Maintenance, and Repair Services Product
Table 78. Pilot Company Careers Revenue in HVAC Operations, Maintenance, and Repair Services Business (US$ Million), 2021–2026
Table 79. Pilot Company Careers Recent Development
Table 80. Service HQ Company Details
Table 81. Service HQ Business Overview
Table 82. Service HQ HVAC Operations, Maintenance, and Repair Services Product
Table 83. Service HQ Revenue in HVAC Operations, Maintenance, and Repair Services Business (US$ Million), 2021–2026
Table 84. Service HQ Recent Development
Table 85. Victorville Daily Press Company Details
Table 86. Victorville Daily Press Business Overview
Table 87. Victorville Daily Press HVAC Operations, Maintenance, and Repair Services Product
Table 88. Victorville Daily Press Revenue in HVAC Operations, Maintenance, and Repair Services Business (US$ Million), 2021–2026
Table 89. Victorville Daily Press Recent Development
Table 90. Air Mechanical, Inc. Company Details
Table 91. Air Mechanical, Inc. Business Overview
Table 92. Air Mechanical, Inc. HVAC Operations, Maintenance, and Repair Services Product
Table 93. Air Mechanical, Inc. Revenue in HVAC Operations, Maintenance, and Repair Services Business (US$ Million), 2021–2026
Table 94. Air Mechanical, Inc. Recent Development
Table 95. Quality Comfort Services, Inc. Company Details
Table 96. Quality Comfort Services, Inc. Business Overview
Table 97. Quality Comfort Services, Inc. HVAC Operations, Maintenance, and Repair Services Product
Table 98. Quality Comfort Services, Inc. Revenue in HVAC Operations, Maintenance, and Repair Services Business (US$ Million), 2021–2026
Table 99. Quality Comfort Services, Inc. Recent Development
Table 100. O'Brien Service Company Company Details
Table 101. O'Brien Service Company Business Overview
Table 102. O'Brien Service Company HVAC Operations, Maintenance, and Repair Services Product
Table 103. O'Brien Service Company Revenue in HVAC Operations, Maintenance, and Repair Services Business (US$ Million), 2021–2026
Table 104. O'Brien Service Company Recent Development
Table 105. EMCOR Services Aircond Company Details
Table 106. EMCOR Services Aircond Business Overview
Table 107. EMCOR Services Aircond HVAC Operations, Maintenance, and Repair Services Product
Table 108. EMCOR Services Aircond Revenue in HVAC Operations, Maintenance, and Repair Services Business (US$ Million), 2021–2026
Table 109. EMCOR Services Aircond Recent Development
Table 110. Daikin Applied Company Details
Table 111. Daikin Applied Business Overview
Table 112. Daikin Applied HVAC Operations, Maintenance, and Repair Services Product
Table 113. Daikin Applied Revenue in HVAC Operations, Maintenance, and Repair Services Business (US$ Million), 2021–2026
Table 114. Daikin Applied Recent Development
Table 115. USA Mechanical Company Details
Table 116. USA Mechanical Business Overview
Table 117. USA Mechanical HVAC Operations, Maintenance, and Repair Services Product
Table 118. USA Mechanical Revenue in HVAC Operations, Maintenance, and Repair Services Business (US$ Million), 2021–2026
Table 119. USA Mechanical Recent Development
Table 120. Heinen & Hopman Company Details
Table 121. Heinen & Hopman Business Overview
Table 122. Heinen & Hopman HVAC Operations, Maintenance, and Repair Services Product
Table 123. Heinen & Hopman Revenue in HVAC Operations, Maintenance, and Repair Services Business (US$ Million), 2021–2026
Table 124. Heinen & Hopman Recent Development
Table 125. Aqua Technologies Europe Ltd Company Details
Table 126. Aqua Technologies Europe Ltd Business Overview
Table 127. Aqua Technologies Europe Ltd HVAC Operations, Maintenance, and Repair Services Product
Table 128. Aqua Technologies Europe Ltd Revenue in HVAC Operations, Maintenance, and Repair Services Business (US$ Million), 2021–2026
Table 129. Aqua Technologies Europe Ltd Recent Development
Table 130. Gallagher HVAC Solutions Company Details
Table 131. Gallagher HVAC Solutions Business Overview
Table 132. Gallagher HVAC Solutions HVAC Operations, Maintenance, and Repair Services Product
Table 133. Gallagher HVAC Solutions Revenue in HVAC Operations, Maintenance, and Repair Services Business (US$ Million), 2021–2026
Table 134. Gallagher HVAC Solutions Recent Development
Table 135. Sescom Company Details
Table 136. Sescom Business Overview
Table 137. Sescom HVAC Operations, Maintenance, and Repair Services Product
Table 138. Sescom Revenue in HVAC Operations, Maintenance, and Repair Services Business (US$ Million), 2021–2026
Table 139. Sescom Recent Development
Table 140. Refricold Company Details
Table 141. Refricold Business Overview
Table 142. Refricold HVAC Operations, Maintenance, and Repair Services Product
Table 143. Refricold Revenue in HVAC Operations, Maintenance, and Repair Services Business (US$ Million), 2021–2026
Table 144. Refricold Recent Development
Table 145. Fujinetsu Co., Ltd Company Details
Table 146. Fujinetsu Co., Ltd Business Overview
Table 147. Fujinetsu Co., Ltd HVAC Operations, Maintenance, and Repair Services Product
Table 148. Fujinetsu Co., Ltd Revenue in HVAC Operations, Maintenance, and Repair Services Business (US$ Million), 2021–2026
Table 149. Fujinetsu Co., Ltd Recent Development
Table 150. CAREL Company Details
Table 151. CAREL Business Overview
Table 152. CAREL HVAC Operations, Maintenance, and Repair Services Product
Table 153. CAREL Revenue in HVAC Operations, Maintenance, and Repair Services Business (US$ Million), 2021–2026
Table 154. CAREL Recent Development
Table 155. Gree Company Details
Table 156. Gree Business Overview
Table 157. Gree HVAC Operations, Maintenance, and Repair Services Product
Table 158. Gree Revenue in HVAC Operations, Maintenance, and Repair Services Business (US$ Million), 2021–2026
Table 159. Gree Recent Development
Table 160. Midea Company Details
Table 161. Midea Business Overview
Table 162. Midea HVAC Operations, Maintenance, and Repair Services Product
Table 163. Midea Revenue in HVAC Operations, Maintenance, and Repair Services Business (US$ Million), 2021–2026
Table 164. Midea Recent Development
Table 165. Wolong Electric Company Details
Table 166. Wolong Electric Business Overview
Table 167. Wolong Electric HVAC Operations, Maintenance, and Repair Services Product
Table 168. Wolong Electric Revenue in HVAC Operations, Maintenance, and Repair Services Business (US$ Million), 2021–2026
Table 169. Wolong Electric Recent Development
Table 170. Research Programs/Design for This Report
Table 171. Key Data Information from Secondary Sources
Table 172. Key Data Information from Primary Sources
Table 173. Authors List of This Report
List of Figures
Figure 1. HVAC Operations, Maintenance, and Repair Services Picture
Figure 2. Global HVAC Operations, Maintenance, and Repair Services Market Size Comparison by Type (US$ Million), 2021–2032
Figure 3. Global HVAC Operations, Maintenance, and Repair Services Market Share by Type: 2025 vs 2032
Figure 4. Routine Operation and Management Services Features
Figure 5. Preventive Maintenance Services Features
Figure 6. Proactive Condition-Based Maintenance Services Features
Figure 7. Corrective Fault Repair Services Features
Figure 8. Others Features
Figure 9. Global HVAC Operations, Maintenance, and Repair Services Market Size Comparison by Service Modules (US$ Million), 2021–2032
Figure 10. Cold and Heat Source System Services Features
Figure 11. Air Handling and Delivery System Services Features
Figure 12. Water System Services Features
Figure 13. Control System Services Features
Figure 14. Others Features
Figure 15. Global HVAC Operations, Maintenance, and Repair Services Market Size Comparison by Service Modes (US$ Million), 2021–2032
Figure 16. Turnkey Maintenance Service Features
Figure 17. Partial Package Service Features
Figure 18. Time and Materials Service Features
Figure 19. Others Features
Figure 20. Global HVAC Operations, Maintenance, and Repair Services Market Size by Application (US$ Million), 2021–2032
Figure 21. Global HVAC Operations, Maintenance, and Repair Services Market Share by Application: 2025 vs 2032
Figure 22. Commercial Buildings Case Studies
Figure 23. Data Centers Case Studies
Figure 24. Hospitals Case Studies
Figure 25. Hotels Case Studies
Figure 26. Industrial Plants Case Studies
Figure 27. Residential Buildings Case Studies
Figure 28. Others Case Studies
Figure 29. HVAC Operations, Maintenance, and Repair Services Report Years Considered
Figure 30. Global HVAC Operations, Maintenance, and Repair Services Market Size (US$ Million), Year-over-Year: 2021–2032
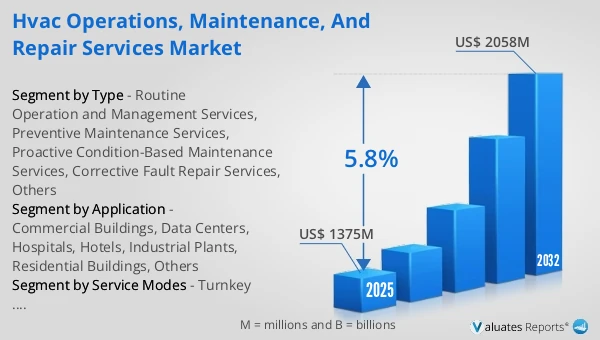
Figure 31. Global HVAC Operations, Maintenance, and Repair Services Market Size, (US$ Million), 2021 vs 2025 vs 2032
Figure 32. Global HVAC Operations, Maintenance, and Repair Services Market Share by Region: 2025 vs 2032
Figure 33. Global HVAC Operations, Maintenance, and Repair Services Market Share by Players in 2025
Figure 34. Global HVAC Operations, Maintenance, and Repair Services Market Share by Company Type (Tier 1, Tier 2, and Tier 3)
Figure 35. The Top 10 and 5 Players Market Share by HVAC Operations, Maintenance, and Repair Services Revenue in 2025
Figure 36. North America HVAC Operations, Maintenance, and Repair Services Market Size YoY Growth (US$ Million), 2021–2032
Figure 37. North America HVAC Operations, Maintenance, and Repair Services Market Share by Country (2021–2032)
Figure 38. United States HVAC Operations, Maintenance, and Repair Services Market Size YoY Growth (US$ Million), 2021–2032
Figure 39. Canada HVAC Operations, Maintenance, and Repair Services Market Size YoY Growth (US$ Million), 2021–2032
Figure 40. Europe HVAC Operations, Maintenance, and Repair Services Market Size YoY Growth (US$ Million), 2021–2032
Figure 41. Europe HVAC Operations, Maintenance, and Repair Services Market Share by Country (2021–2032)
Figure 42. Germany HVAC Operations, Maintenance, and Repair Services Market Size YoY Growth (US$ Million), 2021–2032
Figure 43. France HVAC Operations, Maintenance, and Repair Services Market Size YoY Growth (US$ Million), 2021–2032
Figure 44. U.K. HVAC Operations, Maintenance, and Repair Services Market Size YoY Growth (US$ Million), 2021–2032
Figure 45. Italy HVAC Operations, Maintenance, and Repair Services Market Size YoY Growth (US$ Million), 2021–2032
Figure 46. Russia HVAC Operations, Maintenance, and Repair Services Market Size YoY Growth (US$ Million), 2021–2032
Figure 47. Ireland HVAC Operations, Maintenance, and Repair Services Market Size YoY Growth (US$ Million), 2021–2032
Figure 48. Asia-Pacific HVAC Operations, Maintenance, and Repair Services Market Size YoY Growth (US$ Million), 2021–2032
Figure 49. Asia-Pacific HVAC Operations, Maintenance, and Repair Services Market Share by Region (2021–2032)
Figure 50. China HVAC Operations, Maintenance, and Repair Services Market Size YoY Growth (US$ Million), 2021–2032
Figure 51. Japan HVAC Operations, Maintenance, and Repair Services Market Size YoY Growth (US$ Million), 2021–2032
Figure 52. South Korea HVAC Operations, Maintenance, and Repair Services Market Size YoY Growth (US$ Million), 2021–2032
Figure 53. Southeast Asia HVAC Operations, Maintenance, and Repair Services Market Size YoY Growth (US$ Million), 2021–2032
Figure 54. India HVAC Operations, Maintenance, and Repair Services Market Size YoY Growth (US$ Million), 2021–2032
Figure 55. Australia & New Zealand HVAC Operations, Maintenance, and Repair Services Market Size YoY Growth (US$ Million), 2021–2032
Figure 56. Latin America HVAC Operations, Maintenance, and Repair Services Market Size YoY Growth (US$ Million), 2021–2032
Figure 57. Latin America HVAC Operations, Maintenance, and Repair Services Market Share by Country (2021–2032)
Figure 58. Mexico HVAC Operations, Maintenance, and Repair Services Market Size YoY Growth (US$ Million), 2021–2032
Figure 59. Brazil HVAC Operations, Maintenance, and Repair Services Market Size YoY Growth (US$ Million), 2021–2032
Figure 60. Middle East & Africa HVAC Operations, Maintenance, and Repair Services Market Size YoY Growth (US$ Million), 2021–2032
Figure 61. Middle East & Africa HVAC Operations, Maintenance, and Repair Services Market Share by Country (2021–2032)
Figure 62. Israel HVAC Operations, Maintenance, and Repair Services Market Size YoY Growth (US$ Million), 2021–2032
Figure 63. Saudi Arabia HVAC Operations, Maintenance, and Repair Services Market Size YoY Growth (US$ Million), 2021–2032
Figure 64. UAE HVAC Operations, Maintenance, and Repair Services Market Size YoY Growth (US$ Million), 2021–2032
Figure 65. Johnson Controls Revenue Growth Rate in HVAC Operations, Maintenance, and Repair Services Business (2021–2026)
Figure 66. Trane Revenue Growth Rate in HVAC Operations, Maintenance, and Repair Services Business (2021–2026)
Figure 67. NAC Mechanical & Electrical Services Revenue Growth Rate in HVAC Operations, Maintenance, and Repair Services Business (2021–2026)
Figure 68. Pilot Company Careers Revenue Growth Rate in HVAC Operations, Maintenance, and Repair Services Business (2021–2026)
Figure 69. Service HQ Revenue Growth Rate in HVAC Operations, Maintenance, and Repair Services Business (2021–2026)
Figure 70. Victorville Daily Press Revenue Growth Rate in HVAC Operations, Maintenance, and Repair Services Business (2021–2026)
Figure 71. Air Mechanical, Inc. Revenue Growth Rate in HVAC Operations, Maintenance, and Repair Services Business (2021–2026)
Figure 72. Quality Comfort Services, Inc. Revenue Growth Rate in HVAC Operations, Maintenance, and Repair Services Business (2021–2026)
Figure 73. O'Brien Service Company Revenue Growth Rate in HVAC Operations, Maintenance, and Repair Services Business (2021–2026)
Figure 74. EMCOR Services Aircond Revenue Growth Rate in HVAC Operations, Maintenance, and Repair Services Business (2021–2026)
Figure 75. Daikin Applied Revenue Growth Rate in HVAC Operations, Maintenance, and Repair Services Business (2021–2026)
Figure 76. USA Mechanical Revenue Growth Rate in HVAC Operations, Maintenance, and Repair Services Business (2021–2026)
Figure 77. Heinen & Hopman Revenue Growth Rate in HVAC Operations, Maintenance, and Repair Services Business (2021–2026)
Figure 78. Aqua Technologies Europe Ltd Revenue Growth Rate in HVAC Operations, Maintenance, and Repair Services Business (2021–2026)
Figure 79. Gallagher HVAC Solutions Revenue Growth Rate in HVAC Operations, Maintenance, and Repair Services Business (2021–2026)
Figure 80. Sescom Revenue Growth Rate in HVAC Operations, Maintenance, and Repair Services Business (2021–2026)
Figure 81. Refricold Revenue Growth Rate in HVAC Operations, Maintenance, and Repair Services Business (2021–2026)
Figure 82. Fujinetsu Co., Ltd Revenue Growth Rate in HVAC Operations, Maintenance, and Repair Services Business (2021–2026)
Figure 83. CAREL Revenue Growth Rate in HVAC Operations, Maintenance, and Repair Services Business (2021–2026)
Figure 84. Gree Revenue Growth Rate in HVAC Operations, Maintenance, and Repair Services Business (2021–2026)
Figure 85. Midea Revenue Growth Rate in HVAC Operations, Maintenance, and Repair Services Business (2021–2026)
Figure 86. Wolong Electric Revenue Growth Rate in HVAC Operations, Maintenance, and Repair Services Business (2021–2026)
Figure 87. Bottom-up and Top-down Approaches for This Report
Figure 88. Data Triangulation
Figure 89. Key Executives Interviewed