
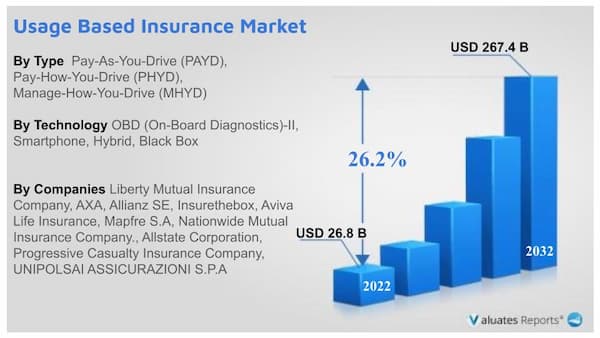
The global usage-based insurance market was valued at $26.8 billion in 2022, and is projected to reach $267.4 billion by 2032, growing at a CAGR of 26.2% from 2023 to 2032.
The growing number of vehicles on the road and concerns regarding driver safety will propel the growth of the usage-based insurance market during the forecast period. Moreover, The UBI market size is expected to be spurred on by the impact of covid 19 as transitioning to usage-based models has lowered insurance costs.
Technological advancements
The rapid integration of telematics has created huge opportunities for insurance companies. The in-vehicle monitoring of total distance traveled, driver behavior, braking, cornering, acceleration has allowed insurers to align the premium rates with driver and vehicle safety. This promotes safe driving, reduces pollution, fuel consumption, congestion, and accidents. Consumers are benefitted as lesser use of vehicles will typically reduce premium costs. This provides an incentive to drivers to prevent rash driving. These factors will ultimately propel the growth of the usage-based insurance market during the forecast period. The accurate pricing based on proper analysis provides convenience to insurance companies and attracts customers.
Problems related to driver safety
As per WHO(World Health Organization), about 1.3 million people die globally every year due to road crashes, accidents, and rash driving. This causes a significant loss to human lives and vehicle damage. Hence there is an urgent need for mitigating risks related to driver behavior. Usage-based insurance promotes safe driving behavior as statistics related to miles driven, phone use while driving, acceleration, hard braking, etc are analyzed. Safe driving reduces insurance costs and improves the overall driving score. UBI basically provides an incentive to reduce human errors. This in turn is expected to drive the growth of the usage-based insurance market in the coming years.
Covid 19 impact on UBI Market
Covid 19 has increased remote working models for people across the globe. Consumers are working from home which reduces the need for commutation. People are opting for UBI-based insurance plans for their vehicles as safer driving habits and lesser mileage create huge discounts in the premiums paid to the auto insurance companies. This has increased the adoption of UBI plans thereby driving the growth of the usage-based insurance market during the forecast period. The global shutdown in travel has encouraged organizations to come up with innovative pay as you drive, pay how you drive plans, pay as you go, or distance insurance.
The usage-based insurance market was led by the pay-as-you-drive segment in 2022 and is projected to maintain its dominance during the forecast period, the growth is attributed to encouragement to consumers to drive less, and green is expected to increase the demand for PAYD insurance policies in the global market.
The usage-based insurance market was dominated by north america in 2022 and is expected to retain its position during the forecast period. This is attributed to flexible driving, roadside assistance, and vehicle theft recovery.
The key players profiled in the usage-based insurance market analysis are Allianz SE, Allstate Corporation, Aviva, AXA, Insurethebox, Liberty Mutual Insurance, Mapfre S.A., Nationwide Mutual Insurance Company, Progressive Corporation and UNIPOLSAI ASSICURAZIONI S.P.A. These players have adopted various strategies to increase their market penetration and strengthen their position in the industry.
| Report Metric | Details |
| Report Name | UBI Market |
| The market size in 2022 | $26.8 billion |
| The revenue forecast in 2032 | $267.4 billion |
| Growth Rate | CAGR of 26.2% |
| Market size available for years | 2022-2032 |
| Forecast units | Value (USD) |
| Segments covered | Type, Application, Industry, Regions |
| Report coverage | Revenue & volume forecast, company share, competitive landscape, growth factors, and trends |
| Geographic regions covered | North America, Europe, Asia Pacific, Latin America, Middle East & Africa |
Chapter 1 : INTRODUCTION
Chapter 2 : EXECUTIVE SUMMARY
Chapter 3 : MARKET OVERVIEW
Chapter 4 : USAGE-BASED INSURANCE MARKET, BY POLICY TYPE
Chapter 5 : USAGE-BASED INSURANCE MARKET, BY TECHNOLOGY
Chapter 6 : USAGE-BASED INSURANCE MARKET, BY VEHICLE AGE
Chapter 7 : USAGE-BASED INSURANCE MARKET, BY VEHICLE TYPE
Chapter 8 : USAGE-BASED INSURANCE MARKET, BY REGION
Chapter 9 : COMPETITIVE LANDSCAPE
Chapter 10 : COMPANY PROFILES
List of Tables:
TABLE 01. GLOBAL USAGE-BASED INSURANCE MARKET, BY POLICY TYPE, 2022-2032 ($MILLION)
TABLE 02. USAGE-BASED INSURANCE MARKET FOR PAY-AS-YOU-DRIVE (PAYD), BY REGION, 2022-2032 ($MILLION)
TABLE 03. USAGE-BASED INSURANCE MARKET FOR PAY-HOW-YOU-DRIVE (PHYD), BY REGION, 2022-2032 ($MILLION)
TABLE 04. USAGE-BASED INSURANCE MARKET FOR MANAGE-HOW-YOU-DRIVE (MHYD), BY REGION, 2022-2032 ($MILLION)
TABLE 05. GLOBAL USAGE-BASED INSURANCE MARKET, BY TECHNOLOGY, 2022-2032 ($MILLION)
TABLE 06. USAGE-BASED INSURANCE MARKET FOR OBD (ON-BOARD DIAGNOSTICS)-II, BY REGION, 2022-2032 ($MILLION)
TABLE 07. USAGE-BASED INSURANCE MARKET FOR SMARTPHONE, BY REGION, 2022-2032 ($MILLION)
TABLE 08. USAGE-BASED INSURANCE MARKET FOR HYBRID, BY REGION, 2022-2032 ($MILLION)
TABLE 09. USAGE-BASED INSURANCE MARKET FOR BLACK BOX, BY REGION, 2022-2032 ($MILLION)
TABLE 10. GLOBAL USAGE-BASED INSURANCE MARKET, BY VEHICLE AGE, 2022-2032 ($MILLION)
TABLE 11. USAGE-BASED INSURANCE MARKET FOR NEW VEHICLES, BY REGION, 2022-2032 ($MILLION)
TABLE 12. USAGE-BASED INSURANCE MARKET FOR USED VEHICLES, BY REGION, 2022-2032 ($MILLION)
TABLE 13. GLOBAL USAGE-BASED INSURANCE MARKET, BY VEHICLE TYPE, 2022-2032 ($MILLION)
TABLE 14. USAGE-BASED INSURANCE MARKET FOR LIGHT-DUTY VEHICLE (LDV), BY REGION, 2022-2032 ($MILLION)
TABLE 15. USAGE-BASED INSURANCE MARKET FOR HEAVY-DUTY VEHICLE (HDV), BY REGION, 2022-2032 ($MILLION)
TABLE 16. USAGE-BASED INSURANCE MARKET, BY REGION, 2022-2032 ($MILLION)
TABLE 17. NORTH AMERICA USAGE-BASED INSURANCE MARKET, BY POLICY TYPE, 2022-2032 ($MILLION)
TABLE 18. NORTH AMERICA USAGE-BASED INSURANCE MARKET, BY TECHNOLOGY, 2022-2032 ($MILLION)
TABLE 19. NORTH AMERICA USAGE-BASED INSURANCE MARKET, BY VEHICLE AGE, 2022-2032 ($MILLION)
TABLE 20. NORTH AMERICA USAGE-BASED INSURANCE MARKET, BY VEHICLE TYPE, 2022-2032 ($MILLION)
TABLE 21. NORTH AMERICA USAGE-BASED INSURANCE MARKET, BY COUNTRY, 2022-2032 ($MILLION)
TABLE 22. U.S. USAGE-BASED INSURANCE MARKET, BY POLICY TYPE, 2022-2032 ($MILLION)
TABLE 23. U.S. USAGE-BASED INSURANCE MARKET, BY TECHNOLOGY, 2022-2032 ($MILLION)
TABLE 24. U.S. USAGE-BASED INSURANCE MARKET, BY VEHICLE AGE, 2022-2032 ($MILLION)
TABLE 25. U.S. USAGE-BASED INSURANCE MARKET, BY VEHICLE TYPE, 2022-2032 ($MILLION)
TABLE 26. CANADA USAGE-BASED INSURANCE MARKET, BY POLICY TYPE, 2022-2032 ($MILLION)
TABLE 27. CANADA USAGE-BASED INSURANCE MARKET, BY TECHNOLOGY, 2022-2032 ($MILLION)
TABLE 28. CANADA USAGE-BASED INSURANCE MARKET, BY VEHICLE AGE, 2022-2032 ($MILLION)
TABLE 29. CANADA USAGE-BASED INSURANCE MARKET, BY VEHICLE TYPE, 2022-2032 ($MILLION)
TABLE 30. EUROPE USAGE-BASED INSURANCE MARKET, BY POLICY TYPE, 2022-2032 ($MILLION)
TABLE 31. EUROPE USAGE-BASED INSURANCE MARKET, BY TECHNOLOGY, 2022-2032 ($MILLION)
TABLE 32. EUROPE USAGE-BASED INSURANCE MARKET, BY VEHICLE AGE, 2022-2032 ($MILLION)
TABLE 33. EUROPE USAGE-BASED INSURANCE MARKET, BY VEHICLE TYPE, 2022-2032 ($MILLION)
TABLE 34. EUROPE USAGE-BASED INSURANCE MARKET, BY COUNTRY, 2022-2032 ($MILLION)
TABLE 35. UK USAGE-BASED INSURANCE MARKET, BY POLICY TYPE, 2022-2032 ($MILLION)
TABLE 36. UK USAGE-BASED INSURANCE MARKET, BY TECHNOLOGY, 2022-2032 ($MILLION)
TABLE 37. UK USAGE-BASED INSURANCE MARKET, BY VEHICLE AGE, 2022-2032 ($MILLION)
TABLE 38. UK USAGE-BASED INSURANCE MARKET, BY VEHICLE TYPE, 2022-2032 ($MILLION)
TABLE 39. GERMANY USAGE-BASED INSURANCE MARKET, BY POLICY TYPE, 2022-2032 ($MILLION)
TABLE 40. GERMANY USAGE-BASED INSURANCE MARKET, BY TECHNOLOGY, 2022-2032 ($MILLION)
TABLE 41. GERMANY USAGE-BASED INSURANCE MARKET, BY VEHICLE AGE, 2022-2032 ($MILLION)
TABLE 42. GERMANY USAGE-BASED INSURANCE MARKET, BY VEHICLE TYPE, 2022-2032 ($MILLION)
TABLE 43. FRANCE USAGE-BASED INSURANCE MARKET, BY POLICY TYPE, 2022-2032 ($MILLION)
TABLE 44. FRANCE USAGE-BASED INSURANCE MARKET, BY TECHNOLOGY, 2022-2032 ($MILLION)
TABLE 45. FRANCE USAGE-BASED INSURANCE MARKET, BY VEHICLE AGE, 2022-2032 ($MILLION)
TABLE 46. FRANCE USAGE-BASED INSURANCE MARKET, BY VEHICLE TYPE, 2022-2032 ($MILLION)
TABLE 47. ITALY USAGE-BASED INSURANCE MARKET, BY POLICY TYPE, 2022-2032 ($MILLION)
TABLE 48. ITALY USAGE-BASED INSURANCE MARKET, BY TECHNOLOGY, 2022-2032 ($MILLION)
TABLE 49. ITALY USAGE-BASED INSURANCE MARKET, BY VEHICLE AGE, 2022-2032 ($MILLION)
TABLE 50. ITALY USAGE-BASED INSURANCE MARKET, BY VEHICLE TYPE, 2022-2032 ($MILLION)
TABLE 51. SPAIN USAGE-BASED INSURANCE MARKET, BY POLICY TYPE, 2022-2032 ($MILLION)
TABLE 52. SPAIN USAGE-BASED INSURANCE MARKET, BY TECHNOLOGY, 2022-2032 ($MILLION)
TABLE 53. SPAIN USAGE-BASED INSURANCE MARKET, BY VEHICLE AGE, 2022-2032 ($MILLION)
TABLE 54. SPAIN USAGE-BASED INSURANCE MARKET, BY VEHICLE TYPE, 2022-2032 ($MILLION)
TABLE 55. REST OF EUROPE USAGE-BASED INSURANCE MARKET, BY POLICY TYPE, 2022-2032 ($MILLION)
TABLE 56. REST OF EUROPE USAGE-BASED INSURANCE MARKET, BY TECHNOLOGY, 2022-2032 ($MILLION)
TABLE 57. REST OF EUROPE USAGE-BASED INSURANCE MARKET, BY VEHICLE AGE, 2022-2032 ($MILLION)
TABLE 58. REST OF EUROPE USAGE-BASED INSURANCE MARKET, BY VEHICLE TYPE, 2022-2032 ($MILLION)
TABLE 59. ASIA-PACIFIC USAGE-BASED INSURANCE MARKET, BY POLICY TYPE, 2022-2032 ($MILLION)
TABLE 60. ASIA-PACIFIC USAGE-BASED INSURANCE MARKET, BY TECHNOLOGY, 2022-2032 ($MILLION)
TABLE 61. ASIA-PACIFIC USAGE-BASED INSURANCE MARKET, BY VEHICLE AGE, 2022-2032 ($MILLION)
TABLE 62. ASIA-PACIFIC USAGE-BASED INSURANCE MARKET, BY VEHICLE TYPE, 2022-2032 ($MILLION)
TABLE 63. ASIA-PACIFIC USAGE-BASED INSURANCE MARKET, BY COUNTRY, 2022-2032 ($MILLION)
TABLE 64. CHINA USAGE-BASED INSURANCE MARKET, BY POLICY TYPE, 2022-2032 ($MILLION)
TABLE 65. CHINA USAGE-BASED INSURANCE MARKET, BY TECHNOLOGY, 2022-2032 ($MILLION)
TABLE 66. CHINA USAGE-BASED INSURANCE MARKET, BY VEHICLE AGE, 2022-2032 ($MILLION)
TABLE 67. CHINA USAGE-BASED INSURANCE MARKET, BY VEHICLE TYPE, 2022-2032 ($MILLION)
TABLE 68. JAPAN USAGE-BASED INSURANCE MARKET, BY POLICY TYPE, 2022-2032 ($MILLION)
TABLE 69. JAPAN USAGE-BASED INSURANCE MARKET, BY TECHNOLOGY, 2022-2032 ($MILLION)
TABLE 70. JAPAN USAGE-BASED INSURANCE MARKET, BY VEHICLE AGE, 2022-2032 ($MILLION)
TABLE 71. JAPAN USAGE-BASED INSURANCE MARKET, BY VEHICLE TYPE, 2022-2032 ($MILLION)
TABLE 72. INDIA USAGE-BASED INSURANCE MARKET, BY POLICY TYPE, 2022-2032 ($MILLION)
TABLE 73. INDIA USAGE-BASED INSURANCE MARKET, BY TECHNOLOGY, 2022-2032 ($MILLION)
TABLE 74. INDIA USAGE-BASED INSURANCE MARKET, BY VEHICLE AGE, 2022-2032 ($MILLION)
TABLE 75. INDIA USAGE-BASED INSURANCE MARKET, BY VEHICLE TYPE, 2022-2032 ($MILLION)
TABLE 76. AUSTRALIA USAGE-BASED INSURANCE MARKET, BY POLICY TYPE, 2022-2032 ($MILLION)
TABLE 77. AUSTRALIA USAGE-BASED INSURANCE MARKET, BY TECHNOLOGY, 2022-2032 ($MILLION)
TABLE 78. AUSTRALIA USAGE-BASED INSURANCE MARKET, BY VEHICLE AGE, 2022-2032 ($MILLION)
TABLE 79. AUSTRALIA USAGE-BASED INSURANCE MARKET, BY VEHICLE TYPE, 2022-2032 ($MILLION)
TABLE 80. SOUTH KOREA USAGE-BASED INSURANCE MARKET, BY POLICY TYPE, 2022-2032 ($MILLION)
TABLE 81. SOUTH KOREA USAGE-BASED INSURANCE MARKET, BY TECHNOLOGY, 2022-2032 ($MILLION)
TABLE 82. SOUTH KOREA USAGE-BASED INSURANCE MARKET, BY VEHICLE AGE, 2022-2032 ($MILLION)
TABLE 83. SOUTH KOREA USAGE-BASED INSURANCE MARKET, BY VEHICLE TYPE, 2022-2032 ($MILLION)
TABLE 84. REST OF ASIA-PACIFIC USAGE-BASED INSURANCE MARKET, BY POLICY TYPE, 2022-2032 ($MILLION)
TABLE 85. REST OF ASIA-PACIFIC USAGE-BASED INSURANCE MARKET, BY TECHNOLOGY, 2022-2032 ($MILLION)
TABLE 86. REST OF ASIA-PACIFIC USAGE-BASED INSURANCE MARKET, BY VEHICLE AGE, 2022-2032 ($MILLION)
TABLE 87. REST OF ASIA-PACIFIC USAGE-BASED INSURANCE MARKET, BY VEHICLE TYPE, 2022-2032 ($MILLION)
TABLE 88. LAMEA USAGE-BASED INSURANCE MARKET, BY POLICY TYPE, 2022-2032 ($MILLION)
TABLE 89. LAMEA USAGE-BASED INSURANCE MARKET, BY TECHNOLOGY, 2022-2032 ($MILLION)
TABLE 90. LAMEA USAGE-BASED INSURANCE MARKET, BY VEHICLE AGE, 2022-2032 ($MILLION)
TABLE 91. LAMEA USAGE-BASED INSURANCE MARKET, BY VEHICLE TYPE, 2022-2032 ($MILLION)
TABLE 92. LAMEA USAGE-BASED INSURANCE MARKET, BY COUNTRY, 2022-2032 ($MILLION)
TABLE 93. LATIN AMERICA USAGE-BASED INSURANCE MARKET, BY POLICY TYPE, 2022-2032 ($MILLION)
TABLE 94. LATIN AMERICA USAGE-BASED INSURANCE MARKET, BY TECHNOLOGY, 2022-2032 ($MILLION)
TABLE 95. LATIN AMERICA USAGE-BASED INSURANCE MARKET, BY VEHICLE AGE, 2022-2032 ($MILLION)
TABLE 96. LATIN AMERICA USAGE-BASED INSURANCE MARKET, BY VEHICLE TYPE, 2022-2032 ($MILLION)
TABLE 97. MIDDLE EAST USAGE-BASED INSURANCE MARKET, BY POLICY TYPE, 2022-2032 ($MILLION)
TABLE 98. MIDDLE EAST USAGE-BASED INSURANCE MARKET, BY TECHNOLOGY, 2022-2032 ($MILLION)
TABLE 99. MIDDLE EAST USAGE-BASED INSURANCE MARKET, BY VEHICLE AGE, 2022-2032 ($MILLION)
TABLE 100. MIDDLE EAST USAGE-BASED INSURANCE MARKET, BY VEHICLE TYPE, 2022-2032 ($MILLION)
TABLE 101. AFRICA USAGE-BASED INSURANCE MARKET, BY POLICY TYPE, 2022-2032 ($MILLION)
TABLE 102. AFRICA USAGE-BASED INSURANCE MARKET, BY TECHNOLOGY, 2022-2032 ($MILLION)
TABLE 103. AFRICA USAGE-BASED INSURANCE MARKET, BY VEHICLE AGE, 2022-2032 ($MILLION)
TABLE 104. AFRICA USAGE-BASED INSURANCE MARKET, BY VEHICLE TYPE, 2022-2032 ($MILLION)
TABLE 105. ALLIANZ SE: KEY EXECUTIVES
TABLE 106. ALLIANZ SE: COMPANY SNAPSHOT
TABLE 107. ALLIANZ SE: SERVICE SEGMENTS
TABLE 108. ALLIANZ SE: PRODUCT PORTFOLIO
TABLE 109. ALLIANZ SE: KEY STRATEGIES
TABLE 110. ALLSTATE CORPORATION: KEY EXECUTIVES
TABLE 111. ALLSTATE CORPORATION: COMPANY SNAPSHOT
TABLE 112. ALLSTATE CORPORATION: SERVICE SEGMENTS
TABLE 113. ALLSTATE CORPORATION: PRODUCT PORTFOLIO
TABLE 114. ALLSTATE CORPORATION: KEY STRATEGIES
TABLE 115. AVIVA LIFE INSURANCE: KEY EXECUTIVES
TABLE 116. AVIVA LIFE INSURANCE: COMPANY SNAPSHOT
TABLE 117. AVIVA LIFE INSURANCE: SERVICE SEGMENTS
TABLE 118. AVIVA LIFE INSURANCE: PRODUCT PORTFOLIO
TABLE 119. AVIVA LIFE INSURANCE: KEY STRATEGIES
TABLE 120. INSURETHEBOX: KEY EXECUTIVES
TABLE 121. INSURETHEBOX: COMPANY SNAPSHOT
TABLE 122. INSURETHEBOX: SERVICE SEGMENTS
TABLE 123. INSURETHEBOX: PRODUCT PORTFOLIO
TABLE 124. LIBERTY MUTUAL INSURANCE COMPANY: KEY EXECUTIVES
TABLE 125. LIBERTY MUTUAL INSURANCE COMPANY: COMPANY SNAPSHOT
TABLE 126. LIBERTY MUTUAL INSURANCE COMPANY: SERVICE SEGMENTS
TABLE 127. LIBERTY MUTUAL INSURANCE COMPANY: PRODUCT PORTFOLIO
TABLE 128. LIBERTY MUTUAL INSURANCE COMPANY: KEY STRATEGIES
TABLE 129. MAPFRE S.A: KEY EXECUTIVES
TABLE 130. MAPFRE S.A: COMPANY SNAPSHOT
TABLE 131. MAPFRE S.A: SERVICE SEGMENTS
TABLE 132. MAPFRE S.A: PRODUCT PORTFOLIO
TABLE 133. MAPFRE S.A: KEY STRATEGIES
TABLE 134. AXA: KEY EXECUTIVES
TABLE 135. AXA: COMPANY SNAPSHOT
TABLE 136. AXA: SERVICE SEGMENTS
TABLE 137. AXA: PRODUCT PORTFOLIO
TABLE 138. AXA: KEY STRATEGIES
TABLE 139. NATIONWIDE MUTUAL INSURANCE COMPANY.: KEY EXECUTIVES
TABLE 140. NATIONWIDE MUTUAL INSURANCE COMPANY.: COMPANY SNAPSHOT
TABLE 141. NATIONWIDE MUTUAL INSURANCE COMPANY.: SERVICE SEGMENTS
TABLE 142. NATIONWIDE MUTUAL INSURANCE COMPANY.: PRODUCT PORTFOLIO
TABLE 143. NATIONWIDE MUTUAL INSURANCE COMPANY.: KEY STRATEGIES
TABLE 144. UNIPOLSAI ASSICURAZIONI S.P.A: KEY EXECUTIVES
TABLE 145. UNIPOLSAI ASSICURAZIONI S.P.A: COMPANY SNAPSHOT
TABLE 146. UNIPOLSAI ASSICURAZIONI S.P.A: SERVICE SEGMENTS
TABLE 147. UNIPOLSAI ASSICURAZIONI S.P.A: PRODUCT PORTFOLIO
TABLE 148. PROGRESSIVE CASUALTY INSURANCE COMPANY: KEY EXECUTIVES
TABLE 149. PROGRESSIVE CASUALTY INSURANCE COMPANY: COMPANY SNAPSHOT
TABLE 150. PROGRESSIVE CASUALTY INSURANCE COMPANY: SERVICE SEGMENTS
TABLE 151. PROGRESSIVE CASUALTY INSURANCE COMPANY: PRODUCT PORTFOLIO
TABLE 152. PROGRESSIVE CASUALTY INSURANCE COMPANY: KEY STRATEGIES
List of Figures:
FIGURE 01. USAGE-BASED INSURANCE MARKET, 2022-2032
FIGURE 02. SEGMENTATION OF USAGE-BASED INSURANCE MARKET,2022-2032
FIGURE 03. TOP IMPACTING FACTORS IN USAGE-BASED INSURANCE MARKET (2022 TO 2032)
FIGURE 04. TOP INVESTMENT POCKETS IN USAGE-BASED INSURANCE MARKET (2023-2032)
FIGURE 05. LOW BARGAINING POWER OF SUPPLIERS
FIGURE 06. LOW THREAT OF NEW ENTRANTS
FIGURE 07. LOW THREAT OF SUBSTITUTES
FIGURE 08. LOW INTENSITY OF RIVALRY
FIGURE 09. LOW BARGAINING POWER OF BUYERS
FIGURE 10. GLOBAL USAGE-BASED INSURANCE MARKET:DRIVERS, RESTRAINTS AND OPPORTUNITIES
FIGURE 11. USAGE-BASED INSURANCE MARKET, BY POLICY TYPE, 2022 AND 2032(%)
FIGURE 12. COMPARATIVE SHARE ANALYSIS OF USAGE-BASED INSURANCE MARKET FOR PAY-AS-YOU-DRIVE (PAYD), BY COUNTRY 2022 AND 2032(%)
FIGURE 13. COMPARATIVE SHARE ANALYSIS OF USAGE-BASED INSURANCE MARKET FOR PAY-HOW-YOU-DRIVE (PHYD), BY COUNTRY 2022 AND 2032(%)
FIGURE 14. COMPARATIVE SHARE ANALYSIS OF USAGE-BASED INSURANCE MARKET FOR MANAGE-HOW-YOU-DRIVE (MHYD), BY COUNTRY 2022 AND 2032(%)
FIGURE 15. USAGE-BASED INSURANCE MARKET, BY TECHNOLOGY, 2022 AND 2032(%)
FIGURE 16. COMPARATIVE SHARE ANALYSIS OF USAGE-BASED INSURANCE MARKET FOR OBD (ON-BOARD DIAGNOSTICS)-II, BY COUNTRY 2022 AND 2032(%)
FIGURE 17. COMPARATIVE SHARE ANALYSIS OF USAGE-BASED INSURANCE MARKET FOR SMARTPHONE, BY COUNTRY 2022 AND 2032(%)
FIGURE 18. COMPARATIVE SHARE ANALYSIS OF USAGE-BASED INSURANCE MARKET FOR HYBRID, BY COUNTRY 2022 AND 2032(%)
FIGURE 19. COMPARATIVE SHARE ANALYSIS OF USAGE-BASED INSURANCE MARKET FOR BLACK BOX, BY COUNTRY 2022 AND 2032(%)
FIGURE 20. USAGE-BASED INSURANCE MARKET, BY VEHICLE AGE, 2022 AND 2032(%)
FIGURE 21. COMPARATIVE SHARE ANALYSIS OF USAGE-BASED INSURANCE MARKET FOR NEW VEHICLES, BY COUNTRY 2022 AND 2032(%)
FIGURE 22. COMPARATIVE SHARE ANALYSIS OF USAGE-BASED INSURANCE MARKET FOR USED VEHICLES, BY COUNTRY 2022 AND 2032(%)
FIGURE 23. USAGE-BASED INSURANCE MARKET, BY VEHICLE TYPE, 2022 AND 2032(%)
FIGURE 24. COMPARATIVE SHARE ANALYSIS OF USAGE-BASED INSURANCE MARKET FOR LIGHT-DUTY VEHICLE (LDV), BY COUNTRY 2022 AND 2032(%)
FIGURE 25. COMPARATIVE SHARE ANALYSIS OF USAGE-BASED INSURANCE MARKET FOR HEAVY-DUTY VEHICLE (HDV), BY COUNTRY 2022 AND 2032(%)
FIGURE 26. USAGE-BASED INSURANCE MARKET BY REGION, 2022 AND 2032(%)
FIGURE 27. U.S. USAGE-BASED INSURANCE MARKET, 2022-2032 ($MILLION)
FIGURE 28. CANADA USAGE-BASED INSURANCE MARKET, 2022-2032 ($MILLION)
FIGURE 29. UK USAGE-BASED INSURANCE MARKET, 2022-2032 ($MILLION)
FIGURE 30. GERMANY USAGE-BASED INSURANCE MARKET, 2022-2032 ($MILLION)
FIGURE 31. FRANCE USAGE-BASED INSURANCE MARKET, 2022-2032 ($MILLION)
FIGURE 32. ITALY USAGE-BASED INSURANCE MARKET, 2022-2032 ($MILLION)
FIGURE 33. SPAIN USAGE-BASED INSURANCE MARKET, 2022-2032 ($MILLION)
FIGURE 34. REST OF EUROPE USAGE-BASED INSURANCE MARKET, 2022-2032 ($MILLION)
FIGURE 35. CHINA USAGE-BASED INSURANCE MARKET, 2022-2032 ($MILLION)
FIGURE 36. JAPAN USAGE-BASED INSURANCE MARKET, 2022-2032 ($MILLION)
FIGURE 37. INDIA USAGE-BASED INSURANCE MARKET, 2022-2032 ($MILLION)
FIGURE 38. AUSTRALIA USAGE-BASED INSURANCE MARKET, 2022-2032 ($MILLION)
FIGURE 39. SOUTH KOREA USAGE-BASED INSURANCE MARKET, 2022-2032 ($MILLION)
FIGURE 40. REST OF ASIA-PACIFIC USAGE-BASED INSURANCE MARKET, 2022-2032 ($MILLION)
FIGURE 41. LATIN AMERICA USAGE-BASED INSURANCE MARKET, 2022-2032 ($MILLION)
FIGURE 42. MIDDLE EAST USAGE-BASED INSURANCE MARKET, 2022-2032 ($MILLION)
FIGURE 43. AFRICA USAGE-BASED INSURANCE MARKET, 2022-2032 ($MILLION)
FIGURE 44. TOP WINNING STRATEGIES, BY YEAR (2019-2023)
FIGURE 45. TOP WINNING STRATEGIES, BY DEVELOPMENT (2019-2023)
FIGURE 46. TOP WINNING STRATEGIES, BY COMPANY (2019-2023)
FIGURE 47. PRODUCT MAPPING OF TOP 10 PLAYERS
FIGURE 48. COMPETITIVE DASHBOARD
FIGURE 49. COMPETITIVE HEATMAP: USAGE-BASED INSURANCE MARKET
FIGURE 50. TOP PLAYER POSITIONING, 2022
FIGURE 51. ALLIANZ SE: NET REVENUE, 2020-2022 ($MILLION)
FIGURE 52. ALLIANZ SE: REVENUE SHARE BY SEGMENT, 2022 (%)
FIGURE 53. ALLSTATE CORPORATION: NET REVENUE, 2020-2022 ($MILLION)
FIGURE 54. ALLSTATE CORPORATION: REVENUE SHARE BY SEGMENT, 2022 (%)
FIGURE 55. ALLSTATE CORPORATION: REVENUE SHARE BY REGION, 2022 (%)
FIGURE 56. LIBERTY MUTUAL INSURANCE COMPANY: NET REVENUE, 2020-2022 ($MILLION)
FIGURE 57. LIBERTY MUTUAL INSURANCE COMPANY: REVENUE SHARE BY REGION, 2022 (%)
FIGURE 58. AXA: NET REVENUE, 2020-2022 ($BILLION)
FIGURE 59. AXA: REVENUE SHARE BY SEGMENT, 2022 (%)
FIGURE 60. AXA: REVENUE SHARE BY REGION, 2022 (%)
FIGURE 61. PROGRESSIVE CASUALTY INSURANCE COMPANY: NET REVENUE, 2020-2022 ($MILLION)
FIGURE 62. PROGRESSIVE CASUALTY INSURANCE COMPANY: REVENUE SHARE BY SEGMENT, 2022 (%)
$5730
$9600
HAVE A QUERY?
OUR CUSTOMER
