1 Market Overview
1.1 Aluminum Alloy Powder for 3D Pringting Product Introduction
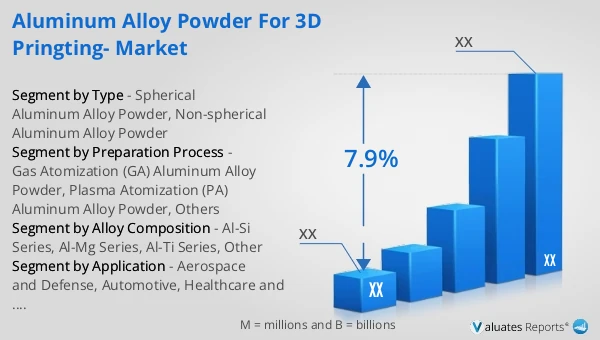
1.2 Global Aluminum Alloy Powder for 3D Pringting Market Size Forecast
1.2.1 Global Aluminum Alloy Powder for 3D Pringting Sales Value (2021–2032)
1.2.2 Global Aluminum Alloy Powder for 3D Pringting Sales Volume (2021–2032)
1.2.3 Global Aluminum Alloy Powder for 3D Pringting Sales Price (2021–2032)
1.3 Aluminum Alloy Powder for 3D Pringting Market Trends & Drivers
1.3.1 Aluminum Alloy Powder for 3D Pringting Industry Trends
1.3.2 Aluminum Alloy Powder for 3D Pringting Market Drivers & Opportunities
1.3.3 Aluminum Alloy Powder for 3D Pringting Market Challenges
1.3.4 Aluminum Alloy Powder for 3D Pringting Market Restraints
1.3.5 Impact of U.S. Tariffs
1.4 Assumptions and Limitations
1.5 Study Objectives
1.6 Years Considered
2 Competitive Analysis by Company
2.1 Global Aluminum Alloy Powder for 3D Pringting Players Revenue Ranking (2025)
2.2 Global Aluminum Alloy Powder for 3D Pringting Revenue by Company (2021–2026)
2.3 Global Aluminum Alloy Powder for 3D Pringting Sales Volume Ranking of Players (2025)
2.4 Global Aluminum Alloy Powder for 3D Pringting Sales Volume by Company (2021–2026)
2.5 Global Aluminum Alloy Powder for 3D Pringting Average Price by Company (2021–2026)
2.6 Key Manufacturers Aluminum Alloy Powder for 3D Pringting Manufacturing Base and Headquarters
2.7 Key Manufacturers Aluminum Alloy Powder for 3D Pringting Product Offerings
2.8 Key Manufacturers Start of Mass Production of Aluminum Alloy Powder for 3D Pringting
2.9 Aluminum Alloy Powder for 3D Pringting Market Competitive Analysis
2.9.1 Aluminum Alloy Powder for 3D Pringting Market Concentration Rate (2021–2026)
2.9.2 Global 5 and 10 Largest Manufacturers by Aluminum Alloy Powder for 3D Pringting Revenue in 2025
2.9.3 Global Companies by Tier (Tier 1, Tier 2, Tier 3), based on Aluminum Alloy Powder for 3D Pringting revenue, 2025
2.10 Mergers & Acquisitions and Expansion
3 Segmentation Aluminum Alloy Powder for 3D Pringting Market Classification
3.1 Introduction by Type
3.1.1 Spherical Aluminum Alloy Powder
3.1.2 Non-spherical Aluminum Alloy Powder
3.1.3 Global Aluminum Alloy Powder for 3D Pringting Sales Value by Type
3.1.3.1 Global Aluminum Alloy Powder for 3D Pringting Sales Value by Type (2021 vs 2025 vs 2032)
3.1.3.2 Global Aluminum Alloy Powder for 3D Pringting Sales Value, by Type (2021–2032)
3.1.3.3 Global Aluminum Alloy Powder for 3D Pringting Sales Value, by Type (%), 2021–2032
3.1.4 Global Aluminum Alloy Powder for 3D Pringting Sales Volume by Type
3.1.4.1 Global Aluminum Alloy Powder for 3D Pringting Sales Volume by Type (2021 vs 2025 vs 2032)
3.1.4.2 Global Aluminum Alloy Powder for 3D Pringting Sales Volume, by Type (2021–2032)
3.1.4.3 Global Aluminum Alloy Powder for 3D Pringting Sales Volume, by Type (%), 2021–2032
3.1.5 Global Aluminum Alloy Powder for 3D Pringting Average Price by Type (2021–2032)
3.2 Introduction by Alloy Composition
3.2.1 Al-Si Series
3.2.2 Al-Mg Series
3.2.3 Al-Ti Series
3.2.4 Other
3.2.5 Global Aluminum Alloy Powder for 3D Pringting Sales Value by Alloy Composition
3.2.5.1 Global Aluminum Alloy Powder for 3D Pringting Sales Value by Alloy Composition (2021 vs 2025 vs 2032)
3.2.5.2 Global Aluminum Alloy Powder for 3D Pringting Sales Value, by Alloy Composition (2021–2032)
3.2.5.3 Global Aluminum Alloy Powder for 3D Pringting Sales Value, by Alloy Composition (%), 2021–2032
3.2.6 Global Aluminum Alloy Powder for 3D Pringting Sales Volume by Alloy Composition
3.2.6.1 Global Aluminum Alloy Powder for 3D Pringting Sales Volume by Alloy Composition (2021 vs 2025 vs 2032)
3.2.6.2 Global Aluminum Alloy Powder for 3D Pringting Sales Volume, by Alloy Composition (2021–2032)
3.2.6.3 Global Aluminum Alloy Powder for 3D Pringting Sales Volume, by Alloy Composition (%), 2021–2032
3.2.7 Global Aluminum Alloy Powder for 3D Pringting Average Price by Alloy Composition (2021–2032)
3.3 Introduction by Preparation Process
3.3.1 Gas Atomization (GA) Aluminum Alloy Powder
3.3.2 Plasma Atomization (PA) Aluminum Alloy Powder
3.3.3 Others
3.3.4 Global Aluminum Alloy Powder for 3D Pringting Sales Value by Preparation Process
3.3.4.1 Global Aluminum Alloy Powder for 3D Pringting Sales Value by Preparation Process (2021 vs 2025 vs 2032)
3.3.4.2 Global Aluminum Alloy Powder for 3D Pringting Sales Value, by Preparation Process (2021–2032)
3.3.4.3 Global Aluminum Alloy Powder for 3D Pringting Sales Value, by Preparation Process (%), 2021–2032
3.3.5 Global Aluminum Alloy Powder for 3D Pringting Sales Volume by Preparation Process
3.3.5.1 Global Aluminum Alloy Powder for 3D Pringting Sales Volume by Preparation Process (2021 vs 2025 vs 2032)
3.3.5.2 Global Aluminum Alloy Powder for 3D Pringting Sales Volume, by Preparation Process (2021–2032)
3.3.5.3 Global Aluminum Alloy Powder for 3D Pringting Sales Volume, by Preparation Process (%), 2021–2032
3.3.6 Global Aluminum Alloy Powder for 3D Pringting Average Price by Preparation Process (2021–2032)
4 Segmentation by Application
4.1 Introduction by Application
4.1.1 Aerospace and Defense
4.1.2 Automotive
4.1.3 Healthcare and Dental
4.1.4 Industrial
4.1.5 Others
4.2 Global Aluminum Alloy Powder for 3D Pringting Sales Value by Application
4.2.1 Global Aluminum Alloy Powder for 3D Pringting Sales Value by Application (2021 vs 2025 vs 2032)
4.2.2 Global Aluminum Alloy Powder for 3D Pringting Sales Value, by Application (2021–2032)
4.2.3 Global Aluminum Alloy Powder for 3D Pringting Sales Value, by Application (%), 2021–2032
4.3 Global Aluminum Alloy Powder for 3D Pringting Sales Volume by Application
4.3.1 Global Aluminum Alloy Powder for 3D Pringting Sales Volume by Application (2021 vs 2025 vs 2032)
4.3.2 Global Aluminum Alloy Powder for 3D Pringting Sales Volume, by Application (2021–2032)
4.3.3 Global Aluminum Alloy Powder for 3D Pringting Sales Volume, by Application (%), 2021–2032
4.4 Global Aluminum Alloy Powder for 3D Pringting Average Price by Application (2021–2032)
5 Segmentation by Region
5.1 Global Aluminum Alloy Powder for 3D Pringting Sales Value by Region
5.1.1 Global Aluminum Alloy Powder for 3D Pringting Sales Value by Region: 2021 vs 2025 vs 2032
5.1.2 Global Aluminum Alloy Powder for 3D Pringting Sales Value by Region (2021–2026)
5.1.3 Global Aluminum Alloy Powder for 3D Pringting Sales Value by Region (2027–2032)
5.1.4 Global Aluminum Alloy Powder for 3D Pringting Sales Value by Region (%), 2021–2032
5.2 Global Aluminum Alloy Powder for 3D Pringting Sales Volume by Region
5.2.1 Global Aluminum Alloy Powder for 3D Pringting Sales Volume by Region: 2021 vs 2025 vs 2032
5.2.2 Global Aluminum Alloy Powder for 3D Pringting Sales Volume by Region (2021–2026)
5.2.3 Global Aluminum Alloy Powder for 3D Pringting Sales Volume by Region (2027–2032)
5.2.4 Global Aluminum Alloy Powder for 3D Pringting Sales Volume by Region (%), 2021–2032
5.3 Global Aluminum Alloy Powder for 3D Pringting Average Price by Region (2021–2032)
5.4 North America
5.4.1 North America Aluminum Alloy Powder for 3D Pringting Sales Value, 2021–2032
5.4.2 North America Aluminum Alloy Powder for 3D Pringting Sales Value by Country (%), 2025 vs 2032
5.5 Europe
5.5.1 Europe Aluminum Alloy Powder for 3D Pringting Sales Value, 2021–2032
5.5.2 Europe Aluminum Alloy Powder for 3D Pringting Sales Value by Country (%), 2025 vs 2032
5.6 Asia Pacific
5.6.1 Asia Pacific Aluminum Alloy Powder for 3D Pringting Sales Value, 2021–2032
5.6.2 Asia Pacific Aluminum Alloy Powder for 3D Pringting Sales Value by Region (%), 2025 vs 2032
5.7 South America
5.7.1 South America Aluminum Alloy Powder for 3D Pringting Sales Value, 2021–2032
5.7.2 South America Aluminum Alloy Powder for 3D Pringting Sales Value by Country (%), 2025 vs 2032
5.8 Middle East & Africa
5.8.1 Middle East & Africa Aluminum Alloy Powder for 3D Pringting Sales Value, 2021–2032
5.8.2 Middle East & Africa Aluminum Alloy Powder for 3D Pringting Sales Value by Country (%), 2025 vs 2032
6 Segmentation by Key Countries/Regions
6.1 Key Countries/Regions Aluminum Alloy Powder for 3D Pringting Sales Value Growth Trends, 2021 vs 2025 vs 2032
6.2 Key Countries/Regions Aluminum Alloy Powder for 3D Pringting Sales Value and Sales Volume
6.2.1 Key Countries/Regions Aluminum Alloy Powder for 3D Pringting Sales Value, 2021–2032
6.2.2 Key Countries/Regions Aluminum Alloy Powder for 3D Pringting Sales Volume, 2021–2032
6.3 United States
6.3.1 United States Aluminum Alloy Powder for 3D Pringting Sales Value, 2021–2032
6.3.2 United States Aluminum Alloy Powder for 3D Pringting Sales Value by Type (%), 2025 vs 2032
6.3.3 United States Aluminum Alloy Powder for 3D Pringting Sales Value by Application, 2025 vs 2032
6.4 Europe
6.4.1 Europe Aluminum Alloy Powder for 3D Pringting Sales Value, 2021–2032
6.4.2 Europe Aluminum Alloy Powder for 3D Pringting Sales Value by Type (%), 2025 vs 2032
6.4.3 Europe Aluminum Alloy Powder for 3D Pringting Sales Value by Application, 2025 vs 2032
6.5 China
6.5.1 China Aluminum Alloy Powder for 3D Pringting Sales Value, 2021–2032
6.5.2 China Aluminum Alloy Powder for 3D Pringting Sales Value by Type (%), 2025 vs 2032
6.5.3 China Aluminum Alloy Powder for 3D Pringting Sales Value by Application, 2025 vs 2032
6.6 Japan
6.6.1 Japan Aluminum Alloy Powder for 3D Pringting Sales Value, 2021–2032
6.6.2 Japan Aluminum Alloy Powder for 3D Pringting Sales Value by Type (%), 2025 vs 2032
6.6.3 Japan Aluminum Alloy Powder for 3D Pringting Sales Value by Application, 2025 vs 2032
6.7 South Korea
6.7.1 South Korea Aluminum Alloy Powder for 3D Pringting Sales Value, 2021–2032
6.7.2 South Korea Aluminum Alloy Powder for 3D Pringting Sales Value by Type (%), 2025 vs 2032
6.7.3 South Korea Aluminum Alloy Powder for 3D Pringting Sales Value by Application, 2025 vs 2032
6.8 Southeast Asia
6.8.1 Southeast Asia Aluminum Alloy Powder for 3D Pringting Sales Value, 2021–2032
6.8.2 Southeast Asia Aluminum Alloy Powder for 3D Pringting Sales Value by Type (%), 2025 vs 2032
6.8.3 Southeast Asia Aluminum Alloy Powder for 3D Pringting Sales Value by Application, 2025 vs 2032
6.9 India
6.9.1 India Aluminum Alloy Powder for 3D Pringting Sales Value, 2021–2032
6.9.2 India Aluminum Alloy Powder for 3D Pringting Sales Value by Type (%), 2025 vs 2032
6.9.3 India Aluminum Alloy Powder for 3D Pringting Sales Value by Application, 2025 vs 2032
7 Company Profiles
7.1 EOS GmbH
7.1.1 EOS GmbH Company Information
7.1.2 EOS GmbH Introduction and Business Overview
7.1.3 EOS GmbH Aluminum Alloy Powder for 3D Pringting Sales, Revenue, Price and Gross Margin (2021–2026)
7.1.4 EOS GmbH Aluminum Alloy Powder for 3D Pringting Product Offerings
7.1.5 EOS GmbH Recent Developments
7.2 Valimet
7.2.1 Valimet Company Information
7.2.2 Valimet Introduction and Business Overview
7.2.3 Valimet Aluminum Alloy Powder for 3D Pringting Sales, Revenue, Price and Gross Margin (2021–2026)
7.2.4 Valimet Aluminum Alloy Powder for 3D Pringting Product Offerings
7.2.5 Valimet Recent Developments
7.3 CNPC POWDER
7.3.1 CNPC POWDER Company Information
7.3.2 CNPC POWDER Introduction and Business Overview
7.3.3 CNPC POWDER Aluminum Alloy Powder for 3D Pringting Sales, Revenue, Price and Gross Margin (2021–2026)
7.3.4 CNPC POWDER Aluminum Alloy Powder for 3D Pringting Product Offerings
7.3.5 CNPC POWDER Recent Developments
7.4 Eckart
7.4.1 Eckart Company Information
7.4.2 Eckart Introduction and Business Overview
7.4.3 Eckart Aluminum Alloy Powder for 3D Pringting Sales, Revenue, Price and Gross Margin (2021–2026)
7.4.4 Eckart Aluminum Alloy Powder for 3D Pringting Product Offerings
7.4.5 Eckart Recent Developments
7.5 Equispheres
7.5.1 Equispheres Company Information
7.5.2 Equispheres Introduction and Business Overview
7.5.3 Equispheres Aluminum Alloy Powder for 3D Pringting Sales, Revenue, Price and Gross Margin (2021–2026)
7.5.4 Equispheres Aluminum Alloy Powder for 3D Pringting Product Offerings
7.5.5 Equispheres Recent Developments
7.6 Heraeus
7.6.1 Heraeus Company Information
7.6.2 Heraeus Introduction and Business Overview
7.6.3 Heraeus Aluminum Alloy Powder for 3D Pringting Sales, Revenue, Price and Gross Margin (2021–2026)
7.6.4 Heraeus Aluminum Alloy Powder for 3D Pringting Product Offerings
7.6.5 Heraeus Recent Developments
7.7 3D Systems
7.7.1 3D Systems Company Information
7.7.2 3D Systems Introduction and Business Overview
7.7.3 3D Systems Aluminum Alloy Powder for 3D Pringting Sales, Revenue, Price and Gross Margin (2021–2026)
7.7.4 3D Systems Aluminum Alloy Powder for 3D Pringting Product Offerings
7.7.5 3D Systems Recent Developments
7.8 Renishaw
7.8.1 Renishaw Company Information
7.8.2 Renishaw Introduction and Business Overview
7.8.3 Renishaw Aluminum Alloy Powder for 3D Pringting Sales, Revenue, Price and Gross Margin (2021–2026)
7.8.4 Renishaw Aluminum Alloy Powder for 3D Pringting Product Offerings
7.8.5 Renishaw Recent Developments
7.9 Gränges Powder Metallurgy
7.9.1 Gränges Powder Metallurgy Company Information
7.9.2 Gränges Powder Metallurgy Introduction and Business Overview
7.9.3 Gränges Powder Metallurgy Aluminum Alloy Powder for 3D Pringting Sales, Revenue, Price and Gross Margin (2021–2026)
7.9.4 Gränges Powder Metallurgy Aluminum Alloy Powder for 3D Pringting Product Offerings
7.9.5 Gränges Powder Metallurgy Recent Developments
7.10 Elementum 3D
7.10.1 Elementum 3D Company Information
7.10.2 Elementum 3D Introduction and Business Overview
7.10.3 Elementum 3D Aluminum Alloy Powder for 3D Pringting Sales, Revenue, Price and Gross Margin (2021–2026)
7.10.4 Elementum 3D Aluminum Alloy Powder for 3D Pringting Product Offerings
7.10.5 Elementum 3D Recent Developments
7.11 NanoAL
7.11.1 NanoAL Company Information
7.11.2 NanoAL Introduction and Business Overview
7.11.3 NanoAL Aluminum Alloy Powder for 3D Pringting Sales, Revenue, Price and Gross Margin (2021–2026)
7.11.4 NanoAL Aluminum Alloy Powder for 3D Pringting Product Offerings
7.11.5 NanoAL Recent Developments
7.12 Eplus3D
7.12.1 Eplus3D Company Information
7.12.2 Eplus3D Introduction and Business Overview
7.12.3 Eplus3D Aluminum Alloy Powder for 3D Pringting Sales, Revenue, Price and Gross Margin (2021–2026)
7.12.4 Eplus3D Aluminum Alloy Powder for 3D Pringting Product Offerings
7.12.5 Eplus3D Recent Developments
7.13 Oerlikon
7.13.1 Oerlikon Company Information
7.13.2 Oerlikon Introduction and Business Overview
7.13.3 Oerlikon Aluminum Alloy Powder for 3D Pringting Sales, Revenue, Price and Gross Margin (2021–2026)
7.13.4 Oerlikon Aluminum Alloy Powder for 3D Pringting Product Offerings
7.13.5 Oerlikon Recent Developments
7.14 Höganäs
7.14.1 Höganäs Company Information
7.14.2 Höganäs Introduction and Business Overview
7.14.3 Höganäs Aluminum Alloy Powder for 3D Pringting Sales, Revenue, Price and Gross Margin (2021–2026)
7.14.4 Höganäs Aluminum Alloy Powder for 3D Pringting Product Offerings
7.14.5 Höganäs Recent Developments
7.15 Kymera International
7.15.1 Kymera International Company Information
7.15.2 Kymera International Introduction and Business Overview
7.15.3 Kymera International Aluminum Alloy Powder for 3D Pringting Sales, Revenue, Price and Gross Margin (2021–2026)
7.15.4 Kymera International Aluminum Alloy Powder for 3D Pringting Product Offerings
7.15.5 Kymera International Recent Developments
7.16 Toyal Group
7.16.1 Toyal Group Company Information
7.16.2 Toyal Group Introduction and Business Overview
7.16.3 Toyal Group Aluminum Alloy Powder for 3D Pringting Sales, Revenue, Price and Gross Margin (2021–2026)
7.16.4 Toyal Group Aluminum Alloy Powder for 3D Pringting Product Offerings
7.16.5 Toyal Group Recent Developments
7.17 Carpenter Additive
7.17.1 Carpenter Additive Company Information
7.17.2 Carpenter Additive Introduction and Business Overview
7.17.3 Carpenter Additive Aluminum Alloy Powder for 3D Pringting Sales, Revenue, Price and Gross Margin (2021–2026)
7.17.4 Carpenter Additive Aluminum Alloy Powder for 3D Pringting Product Offerings
7.17.5 Carpenter Additive Recent Developments
7.18 Circle Metal Powder
7.18.1 Circle Metal Powder Company Information
7.18.2 Circle Metal Powder Introduction and Business Overview
7.18.3 Circle Metal Powder Aluminum Alloy Powder for 3D Pringting Sales, Revenue, Price and Gross Margin (2021–2026)
7.18.4 Circle Metal Powder Aluminum Alloy Powder for 3D Pringting Product Offerings
7.18.5 Circle Metal Powder Recent Developments
7.19 AP&C
7.19.1 AP&C Company Information
7.19.2 AP&C Introduction and Business Overview
7.19.3 AP&C Aluminum Alloy Powder for 3D Pringting Sales, Revenue, Price and Gross Margin (2021–2026)
7.19.4 AP&C Aluminum Alloy Powder for 3D Pringting Product Offerings
7.19.5 AP&C Recent Developments
7.20 ECKA Granules
7.20.1 ECKA Granules Company Information
7.20.2 ECKA Granules Introduction and Business Overview
7.20.3 ECKA Granules Aluminum Alloy Powder for 3D Pringting Sales, Revenue, Price and Gross Margin (2021–2026)
7.20.4 ECKA Granules Aluminum Alloy Powder for 3D Pringting Product Offerings
7.20.5 ECKA Granules Recent Developments
7.21 Truer Technology
7.21.1 Truer Technology Company Information
7.21.2 Truer Technology Introduction and Business Overview
7.21.3 Truer Technology Aluminum Alloy Powder for 3D Pringting Sales, Revenue, Price and Gross Margin (2021–2026)
7.21.4 Truer Technology Aluminum Alloy Powder for 3D Pringting Product Offerings
7.21.5 Truer Technology Recent Developments
7.22 Met3DP
7.22.1 Met3DP Company Information
7.22.2 Met3DP Introduction and Business Overview
7.22.3 Met3DP Aluminum Alloy Powder for 3D Pringting Sales, Revenue, Price and Gross Margin (2021–2026)
7.22.4 Met3DP Aluminum Alloy Powder for 3D Pringting Product Offerings
7.22.5 Met3DP Recent Developments
7.23 Sandvik
7.23.1 Sandvik Company Information
7.23.2 Sandvik Introduction and Business Overview
7.23.3 Sandvik Aluminum Alloy Powder for 3D Pringting Sales, Revenue, Price and Gross Margin (2021–2026)
7.23.4 Sandvik Aluminum Alloy Powder for 3D Pringting Product Offerings
7.23.5 Sandvik Recent Developments
7.24 China Baoan Group
7.24.1 China Baoan Group Company Information
7.24.2 China Baoan Group Introduction and Business Overview
7.24.3 China Baoan Group Aluminum Alloy Powder for 3D Pringting Sales, Revenue, Price and Gross Margin (2021–2026)
7.24.4 China Baoan Group Aluminum Alloy Powder for 3D Pringting Product Offerings
7.24.5 China Baoan Group Recent Developments
7.25 AECC BIAM
7.25.1 AECC BIAM Company Information
7.25.2 AECC BIAM Introduction and Business Overview
7.25.3 AECC BIAM Aluminum Alloy Powder for 3D Pringting Sales, Revenue, Price and Gross Margin (2021–2026)
7.25.4 AECC BIAM Aluminum Alloy Powder for 3D Pringting Product Offerings
7.25.5 AECC BIAM Recent Developments
7.26 Hunan Jinhao New Material Technology
7.26.1 Hunan Jinhao New Material Technology Company Information
7.26.2 Hunan Jinhao New Material Technology Introduction and Business Overview
7.26.3 Hunan Jinhao New Material Technology Aluminum Alloy Powder for 3D Pringting Sales, Revenue, Price and Gross Margin (2021–2026)
7.26.4 Hunan Jinhao New Material Technology Aluminum Alloy Powder for 3D Pringting Product Offerings
7.26.5 Hunan Jinhao New Material Technology Recent Developments
7.27 GRIPM
7.27.1 GRIPM Company Information
7.27.2 GRIPM Introduction and Business Overview
7.27.3 GRIPM Aluminum Alloy Powder for 3D Pringting Sales, Revenue, Price and Gross Margin (2021–2026)
7.27.4 GRIPM Aluminum Alloy Powder for 3D Pringting Product Offerings
7.27.5 GRIPM Recent Developments
7.28 Avimetal AM Tech
7.28.1 Avimetal AM Tech Company Information
7.28.2 Avimetal AM Tech Introduction and Business Overview
7.28.3 Avimetal AM Tech Aluminum Alloy Powder for 3D Pringting Sales, Revenue, Price and Gross Margin (2021–2026)
7.28.4 Avimetal AM Tech Aluminum Alloy Powder for 3D Pringting Product Offerings
7.28.5 Avimetal AM Tech Recent Developments
8 Industry Chain Analysis
8.1 Aluminum Alloy Powder for 3D Pringting Industrial Chain
8.2 Aluminum Alloy Powder for 3D Pringting Upstream Analysis
8.2.1 Key Raw Materials
8.2.2 Key Suppliers of Raw Materials
8.2.3 Manufacturing Cost Structure
8.3 Midstream Analysis
8.4 Downstream Analysis (Customer Analysis)
8.5 Sales Model and Sales Channelss
8.5.1 Aluminum Alloy Powder for 3D Pringting Sales Model
8.5.2 Sales Channels
8.5.3 Aluminum Alloy Powder for 3D Pringting Distributors
9 Research Findings and Conclusion
10 Appendix
10.1 Research Methodology
10.1.1 Methodology/Research Approach
10.1.1.1 Research Programs/Design
10.1.1.2 Market Size Estimation
10.1.1.3 Market Breakdown and Data Triangulation
10.1.2 Data Source
10.1.2.1 Secondary Sources
10.1.2.2 Primary Sources
10.2 Author Details
10.3 Disclaimer