List of Tables
Table 1. Global Sport Fishing Equipment Market Size Growth Rate by Type (US$ Million): 2021 vs 2025 vs 2032
Table 2. Key Players of Rods, Reels and Components
Table 3. Key Players of Line, Leaders
Table 4. Key Players of Lures, Files, Baits
Table 5. Key Players of Terminal Tackle
Table 6. Key Players of Electronics
Table 7. Key Players of Others
Table 8. Global Sport Fishing Equipment Market Size Growth by Application (US$ Million): 2021 vs 2025 vs 2032
Table 9. Global Sport Fishing Equipment Market Size by Region (US$ Million): 2021 vs 2025 vs 2032
Table 10. Global Sport Fishing Equipment Market Size by Region (US$ Million), 2021–2026
Table 11. Global Sport Fishing Equipment Market Share by Region (2021–2026)
Table 12. Global Sport Fishing Equipment Forecasted Market Size by Region (US$ Million), 2027–2032
Table 13. Global Sport Fishing Equipment Market Share by Region (2027–2032)
Table 14. Sport Fishing Equipment Market Trends
Table 15. Sport Fishing Equipment Market Drivers
Table 16. Sport Fishing Equipment Market Challenges
Table 17. Sport Fishing Equipment Market Restraints
Table 18. Global Sport Fishing Equipment Revenue by Players (US$ Million), 2021–2026
Table 19. Global Sport Fishing Equipment Market Share by Players (2021–2026)
Table 20. Global Top Sport Fishing Equipment Players by Tier (Tier 1, Tier 2, and Tier 3), based on Sport Fishing Equipment Revenue, 2025
Table 21. Ranking of Global Top Sport Fishing Equipment Companies by Revenue (US$ Million) in 2025
Table 22. Global 5 Largest Players Market Share by Sport Fishing Equipment Revenue (CR5 and HHI), 2021–2026
Table 23. Global Key Players of Sport Fishing Equipment, Headquarters and Area Served
Table 24. Global Key Players of Sport Fishing Equipment, Products and Applications
Table 25. Global Key Players of Sport Fishing Equipment, Date of General Availability (GA)
Table 26. Mergers and Acquisitions, Expansion Plans
Table 27. Global Sport Fishing Equipment Market Size by Type (US$ Million), 2021–2026
Table 28. Global Sport Fishing Equipment Revenue Market Share by Type (2021–2026)
Table 29. Global Sport Fishing Equipment Forecasted Market Size by Type (US$ Million), 2027–2032
Table 30. Global Sport Fishing Equipment Revenue Market Share by Type (2027–2032)
Table 31. Global Sport Fishing Equipment Market Size by Application (US$ Million), 2021–2026
Table 32. Global Sport Fishing Equipment Revenue Market Share by Application (2021–2026)
Table 33. Global Sport Fishing Equipment Forecasted Market Size by Application (US$ Million), 2027–2032
Table 34. Global Sport Fishing Equipment Revenue Market Share by Application (2027–2032)
Table 35. North America Sport Fishing Equipment Market Size Growth Rate by Country (US$ Million): 2021 vs 2025 vs 2032
Table 36. North America Sport Fishing Equipment Market Size by Country (US$ Million), 2021–2026
Table 37. North America Sport Fishing Equipment Market Size by Country (US$ Million), 2027–2032
Table 38. Europe Sport Fishing Equipment Market Size Growth Rate by Country (US$ Million): 2021 vs 2025 vs 2032
Table 39. Europe Sport Fishing Equipment Market Size by Country (US$ Million), 2021–2026
Table 40. Europe Sport Fishing Equipment Market Size by Country (US$ Million), 2027–2032
Table 41. Asia-Pacific Sport Fishing Equipment Market Size Growth Rate by Region (US$ Million): 2021 vs 2025 vs 2032
Table 42. Asia-Pacific Sport Fishing Equipment Market Size by Region (US$ Million), 2021–2026
Table 43. Asia-Pacific Sport Fishing Equipment Market Size by Region (US$ Million), 2027–2032
Table 44. Latin America Sport Fishing Equipment Market Size Growth Rate by Country (US$ Million): 2021 vs 2025 vs 2032
Table 45. Latin America Sport Fishing Equipment Market Size by Country (US$ Million), 2021–2026
Table 46. Latin America Sport Fishing Equipment Market Size by Country (US$ Million), 2027–2032
Table 47. Middle East & Africa Sport Fishing Equipment Market Size Growth Rate by Country (US$ Million): 2021 vs 2025 vs 2032
Table 48. Middle East & Africa Sport Fishing Equipment Market Size by Country (US$ Million), 2021–2026
Table 49. Middle East & Africa Sport Fishing Equipment Market Size by Country (US$ Million), 2027–2032
Table 50. Globeride(Daiwa) Company Details
Table 51. Globeride(Daiwa) Business Overview
Table 52. Globeride(Daiwa) Sport Fishing Equipment Product
Table 53. Globeride(Daiwa) Revenue in Sport Fishing Equipment Business (US$ Million), 2021–2026
Table 54. Globeride(Daiwa) Recent Development
Table 55. Shimano Company Details
Table 56. Shimano Business Overview
Table 57. Shimano Sport Fishing Equipment Product
Table 58. Shimano Revenue in Sport Fishing Equipment Business (US$ Million), 2021–2026
Table 59. Shimano Recent Development
Table 60. Pure Fishing Company Details
Table 61. Pure Fishing Business Overview
Table 62. Pure Fishing Sport Fishing Equipment Product
Table 63. Pure Fishing Revenue in Sport Fishing Equipment Business (US$ Million), 2021–2026
Table 64. Pure Fishing Recent Development
Table 65. Rapala VMC Corporation Company Details
Table 66. Rapala VMC Corporation Business Overview
Table 67. Rapala VMC Corporation Sport Fishing Equipment Product
Table 68. Rapala VMC Corporation Revenue in Sport Fishing Equipment Business (US$ Million), 2021–2026
Table 69. Rapala VMC Corporation Recent Development
Table 70. Johshuya Co. Company Details
Table 71. Johshuya Co. Business Overview
Table 72. Johshuya Co. Sport Fishing Equipment Product
Table 73. Johshuya Co. Revenue in Sport Fishing Equipment Business (US$ Million), 2021–2026
Table 74. Johshuya Co. Recent Development
Table 75. Cabela's Inc. Company Details
Table 76. Cabela's Inc. Business Overview
Table 77. Cabela's Inc. Sport Fishing Equipment Product
Table 78. Cabela's Inc. Revenue in Sport Fishing Equipment Business (US$ Million), 2021–2026
Table 79. Cabela's Inc. Recent Development
Table 80. Weihai Guangwei Group Company Details
Table 81. Weihai Guangwei Group Business Overview
Table 82. Weihai Guangwei Group Sport Fishing Equipment Product
Table 83. Weihai Guangwei Group Revenue in Sport Fishing Equipment Business (US$ Million), 2021–2026
Table 84. Weihai Guangwei Group Recent Development
Table 85. Pokee Fishing Company Details
Table 86. Pokee Fishing Business Overview
Table 87. Pokee Fishing Sport Fishing Equipment Product
Table 88. Pokee Fishing Revenue in Sport Fishing Equipment Business (US$ Million), 2021–2026
Table 89. Pokee Fishing Recent Development
Table 90. Humminbird Company Details
Table 91. Humminbird Business Overview
Table 92. Humminbird Sport Fishing Equipment Product
Table 93. Humminbird Revenue in Sport Fishing Equipment Business (US$ Million), 2021–2026
Table 94. Humminbird Recent Development
Table 95. Shandong Weihai Huanqiu Fishing Tackle Company Details
Table 96. Shandong Weihai Huanqiu Fishing Tackle Business Overview
Table 97. Shandong Weihai Huanqiu Fishing Tackle Sport Fishing Equipment Product
Table 98. Shandong Weihai Huanqiu Fishing Tackle Revenue in Sport Fishing Equipment Business (US$ Million), 2021–2026
Table 99. Shandong Weihai Huanqiu Fishing Tackle Recent Development
Table 100. Dongmi Fishing Company Details
Table 101. Dongmi Fishing Business Overview
Table 102. Dongmi Fishing Sport Fishing Equipment Product
Table 103. Dongmi Fishing Revenue in Sport Fishing Equipment Business (US$ Million), 2021–2026
Table 104. Dongmi Fishing Recent Development
Table 105. Eagle Claw Company Details
Table 106. Eagle Claw Business Overview
Table 107. Eagle Claw Sport Fishing Equipment Product
Table 108. Eagle Claw Revenue in Sport Fishing Equipment Business (US$ Million), 2021–2026
Table 109. Eagle Claw Recent Development
Table 110. St. Croix Rods Company Details
Table 111. St. Croix Rods Business Overview
Table 112. St. Croix Rods Sport Fishing Equipment Product
Table 113. St. Croix Rods Revenue in Sport Fishing Equipment Business (US$ Million), 2021–2026
Table 114. St. Croix Rods Recent Development
Table 115. DUEL(YO-ZURI) Company Details
Table 116. DUEL(YO-ZURI) Business Overview
Table 117. DUEL(YO-ZURI) Sport Fishing Equipment Product
Table 118. DUEL(YO-ZURI) Revenue in Sport Fishing Equipment Business (US$ Million), 2021–2026
Table 119. DUEL(YO-ZURI) Recent Development
Table 120. Tica Fishing Company Details
Table 121. Tica Fishing Business Overview
Table 122. Tica Fishing Sport Fishing Equipment Product
Table 123. Tica Fishing Revenue in Sport Fishing Equipment Business (US$ Million), 2021–2026
Table 124. Tica Fishing Recent Development
Table 125. Ningbo ZhongYuan Alljoy Fishing Tackle Co., Ltd Company Details
Table 126. Ningbo ZhongYuan Alljoy Fishing Tackle Co., Ltd Business Overview
Table 127. Ningbo ZhongYuan Alljoy Fishing Tackle Co., Ltd Sport Fishing Equipment Product
Table 128. Ningbo ZhongYuan Alljoy Fishing Tackle Co., Ltd Revenue in Sport Fishing Equipment Business (US$ Million), 2021–2026
Table 129. Ningbo ZhongYuan Alljoy Fishing Tackle Co., Ltd Recent Development
Table 130. Gamakatsu Company Details
Table 131. Gamakatsu Business Overview
Table 132. Gamakatsu Sport Fishing Equipment Product
Table 133. Gamakatsu Revenue in Sport Fishing Equipment Business (US$ Million), 2021–2026
Table 134. Gamakatsu Recent Development
Table 135. Preston Innovations Company Details
Table 136. Preston Innovations Business Overview
Table 137. Preston Innovations Sport Fishing Equipment Product
Table 138. Preston Innovations Revenue in Sport Fishing Equipment Business (US$ Million), 2021–2026
Table 139. Preston Innovations Recent Development
Table 140. AFTCO Mfg. Company Details
Table 141. AFTCO Mfg. Business Overview
Table 142. AFTCO Mfg. Sport Fishing Equipment Product
Table 143. AFTCO Mfg. Revenue in Sport Fishing Equipment Business (US$ Million), 2021–2026
Table 144. AFTCO Mfg. Recent Development
Table 145. Haibo Company Details
Table 146. Haibo Business Overview
Table 147. Haibo Sport Fishing Equipment Product
Table 148. Haibo Revenue in Sport Fishing Equipment Business (US$ Million), 2021–2026
Table 149. Haibo Recent Development
Table 150. O. Mustad & Son Company Details
Table 151. O. Mustad & Son Business Overview
Table 152. O. Mustad & Son Sport Fishing Equipment Product
Table 153. O. Mustad & Son Revenue in Sport Fishing Equipment Business (US$ Million), 2021–2026
Table 154. O. Mustad & Son Recent Development
Table 155. Okuma Fishing Company Details
Table 156. Okuma Fishing Business Overview
Table 157. Okuma Fishing Sport Fishing Equipment Product
Table 158. Okuma Fishing Revenue in Sport Fishing Equipment Business (US$ Million), 2021–2026
Table 159. Okuma Fishing Recent Development
Table 160. Barfilon Fishing Company Details
Table 161. Barfilon Fishing Business Overview
Table 162. Barfilon Fishing Sport Fishing Equipment Product
Table 163. Barfilon Fishing Revenue in Sport Fishing Equipment Business (US$ Million), 2021–2026
Table 164. Barfilon Fishing Recent Development
Table 165. Tiemco Company Details
Table 166. Tiemco Business Overview
Table 167. Tiemco Sport Fishing Equipment Product
Table 168. Tiemco Revenue in Sport Fishing Equipment Business (US$ Million), 2021–2026
Table 169. Tiemco Recent Development
Table 170. Shandong Huashi Company Details
Table 171. Shandong Huashi Business Overview
Table 172. Shandong Huashi Sport Fishing Equipment Product
Table 173. Shandong Huashi Revenue in Sport Fishing Equipment Business (US$ Million), 2021–2026
Table 174. Shandong Huashi Recent Development
Table 175. Wuhan Tianyuan Qianchuan Company Details
Table 176. Wuhan Tianyuan Qianchuan Business Overview
Table 177. Wuhan Tianyuan Qianchuan Sport Fishing Equipment Product
Table 178. Wuhan Tianyuan Qianchuan Revenue in Sport Fishing Equipment Business (US$ Million), 2021–2026
Table 179. Wuhan Tianyuan Qianchuan Recent Development
Table 180. PoYang Black Kingkong (BKK) Company Details
Table 181. PoYang Black Kingkong (BKK) Business Overview
Table 182. PoYang Black Kingkong (BKK) Sport Fishing Equipment Product
Table 183. PoYang Black Kingkong (BKK) Revenue in Sport Fishing Equipment Business (US$ Million), 2021–2026
Table 184. PoYang Black Kingkong (BKK) Recent Development
Table 185. Jiadiaoni Company Details
Table 186. Jiadiaoni Business Overview
Table 187. Jiadiaoni Sport Fishing Equipment Product
Table 188. Jiadiaoni Revenue in Sport Fishing Equipment Business (US$ Million), 2021–2026
Table 189. Jiadiaoni Recent Development
Table 190. Research Programs/Design for This Report
Table 191. Key Data Information from Secondary Sources
Table 192. Key Data Information from Primary Sources
Table 193. Authors List of This Report
List of Figures
Figure 1. Sport Fishing Equipment Picture
Figure 2. Global Sport Fishing Equipment Market Size Comparison by Type (US$ Million), 2021–2032
Figure 3. Global Sport Fishing Equipment Market Share by Type: 2025 vs 2032
Figure 4. Rods, Reels and Components Features
Figure 5. Line, Leaders Features
Figure 6. Lures, Files, Baits Features
Figure 7. Terminal Tackle Features
Figure 8. Electronics Features
Figure 9. Others Features
Figure 10. Global Sport Fishing Equipment Market Size by Application (US$ Million), 2021–2032
Figure 11. Global Sport Fishing Equipment Market Share by Application: 2025 vs 2032
Figure 12. Freshwater Fishing Case Studies
Figure 13. Saltwater Fishing Case Studies
Figure 14. Sport Fishing Equipment Report Years Considered
Figure 15. Global Sport Fishing Equipment Market Size (US$ Million), Year-over-Year: 2021–2032
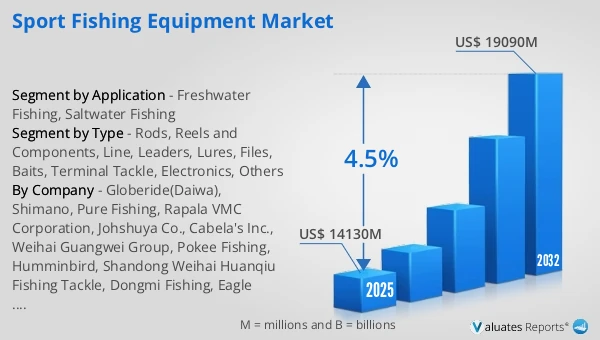
Figure 16. Global Sport Fishing Equipment Market Size, (US$ Million), 2021 vs 2025 vs 2032
Figure 17. Global Sport Fishing Equipment Market Share by Region: 2025 vs 2032
Figure 18. Global Sport Fishing Equipment Market Share by Players in 2025
Figure 19. Global Sport Fishing Equipment Market Share by Company Type (Tier 1, Tier 2, and Tier 3)
Figure 20. The Top 10 and 5 Players Market Share by Sport Fishing Equipment Revenue in 2025
Figure 21. North America Sport Fishing Equipment Market Size YoY Growth (US$ Million), 2021–2032
Figure 22. North America Sport Fishing Equipment Market Share by Country (2021–2032)
Figure 23. United States Sport Fishing Equipment Market Size YoY Growth (US$ Million), 2021–2032
Figure 24. Canada Sport Fishing Equipment Market Size YoY Growth (US$ Million), 2021–2032
Figure 25. Europe Sport Fishing Equipment Market Size YoY Growth (US$ Million), 2021–2032
Figure 26. Europe Sport Fishing Equipment Market Share by Country (2021–2032)
Figure 27. Germany Sport Fishing Equipment Market Size YoY Growth (US$ Million), 2021–2032
Figure 28. France Sport Fishing Equipment Market Size YoY Growth (US$ Million), 2021–2032
Figure 29. U.K. Sport Fishing Equipment Market Size YoY Growth (US$ Million), 2021–2032
Figure 30. Italy Sport Fishing Equipment Market Size YoY Growth (US$ Million), 2021–2032
Figure 31. Russia Sport Fishing Equipment Market Size YoY Growth (US$ Million), 2021–2032
Figure 32. Ireland Sport Fishing Equipment Market Size YoY Growth (US$ Million), 2021–2032
Figure 33. Asia-Pacific Sport Fishing Equipment Market Size YoY Growth (US$ Million), 2021–2032
Figure 34. Asia-Pacific Sport Fishing Equipment Market Share by Region (2021–2032)
Figure 35. China Sport Fishing Equipment Market Size YoY Growth (US$ Million), 2021–2032
Figure 36. Japan Sport Fishing Equipment Market Size YoY Growth (US$ Million), 2021–2032
Figure 37. South Korea Sport Fishing Equipment Market Size YoY Growth (US$ Million), 2021–2032
Figure 38. Southeast Asia Sport Fishing Equipment Market Size YoY Growth (US$ Million), 2021–2032
Figure 39. India Sport Fishing Equipment Market Size YoY Growth (US$ Million), 2021–2032
Figure 40. Australia & New Zealand Sport Fishing Equipment Market Size YoY Growth (US$ Million), 2021–2032
Figure 41. Latin America Sport Fishing Equipment Market Size YoY Growth (US$ Million), 2021–2032
Figure 42. Latin America Sport Fishing Equipment Market Share by Country (2021–2032)
Figure 43. Mexico Sport Fishing Equipment Market Size YoY Growth (US$ Million), 2021–2032
Figure 44. Brazil Sport Fishing Equipment Market Size YoY Growth (US$ Million), 2021–2032
Figure 45. Middle East & Africa Sport Fishing Equipment Market Size YoY Growth (US$ Million), 2021–2032
Figure 46. Middle East & Africa Sport Fishing Equipment Market Share by Country (2021–2032)
Figure 47. Israel Sport Fishing Equipment Market Size YoY Growth (US$ Million), 2021–2032
Figure 48. Saudi Arabia Sport Fishing Equipment Market Size YoY Growth (US$ Million), 2021–2032
Figure 49. UAE Sport Fishing Equipment Market Size YoY Growth (US$ Million), 2021–2032
Figure 50. Globeride(Daiwa) Revenue Growth Rate in Sport Fishing Equipment Business (2021–2026)
Figure 51. Shimano Revenue Growth Rate in Sport Fishing Equipment Business (2021–2026)
Figure 52. Pure Fishing Revenue Growth Rate in Sport Fishing Equipment Business (2021–2026)
Figure 53. Rapala VMC Corporation Revenue Growth Rate in Sport Fishing Equipment Business (2021–2026)
Figure 54. Johshuya Co. Revenue Growth Rate in Sport Fishing Equipment Business (2021–2026)
Figure 55. Cabela's Inc. Revenue Growth Rate in Sport Fishing Equipment Business (2021–2026)
Figure 56. Weihai Guangwei Group Revenue Growth Rate in Sport Fishing Equipment Business (2021–2026)
Figure 57. Pokee Fishing Revenue Growth Rate in Sport Fishing Equipment Business (2021–2026)
Figure 58. Humminbird Revenue Growth Rate in Sport Fishing Equipment Business (2021–2026)
Figure 59. Shandong Weihai Huanqiu Fishing Tackle Revenue Growth Rate in Sport Fishing Equipment Business (2021–2026)
Figure 60. Dongmi Fishing Revenue Growth Rate in Sport Fishing Equipment Business (2021–2026)
Figure 61. Eagle Claw Revenue Growth Rate in Sport Fishing Equipment Business (2021–2026)
Figure 62. St. Croix Rods Revenue Growth Rate in Sport Fishing Equipment Business (2021–2026)
Figure 63. DUEL(YO-ZURI) Revenue Growth Rate in Sport Fishing Equipment Business (2021–2026)
Figure 64. Tica Fishing Revenue Growth Rate in Sport Fishing Equipment Business (2021–2026)
Figure 65. Ningbo ZhongYuan Alljoy Fishing Tackle Co., Ltd Revenue Growth Rate in Sport Fishing Equipment Business (2021–2026)
Figure 66. Gamakatsu Revenue Growth Rate in Sport Fishing Equipment Business (2021–2026)
Figure 67. Preston Innovations Revenue Growth Rate in Sport Fishing Equipment Business (2021–2026)
Figure 68. AFTCO Mfg. Revenue Growth Rate in Sport Fishing Equipment Business (2021–2026)
Figure 69. Haibo Revenue Growth Rate in Sport Fishing Equipment Business (2021–2026)
Figure 70. O. Mustad & Son Revenue Growth Rate in Sport Fishing Equipment Business (2021–2026)
Figure 71. Okuma Fishing Revenue Growth Rate in Sport Fishing Equipment Business (2021–2026)
Figure 72. Barfilon Fishing Revenue Growth Rate in Sport Fishing Equipment Business (2021–2026)
Figure 73. Tiemco Revenue Growth Rate in Sport Fishing Equipment Business (2021–2026)
Figure 74. Shandong Huashi Revenue Growth Rate in Sport Fishing Equipment Business (2021–2026)
Figure 75. Wuhan Tianyuan Qianchuan Revenue Growth Rate in Sport Fishing Equipment Business (2021–2026)
Figure 76. PoYang Black Kingkong (BKK) Revenue Growth Rate in Sport Fishing Equipment Business (2021–2026)
Figure 77. Jiadiaoni Revenue Growth Rate in Sport Fishing Equipment Business (2021–2026)
Figure 78. Bottom-up and Top-down Approaches for This Report
Figure 79. Data Triangulation
Figure 80. Key Executives Interviewed