List of Tables
Table 1. Global Gold Jewelry Market Value by Type (US$ Million), 2025 vs 2032
Table 2. Global Gold Jewelry Market Value by End Use (US$ Million), 2025 vs 2032
Table 3. Global Gold Jewelry Market Value by Craftsmanship (US$ Million), 2025 vs 2032
Table 4. Global Gold Jewelry Market Value by Sales Channel (US$ Million), 2025 vs 2032
Table 5. Global Gold Jewelry Market Competitive Situation by Manufacturers in 2025
Table 6. Global Gold Jewelry Sales (K Units) of Key Manufacturers (2021–2026)
Table 7. Global Gold Jewelry Sales Market Share by Manufacturers (2021–2026)
Table 8. Global Gold Jewelry Revenue (US$ Million) by Manufacturers (2021–2026)
Table 9. Global Gold Jewelry Revenue Share by Manufacturers (2021–2026)
Table 10. Global Market Gold Jewelry Average Price (USD/Unit) of Key Manufacturers (2021–2026)
Table 11. Global Key Players of Gold Jewelry, Industry Ranking, 2023 vs 2024 vs 2025
Table 12. Global Key Manufacturers of Gold Jewelry, Manufacturing Sites and Headquarters
Table 13. Global Key Manufacturers of Gold Jewelry, Product Types and Applications
Table 14. Global Key Manufacturers of Gold Jewelry, Date of Entry into the Industry
Table 15. Global Manufacturers Market Concentration Ratio (CR5 and HHI)
Table 16. Global Gold Jewelry Companies by Tier (Tier 1, Tier 2, Tier 3), based on Gold Jewelry Revenue, 2025
Table 17. Manufacturers Mergers & Acquisitions, Expansion Plans
Table 18. Global Gold Jewelry Market Size by Region (US$ Million): 2021 vs 2025 vs 2032
Table 19. Global Gold Jewelry Sales by Region (K Units), 2021–2026
Table 20. Global Gold Jewelry Sales Market Share by Region (2021–2026)
Table 21. Global Gold Jewelry Sales by Region (K Units), 2027–2032
Table 22. Global Gold Jewelry Sales Market Share by Region (2027–2032)
Table 23. Global Gold Jewelry Revenue by Region (US$ Million), 2021–2026
Table 24. Global Gold Jewelry Revenue Market Share by Region (2021–2026)
Table 25. Global Gold Jewelry Revenue by Region (US$ Million), 2027–2032
Table 26. Global Gold Jewelry Revenue Market Share by Region (2027–2032)
Table 27. North America Gold Jewelry Revenue by Country: 2021 vs 2025 vs 2032 (US$ Million)
Table 28. North America Gold Jewelry Sales by Country (K Units), 2021–2026
Table 29. North America Gold Jewelry Sales by Country (K Units), 2027–2032
Table 30. North America Gold Jewelry Revenue by Country (US$ Million), 2021–2026
Table 31. North America Gold Jewelry Revenue by Country (US$ Million), 2027–2032
Table 32. Europe Gold Jewelry Revenue by Country: 2021 vs 2025 vs 2032 (US$ Million)
Table 33. Europe Gold Jewelry Sales by Country (K Units), 2021–2026
Table 34. Europe Gold Jewelry Sales by Country (K Units), 2027–2032
Table 35. Europe Gold Jewelry Revenue by Country (US$ Million), 2021–2026
Table 36. Europe Gold Jewelry Revenue by Country (US$ Million), 2027–2032
Table 37. Asia Pacific Gold Jewelry Revenue by Region: 2021 vs 2025 vs 2032 (US$ Million)
Table 38. Asia Pacific Gold Jewelry Sales by Region (K Units), 2021–2026
Table 39. Asia Pacific Gold Jewelry Sales by Region (K Units), 2027–2032
Table 40. Asia Pacific Gold Jewelry Revenue by Region (US$ Million), 2021–2026
Table 41. Asia Pacific Gold Jewelry Revenue by Region (US$ Million), 2027–2032
Table 42. Latin America Gold Jewelry Revenue by Country: 2021 vs 2025 vs 2032 (US$ Million)
Table 43. Latin America Gold Jewelry Sales by Country (K Units), 2021–2026
Table 44. Latin America Gold Jewelry Sales by Country (K Units), 2027–2032
Table 45. Latin America Gold Jewelry Revenue by Country (US$ Million), 2021–2026
Table 46. Latin America Gold Jewelry Revenue by Country (US$ Million), 2027–2032
Table 47. Middle East and Africa Gold Jewelry Revenue by Country: 2021 vs 2025 vs 2032 (US$ Million)
Table 48. Middle East and Africa Gold Jewelry Sales by Country (K Units), 2021–2026
Table 49. Middle East and Africa Gold Jewelry Sales by Country (K Units), 2027–2032
Table 50. Middle East and Africa Gold Jewelry Revenue by Country (US$ Million), 2021–2026
Table 51. Middle East and Africa Gold Jewelry Revenue by Country (US$ Million), 2027–2032
Table 52. Global Gold Jewelry Sales (K Units) by Type (2021–2026)
Table 53. Global Gold Jewelry Sales (K Units) by Type (2027–2032)
Table 54. Global Gold Jewelry Sales Market Share by Type (2021–2026)
Table 55. Global Gold Jewelry Sales Market Share by Type (2027–2032)
Table 56. Global Gold Jewelry Revenue (US$ Million) by Type (2021–2026)
Table 57. Global Gold Jewelry Revenue (US$ Million) by Type (2027–2032)
Table 58. Global Gold Jewelry Revenue Market Share by Type (2021–2026)
Table 59. Global Gold Jewelry Revenue Market Share by Type (2027–2032)
Table 60. Global Gold Jewelry Price (USD/Unit) by Type (2021–2026)
Table 61. Global Gold Jewelry Price (USD/Unit) by Type (2027–2032)
Table 62. Global Gold Jewelry Sales (K Units) by Sales Channel (2021–2026)
Table 63. Global Gold Jewelry Sales (K Units) by Sales Channel (2027–2032)
Table 64. Global Gold Jewelry Sales Market Share by Sales Channel (2021–2026)
Table 65. Global Gold Jewelry Sales Market Share by Sales Channel (2027–2032)
Table 66. Global Gold Jewelry Revenue (US$ Million) by Sales Channel (2021–2026)
Table 67. Global Gold Jewelry Revenue (US$ Million) by Sales Channel (2027–2032)
Table 68. Global Gold Jewelry Revenue Market Share by Sales Channel (2021–2026)
Table 69. Global Gold Jewelry Revenue Market Share by Sales Channel (2027–2032)
Table 70. Global Gold Jewelry Price (USD/Unit) by Sales Channel (2021–2026)
Table 71. Global Gold Jewelry Price (USD/Unit) by Sales Channel (2027–2032)
Table 72. Richline Group Company Information
Table 73. Richline Group Description and Business Overview
Table 74. Richline Group Gold Jewelry Sales (K Units), Revenue (US$ Million), Price (USD/Unit), and Gross Margin (2021–2026)
Table 75. Richline Group Gold Jewelry Product
Table 76. Richline Group Recent Developments/Updates
Table 77. Chow Tai Fook Company Information
Table 78. Chow Tai Fook Description and Business Overview
Table 79. Chow Tai Fook Gold Jewelry Sales (K Units), Revenue (US$ Million), Price (USD/Unit), and Gross Margin (2021–2026)
Table 80. Chow Tai Fook Gold Jewelry Product
Table 81. Chow Tai Fook Recent Developments/Updates
Table 82. Richemont Company Information
Table 83. Richemont Description and Business Overview
Table 84. Richemont Gold Jewelry Sales (K Units), Revenue (US$ Million), Price (USD/Unit), and Gross Margin (2021–2026)
Table 85. Richemont Gold Jewelry Product
Table 86. Richemont Recent Developments/Updates
Table 87. Signet Jewellers Company Information
Table 88. Signet Jewellers Description and Business Overview
Table 89. Signet Jewellers Gold Jewelry Sales (K Units), Revenue (US$ Million), Price (USD/Unit), and Gross Margin (2021–2026)
Table 90. Signet Jewellers Gold Jewelry Product
Table 91. Signet Jewellers Recent Developments/Updates
Table 92. Swatch Group Company Information
Table 93. Swatch Group Description and Business Overview
Table 94. Swatch Group Gold Jewelry Sales (K Units), Revenue (US$ Million), Price (USD/Unit), and Gross Margin (2021–2026)
Table 95. Swatch Group Gold Jewelry Product
Table 96. Swatch Group Recent Developments/Updates
Table 97. Rajesh Exports Company Information
Table 98. Rajesh Exports Description and Business Overview
Table 99. Rajesh Exports Gold Jewelry Sales (K Units), Revenue (US$ Million), Price (USD/Unit), and Gross Margin (2021–2026)
Table 100. Rajesh Exports Gold Jewelry Product
Table 101. Rajesh Exports Recent Developments/Updates
Table 102. Lao Feng Xiang Company Information
Table 103. Lao Feng Xiang Description and Business Overview
Table 104. Lao Feng Xiang Gold Jewelry Sales (K Units), Revenue (US$ Million), Price (USD/Unit), and Gross Margin (2021–2026)
Table 105. Lao Feng Xiang Gold Jewelry Product
Table 106. Lao Feng Xiang Recent Developments/Updates
Table 107. Kering Company Information
Table 108. Kering Description and Business Overview
Table 109. Kering Gold Jewelry Sales (K Units), Revenue (US$ Million), Price (USD/Unit), and Gross Margin (2021–2026)
Table 110. Kering Gold Jewelry Product
Table 111. Kering Recent Developments/Updates
Table 112. Malabar Gold and Diamonds Company Information
Table 113. Malabar Gold and Diamonds Description and Business Overview
Table 114. Malabar Gold and Diamonds Gold Jewelry Sales (K Units), Revenue (US$ Million), Price (USD/Unit), and Gross Margin (2021–2026)
Table 115. Malabar Gold and Diamonds Gold Jewelry Product
Table 116. Malabar Gold and Diamonds Recent Developments/Updates
Table 117. LVMH Company Information
Table 118. LVMH Description and Business Overview
Table 119. LVMH Gold Jewelry Sales (K Units), Revenue (US$ Million), Price (USD/Unit), and Gross Margin (2021–2026)
Table 120. LVMH Gold Jewelry Product
Table 121. LVMH Recent Developments/Updates
Table 122. Swarovski Company Information
Table 123. Swarovski Description and Business Overview
Table 124. Swarovski Gold Jewelry Sales (K Units), Revenue (US$ Million), Price (USD/Unit), and Gross Margin (2021–2026)
Table 125. Swarovski Gold Jewelry Product
Table 126. Swarovski Recent Developments/Updates
Table 127. De Beers Company Information
Table 128. De Beers Description and Business Overview
Table 129. De Beers Gold Jewelry Sales (K Units), Revenue (US$ Million), Price (USD/Unit), and Gross Margin (2021–2026)
Table 130. De Beers Gold Jewelry Product
Table 131. De Beers Recent Developments/Updates
Table 132. Chow Sang Sang Company Information
Table 133. Chow Sang Sang Description and Business Overview
Table 134. Chow Sang Sang Gold Jewelry Sales (K Units), Revenue (US$ Million), Price (USD/Unit), and Gross Margin (2021–2026)
Table 135. Chow Sang Sang Gold Jewelry Product
Table 136. Chow Sang Sang Recent Developments/Updates
Table 137. Luk Fook Company Information
Table 138. Luk Fook Description and Business Overview
Table 139. Luk Fook Gold Jewelry Sales (K Units), Revenue (US$ Million), Price (USD/Unit), and Gross Margin (2021–2026)
Table 140. Luk Fook Gold Jewelry Product
Table 141. Luk Fook Recent Developments/Updates
Table 142. Pandora Company Information
Table 143. Pandora Description and Business Overview
Table 144. Pandora Gold Jewelry Sales (K Units), Revenue (US$ Million), Price (USD/Unit), and Gross Margin (2021–2026)
Table 145. Pandora Gold Jewelry Product
Table 146. Pandora Recent Developments/Updates
Table 147. Titan Company Information
Table 148. Titan Description and Business Overview
Table 149. Titan Gold Jewelry Sales (K Units), Revenue (US$ Million), Price (USD/Unit), and Gross Margin (2021–2026)
Table 150. Titan Gold Jewelry Product
Table 151. Titan Recent Developments/Updates
Table 152. Stuller Company Information
Table 153. Stuller Description and Business Overview
Table 154. Stuller Gold Jewelry Sales (K Units), Revenue (US$ Million), Price (USD/Unit), and Gross Margin (2021–2026)
Table 155. Stuller Gold Jewelry Product
Table 156. Stuller Recent Developments/Updates
Table 157. Mingr Company Information
Table 158. Mingr Description and Business Overview
Table 159. Mingr Gold Jewelry Sales (K Units), Revenue (US$ Million), Price (USD/Unit), and Gross Margin (2021–2026)
Table 160. Mingr Gold Jewelry Product
Table 161. Mingr Recent Developments/Updates
Table 162. Graff Diamond Company Information
Table 163. Graff Diamond Description and Business Overview
Table 164. Graff Diamond Gold Jewelry Sales (K Units), Revenue (US$ Million), Price (USD/Unit), and Gross Margin (2021–2026)
Table 165. Graff Diamond Gold Jewelry Product
Table 166. Graff Diamond Recent Developments/Updates
Table 167. Caibai Jewelry Company Information
Table 168. Caibai Jewelry Description and Business Overview
Table 169. Caibai Jewelry Gold Jewelry Sales (K Units), Revenue (US$ Million), Price (USD/Unit), and Gross Margin (2021–2026)
Table 170. Caibai Jewelry Gold Jewelry Product
Table 171. Caibai Jewelry Recent Developments/Updates
Table 172. Damas International Company Information
Table 173. Damas International Description and Business Overview
Table 174. Damas International Gold Jewelry Sales (K Units), Revenue (US$ Million), Price (USD/Unit), and Gross Margin (2021–2026)
Table 175. Damas International Gold Jewelry Product
Table 176. Damas International Recent Developments/Updates
Table 177. Cuihua Gold Company Information
Table 178. Cuihua Gold Description and Business Overview
Table 179. Cuihua Gold Gold Jewelry Sales (K Units), Revenue (US$ Million), Price (USD/Unit), and Gross Margin (2021–2026)
Table 180. Cuihua Gold Gold Jewelry Product
Table 181. Cuihua Gold Recent Developments/Updates
Table 182. TSL Company Information
Table 183. TSL Description and Business Overview
Table 184. TSL Gold Jewelry Sales (K Units), Revenue (US$ Million), Price (USD/Unit), and Gross Margin (2021–2026)
Table 185. TSL Gold Jewelry Product
Table 186. TSL Recent Developments/Updates
Table 187. CHJ Company Information
Table 188. CHJ Description and Business Overview
Table 189. CHJ Gold Jewelry Sales (K Units), Revenue (US$ Million), Price (USD/Unit), and Gross Margin (2021–2026)
Table 190. CHJ Gold Jewelry Product
Table 191. CHJ Recent Developments/Updates
Table 192. Asian Star Company Company Information
Table 193. Asian Star Company Description and Business Overview
Table 194. Asian Star Company Gold Jewelry Sales (K Units), Revenue (US$ Million), Price (USD/Unit), and Gross Margin (2021–2026)
Table 195. Asian Star Company Gold Jewelry Product
Table 196. Asian Star Company Recent Developments/Updates
Table 197. TBZ Shrikant Zaveri Company Information
Table 198. TBZ Shrikant Zaveri Description and Business Overview
Table 199. TBZ Shrikant Zaveri Gold Jewelry Sales (K Units), Revenue (US$ Million), Price (USD/Unit), and Gross Margin (2021–2026)
Table 200. TBZ Shrikant Zaveri Gold Jewelry Product
Table 201. TBZ Shrikant Zaveri Recent Developments/Updates
Table 202. Thangamayil Company Information
Table 203. Thangamayil Description and Business Overview
Table 204. Thangamayil Gold Jewelry Sales (K Units), Revenue (US$ Million), Price (USD/Unit), and Gross Margin (2021–2026)
Table 205. Thangamayil Gold Jewelry Product
Table 206. Thangamayil Recent Developments/Updates
Table 207. Chopard Company Information
Table 208. Chopard Description and Business Overview
Table 209. Chopard Gold Jewelry Sales (K Units), Revenue (US$ Million), Price (USD/Unit), and Gross Margin (2021–2026)
Table 210. Chopard Gold Jewelry Product
Table 211. Chopard Recent Developments/Updates
Table 212. David Yurman Company Information
Table 213. David Yurman Description and Business Overview
Table 214. David Yurman Gold Jewelry Sales (K Units), Revenue (US$ Million), Price (USD/Unit), and Gross Margin (2021–2026)
Table 215. David Yurman Gold Jewelry Product
Table 216. David Yurman Recent Developments/Updates
Table 217. MIKIMOTO Company Information
Table 218. MIKIMOTO Description and Business Overview
Table 219. MIKIMOTO Gold Jewelry Sales (K Units), Revenue (US$ Million), Price (USD/Unit), and Gross Margin (2021–2026)
Table 220. MIKIMOTO Gold Jewelry Product
Table 221. MIKIMOTO Recent Developments/Updates
Table 222. YUYUAN Company Information
Table 223. YUYUAN Description and Business Overview
Table 224. YUYUAN Gold Jewelry Sales (K Units), Revenue (US$ Million), Price (USD/Unit), and Gross Margin (2021–2026)
Table 225. YUYUAN Gold Jewelry Product
Table 226. YUYUAN Recent Developments/Updates
Table 227. Key Raw Materials Lists
Table 228. Raw Materials Key Suppliers Lists
Table 229. Gold Jewelry Distributors List
Table 230. Gold Jewelry Customers List
Table 231. Gold Jewelry Market Trends
Table 232. Gold Jewelry Market Drivers
Table 233. Gold Jewelry Market Challenges
Table 234. Gold Jewelry Market Restraints
Table 235. Research Programs/Design for This Report
Table 236. Key Data Information from Secondary Sources
Table 237. Key Data Information from Primary Sources
Table 238. Authors List of This Report
List of Figures
Figure 1. Product Picture of Gold Jewelry
Figure 2. Global Gold Jewelry Market Value by Type (US$ Million), 2021–2032
Figure 3. Global Gold Jewelry Market Share by Type: 2025 & 2032
Figure 4. Pure Gold Product Picture
Figure 5. 24K Gold Product Picture
Figure 6. 18K Gold Product Picture
Figure 7. Other Product Picture
Figure 8. Global Gold Jewelry Market Value by End Use (US$ Million), 2021–2032
Figure 9. Global Gold Jewelry Market Share by End Use: 2025 vs 2032
Figure 10. Collections Product Picture
Figure 11. Wedding Product Picture
Figure 12. Festive Blessing Product Picture
Figure 13. Fashion Product Picture
Figure 14. Others Product Picture
Figure 15. Global Gold Jewelry Market Value by Craftsmanship (US$ Million), 2021–2032
Figure 16. Global Gold Jewelry Market Share by Craftsmanship: 2025 vs 2032
Figure 17. Hand-Inlay Product Picture
Figure 18. Laser Engraving Product Picture
Figure 19. Other Product Picture
Figure 20. Global Gold Jewelry Market Value by Sales Channel (US$ Million), 2021–2032
Figure 21. Global Gold Jewelry Market Share by Sales Channel: 2025 & 2032
Figure 22. Offline Sales
Figure 23. Online Sales
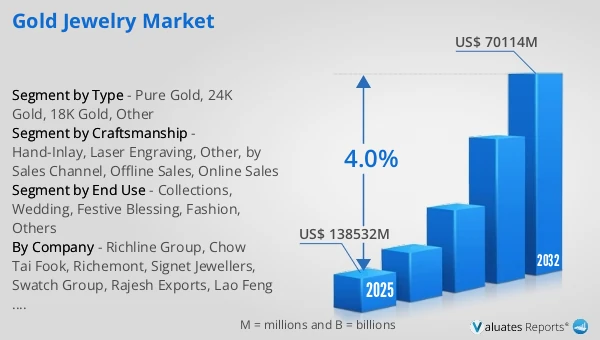
Figure 24. Global Gold Jewelry Revenue, (US$ Million), 2021 vs 2025 vs 2032
Figure 25. Global Gold Jewelry Market Size (US$ Million), 2021–2032
Figure 26. Global Gold Jewelry Sales (K Units), 2021–2032
Figure 27. Global Gold Jewelry Average Price (USD/Unit), 2021–2032
Figure 28. Gold Jewelry Report Years Considered
Figure 29. Gold Jewelry Sales Share by Manufacturers in 2025
Figure 30. Global Gold Jewelry Revenue Share by Manufacturers in 2025
Figure 31. Top 5 and Top 10 Global Gold Jewelry Players: Market Share by Revenue in Gold Jewelry in 2025
Figure 32. Gold Jewelry Market Share by Company Type (Tier 1, Tier 2, and Tier 3): 2021 vs 2025
Figure 33. Global Gold Jewelry Market Size by Region (US$ Million): 2021 vs 2025 vs 2032
Figure 34. North America Gold Jewelry Sales Market Share by Country (2021–2032)
Figure 35. North America Gold Jewelry Revenue Market Share by Country (2021–2032)
Figure 36. U.S. Gold Jewelry Revenue Growth Rate (US$ Million), 2021–2032
Figure 37. Canada Gold Jewelry Revenue Growth Rate (US$ Million), 2021–2032
Figure 38. Europe Gold Jewelry Sales Market Share by Country (2021–2032)
Figure 39. Europe Gold Jewelry Revenue Market Share by Country (2021–2032)
Figure 40. Germany Gold Jewelry Revenue Growth Rate (US$ Million), 2021–2032
Figure 41. France Gold Jewelry Revenue Growth Rate (US$ Million), 2021–2032
Figure 42. U.K. Gold Jewelry Revenue Growth Rate (US$ Million), 2021–2032
Figure 43. Italy Gold Jewelry Revenue Growth Rate (US$ Million), 2021–2032
Figure 44. Russia Gold Jewelry Revenue Growth Rate (US$ Million), 2021–2032
Figure 45. Asia Pacific Gold Jewelry Sales Market Share by Region (2021–2032)
Figure 46. Asia Pacific Gold Jewelry Revenue Market Share by Region (2021–2032)
Figure 47. China Gold Jewelry Revenue Growth Rate (US$ Million), 2021–2032
Figure 48. Japan Gold Jewelry Revenue Growth Rate (US$ Million), 2021–2032
Figure 49. South Korea Gold Jewelry Revenue Growth Rate (US$ Million), 2021–2032
Figure 50. India Gold Jewelry Revenue Growth Rate (US$ Million), 2021–2032
Figure 51. Australia Gold Jewelry Revenue Growth Rate (US$ Million), 2021–2032
Figure 52. Taiwan Gold Jewelry Revenue Growth Rate (US$ Million), 2021–2032
Figure 53. Indonesia Gold Jewelry Revenue Growth Rate (US$ Million), 2021–2032
Figure 54. Thailand Gold Jewelry Revenue Growth Rate (US$ Million), 2021–2032
Figure 55. Malaysia Gold Jewelry Revenue Growth Rate (US$ Million), 2021–2032
Figure 56. Philippines Gold Jewelry Revenue Growth Rate (US$ Million), 2021–2032
Figure 57. Latin America Gold Jewelry Sales Market Share by Country (2021–2032)
Figure 58. Latin America Gold Jewelry Revenue Market Share by Country (2021–2032)
Figure 59. Mexico Gold Jewelry Revenue Growth Rate (US$ Million), 2021–2032
Figure 60. Brazil Gold Jewelry Revenue Growth Rate (US$ Million), 2021–2032
Figure 61. Argentina Gold Jewelry Revenue Growth Rate (US$ Million), 2021–2032
Figure 62. Middle East and Africa Gold Jewelry Sales Market Share by Country (2021–2032)
Figure 63. Middle East and Africa Gold Jewelry Revenue Market Share by Country (2021–2032)
Figure 64. Turkey Gold Jewelry Revenue Growth Rate (US$ Million), 2021–2032
Figure 65. Saudi Arabia Gold Jewelry Revenue Growth Rate (US$ Million), 2021–2032
Figure 66. U.A.E Gold Jewelry Revenue Growth Rate (US$ Million), 2021–2032
Figure 67. Global Sales Market Share of Gold Jewelry by Type (2021–2032)
Figure 68. Global Revenue Market Share of Gold Jewelry by Type (2021–2032)
Figure 69. Global Gold Jewelry Price (USD/Unit) by Type (2021–2032)
Figure 70. Global Sales Market Share of Gold Jewelry by Sales Channel (2021–2032)
Figure 71. Global Revenue Market Share of Gold Jewelry by Sales Channel (2021–2032)
Figure 72. Global Gold Jewelry Price (USD/Unit) by Sales Channel (2021–2032)
Figure 73. Gold Jewelry Value Chain
Figure 74. Channels of Distribution (Direct Vs Distribution)
Figure 75. Bottom-up and Top-down Approaches for This Report
Figure 76. Data Triangulation
Figure 77. Key Executives Interviewed