List of Tables
Table 1. Global Pyrethrins Technical Market Value by Type (US$ Million), 2025 vs 2032
Table 2. Global Pyrethrins Technical Market Value by Purity (US$ Million), 2025 vs 2032
Table 3. Global Pyrethrins Technical Market Value by Product Form (US$ Million), 2025 vs 2032
Table 4. Global Pyrethrins Technical Market Value by Application (US$ Million), 2025 vs 2032
Table 5. Global Pyrethrins Technical Production Capacity (Tons) by Manufacturers in 2025
Table 6. Global Pyrethrins Technical Production by Manufacturers (Tons), 2021–2026
Table 7. Global Pyrethrins Technical Production Market Share by Manufacturers (2021–2026)
Table 8. Global Pyrethrins Technical Production Value by Manufacturers (US$ Million), 2021–2026
Table 9. Global Pyrethrins Technical Production Value Share by Manufacturers (2021–2026)
Table 10. Global Key Players of Pyrethrins Technical, Industry Ranking, 2024 vs 2025
Table 11. Classification of Companies by Tier (Tier 1, Tier 2, Tier 3), based on Pyrethrins Technical Production Value, 2025
Table 12. Global Market Pyrethrins Technical Average Price by Manufacturers (US$/Ton), 2021–2026
Table 13. Global Key Manufacturers of Pyrethrins Technical, Manufacturing Footprints and Headquarters
Table 14. Global Key Manufacturers of Pyrethrins Technical, Product Offerings and Applications
Table 15. Global Key Manufacturers of Pyrethrins Technical, Date of Entry into the Industry
Table 16. Global Pyrethrins Technical Manufacturers Market Concentration Ratio (CR5 and HHI)
Table 17. Mergers & Acquisitions and Expansion Plans
Table 18. Global Pyrethrins Technical Production Value by Region: 2021 vs 2025 vs 2032 (US$ Million)
Table 19. Global Pyrethrins Technical Production Value (US$ Million) by Region (2021–2026)
Table 20. Global Pyrethrins Technical Production Value Market Share by Region (2021–2026)
Table 21. Global Pyrethrins Technical Production Value (US$ Million) Forecast by Region (2027–2032)
Table 22. Global Pyrethrins Technical Production Value Market Share Forecast by Region (2027–2032)
Table 23. Global Pyrethrins Technical Production Comparison by Region: 2021 vs 2025 vs 2032 (Tons)
Table 24. Global Pyrethrins Technical Production (Tons) by Region (2021–2026)
Table 25. Global Pyrethrins Technical Production Market Share by Region (2021–2026)
Table 26. Global Pyrethrins Technical Production (Tons) Forecast by Region (2027–2032)
Table 27. Global Pyrethrins Technical Production Market Share Forecast by Region (2027–2032)
Table 28. Global Pyrethrins Technical Market Average Price (US$/Ton) by Region (2021–2026)
Table 29. Global Pyrethrins Technical Market Average Price (US$/Ton) by Region (2027–2032)
Table 30. Global Pyrethrins Technical Consumption Growth Rate by Region: 2021 vs 2025 vs 2032 (Tons)
Table 31. Global Pyrethrins Technical Consumption by Region (Tons), 2021–2026
Table 32. Global Pyrethrins Technical Consumption Market Share by Region (2021–2026)
Table 33. Global Pyrethrins Technical Forecasted Consumption by Region (Tons), 2027–2032
Table 34. Global Pyrethrins Technical Forecasted Consumption Market Share by Region (2027–2032)
Table 35. North America Pyrethrins Technical Consumption Growth Rate by Country: 2021 vs 2025 vs 2032 (Tons)
Table 36. North America Pyrethrins Technical Consumption by Country (Tons), 2021–2026
Table 37. North America Pyrethrins Technical Consumption by Country (Tons), 2027–2032
Table 38. Europe Pyrethrins Technical Consumption Growth Rate by Country: 2021 vs 2025 vs 2032 (Tons)
Table 39. Europe Pyrethrins Technical Consumption by Country (Tons), 2021–2026
Table 40. Europe Pyrethrins Technical Consumption by Country (Tons), 2027–2032
Table 41. Asia Pacific Pyrethrins Technical Consumption Growth Rate by Region: 2021 vs 2025 vs 2032 (Tons)
Table 42. Asia Pacific Pyrethrins Technical Consumption by Region (Tons), 2021–2026
Table 43. Asia Pacific Pyrethrins Technical Consumption by Region (Tons), 2027–2032
Table 44. Latin America, Middle East & Africa Pyrethrins Technical Consumption Growth Rate by Country: 2021 vs 2025 vs 2032 (Tons)
Table 45. Latin America, Middle East & Africa Pyrethrins Technical Consumption by Country (Tons), 2021–2026
Table 46. Latin America, Middle East & Africa Pyrethrins Technical Consumption by Country (Tons), 2027–2032
Table 47. Global Pyrethrins Technical Production (Tons) by Type (2021–2026)
Table 48. Global Pyrethrins Technical Production (Tons) by Type (2027–2032)
Table 49. Global Pyrethrins Technical Production Market Share by Type (2021–2026)
Table 50. Global Pyrethrins Technical Production Market Share by Type (2027–2032)
Table 51. Global Pyrethrins Technical Production Value (US$ Million) by Type (2021–2026)
Table 52. Global Pyrethrins Technical Production Value (US$ Million) by Type (2027–2032)
Table 53. Global Pyrethrins Technical Production Value Market Share by Type (2021–2026)
Table 54. Global Pyrethrins Technical Production Value Market Share by Type (2027–2032)
Table 55. Global Pyrethrins Technical Price (US$/Ton) by Type (2021–2026)
Table 56. Global Pyrethrins Technical Price (US$/Ton) by Type (2027–2032)
Table 57. Global Pyrethrins Technical Production (Tons) by Application (2021–2026)
Table 58. Global Pyrethrins Technical Production (Tons) by Application (2027–2032)
Table 59. Global Pyrethrins Technical Production Market Share by Application (2021–2026)
Table 60. Global Pyrethrins Technical Production Market Share by Application (2027–2032)
Table 61. Global Pyrethrins Technical Production Value (US$ Million) by Application (2021–2026)
Table 62. Global Pyrethrins Technical Production Value (US$ Million) by Application (2027–2032)
Table 63. Global Pyrethrins Technical Production Value Market Share by Application (2021–2026)
Table 64. Global Pyrethrins Technical Production Value Market Share by Application (2027–2032)
Table 65. Global Pyrethrins Technical Price (US$/Ton) by Application (2021–2026)
Table 66. Global Pyrethrins Technical Price (US$/Ton) by Application (2027–2032)
Table 67. Botanical Resources Australia Pyrethrins Technical Company Information
Table 68. Botanical Resources Australia Pyrethrins Technical Specification and Application
Table 69. Botanical Resources Australia Pyrethrins Technical Production (Tons), Value (US$ Million), Price (US$/Ton) and Gross Margin (2021–2026)
Table 70. Botanical Resources Australia Main Business and Markets Served
Table 71. Botanical Resources Australia Recent Developments/Updates
Table 72. Horizon SOPYRWA Pyrethrins Technical Company Information
Table 73. Horizon SOPYRWA Pyrethrins Technical Specification and Application
Table 74. Horizon SOPYRWA Pyrethrins Technical Production (Tons), Value (US$ Million), Price (US$/Ton) and Gross Margin (2021–2026)
Table 75. Horizon SOPYRWA Main Business and Markets Served
Table 76. Horizon SOPYRWA Recent Developments/Updates
Table 77. Pyrethrum Company of Tanzania Pyrethrins Technical Company Information
Table 78. Pyrethrum Company of Tanzania Pyrethrins Technical Specification and Application
Table 79. Pyrethrum Company of Tanzania Pyrethrins Technical Production (Tons), Value (US$ Million), Price (US$/Ton) and Gross Margin (2021–2026)
Table 80. Pyrethrum Company of Tanzania Main Business and Markets Served
Table 81. Pyrethrum Company of Tanzania Recent Developments/Updates
Table 82. KAPI Limited Pyrethrins Technical Company Information
Table 83. KAPI Limited Pyrethrins Technical Specification and Application
Table 84. KAPI Limited Pyrethrins Technical Production (Tons), Value (US$ Million), Price (US$/Ton) and Gross Margin (2021–2026)
Table 85. KAPI Limited Main Business and Markets Served
Table 86. KAPI Limited Recent Developments/Updates
Table 87. KINTAI Pyrethrins Technical Company Information
Table 88. KINTAI Pyrethrins Technical Specification and Application
Table 89. KINTAI Pyrethrins Technical Production (Tons), Value (US$ Million), Price (US$/Ton) and Gross Margin (2021–2026)
Table 90. KINTAI Main Business and Markets Served
Table 91. KINTAI Recent Developments/Updates
Table 92. Nayara Nutraciticals Pyrethrins Technical Company Information
Table 93. Nayara Nutraciticals Pyrethrins Technical Specification and Application
Table 94. Nayara Nutraciticals Pyrethrins Technical Production (Tons), Value (US$ Million), Price (US$/Ton) and Gross Margin (2021–2026)
Table 95. Nayara Nutraciticals Main Business and Markets Served
Table 96. Nayara Nutraciticals Recent Developments/Updates
Table 97. Nitapol Industries Pyrethrins Technical Company Information
Table 98. Nitapol Industries Pyrethrins Technical Specification and Application
Table 99. Nitapol Industries Pyrethrins Technical Production (Tons), Value (US$ Million), Price (US$/Ton) and Gross Margin (2021–2026)
Table 100. Nitapol Industries Main Business and Markets Served
Table 101. Nitapol Industries Recent Developments/Updates
Table 102. TDC Industries Pyrethrins Technical Company Information
Table 103. TDC Industries Pyrethrins Technical Specification and Application
Table 104. TDC Industries Pyrethrins Technical Production (Tons), Value (US$ Million), Price (US$/Ton) and Gross Margin (2021–2026)
Table 105. TDC Industries Main Business and Markets Served
Table 106. TDC Industries Recent Developments/Updates
Table 107. Indo Bio Chem Pyrethrins Technical Company Information
Table 108. Indo Bio Chem Pyrethrins Technical Specification and Application
Table 109. Indo Bio Chem Pyrethrins Technical Production (Tons), Value (US$ Million), Price (US$/Ton) and Gross Margin (2021–2026)
Table 110. Indo Bio Chem Main Business and Markets Served
Table 111. Indo Bio Chem Recent Developments/Updates
Table 112. Triown Chemie Pyrethrins Technical Company Information
Table 113. Triown Chemie Pyrethrins Technical Specification and Application
Table 114. Triown Chemie Pyrethrins Technical Production (Tons), Value (US$ Million), Price (US$/Ton) and Gross Margin (2021–2026)
Table 115. Triown Chemie Main Business and Markets Served
Table 116. Triown Chemie Recent Developments/Updates
Table 117. Hunan World Well-Being Bio-Tech Pyrethrins Technical Company Information
Table 118. Hunan World Well-Being Bio-Tech Pyrethrins Technical Specification and Application
Table 119. Hunan World Well-Being Bio-Tech Pyrethrins Technical Production (Tons), Value (US$ Million), Price (US$/Ton) and Gross Margin (2021–2026)
Table 120. Hunan World Well-Being Bio-Tech Main Business and Markets Served
Table 121. Hunan World Well-Being Bio-Tech Recent Developments/Updates
Table 122. Chengdu Agreenco Bio Tech Pyrethrins Technical Company Information
Table 123. Chengdu Agreenco Bio Tech Pyrethrins Technical Specification and Application
Table 124. Chengdu Agreenco Bio Tech Pyrethrins Technical Production (Tons), Value (US$ Million), Price (US$/Ton) and Gross Margin (2021–2026)
Table 125. Chengdu Agreenco Bio Tech Main Business and Markets Served
Table 126. Chengdu Agreenco Bio Tech Recent Developments/Updates
Table 127. Zhejiang Rayfull Chemicals Pyrethrins Technical Company Information
Table 128. Zhejiang Rayfull Chemicals Pyrethrins Technical Specification and Application
Table 129. Zhejiang Rayfull Chemicals Pyrethrins Technical Production (Tons), Value (US$ Million), Price (US$/Ton) and Gross Margin (2021–2026)
Table 130. Zhejiang Rayfull Chemicals Main Business and Markets Served
Table 131. Zhejiang Rayfull Chemicals Recent Developments/Updates
Table 132. Xi’an HJ Herb Biotechnology Pyrethrins Technical Company Information
Table 133. Xi’an HJ Herb Biotechnology Pyrethrins Technical Specification and Application
Table 134. Xi’an HJ Herb Biotechnology Pyrethrins Technical Production (Tons), Value (US$ Million), Price (US$/Ton) and Gross Margin (2021–2026)
Table 135. Xi’an HJ Herb Biotechnology Main Business and Markets Served
Table 136. Xi’an HJ Herb Biotechnology Recent Developments/Updates
Table 137. Xi’an Chen Lang Bio Tech Pyrethrins Technical Company Information
Table 138. Xi’an Chen Lang Bio Tech Pyrethrins Technical Specification and Application
Table 139. Xi’an Chen Lang Bio Tech Pyrethrins Technical Production (Tons), Value (US$ Million), Price (US$/Ton) and Gross Margin (2021–2026)
Table 140. Xi’an Chen Lang Bio Tech Main Business and Markets Served
Table 141. Xi’an Chen Lang Bio Tech Recent Developments/Updates
Table 142. Hebei Tangyun Biotech Pyrethrins Technical Company Information
Table 143. Hebei Tangyun Biotech Pyrethrins Technical Specification and Application
Table 144. Hebei Tangyun Biotech Pyrethrins Technical Production (Tons), Value (US$ Million), Price (US$/Ton) and Gross Margin (2021–2026)
Table 145. Hebei Tangyun Biotech Main Business and Markets Served
Table 146. Hebei Tangyun Biotech Recent Developments/Updates
Table 147. Xi’an Gaoyuan Bio-Chem Pyrethrins Technical Company Information
Table 148. Xi’an Gaoyuan Bio-Chem Pyrethrins Technical Specification and Application
Table 149. Xi’an Gaoyuan Bio-Chem Pyrethrins Technical Production (Tons), Value (US$ Million), Price (US$/Ton) and Gross Margin (2021–2026)
Table 150. Xi’an Gaoyuan Bio-Chem Main Business and Markets Served
Table 151. Xi’an Gaoyuan Bio-Chem Recent Developments/Updates
Table 152. Xi’an Quanao Biotech Pyrethrins Technical Company Information
Table 153. Xi’an Quanao Biotech Pyrethrins Technical Specification and Application
Table 154. Xi’an Quanao Biotech Pyrethrins Technical Production (Tons), Value (US$ Million), Price (US$/Ton) and Gross Margin (2021–2026)
Table 155. Xi’an Quanao Biotech Main Business and Markets Served
Table 156. Xi’an Quanao Biotech Recent Developments/Updates
Table 157. Endura Pyrethrins Technical Company Information
Table 158. Endura Pyrethrins Technical Specification and Application
Table 159. Endura Pyrethrins Technical Production (Tons), Value (US$ Million), Price (US$/Ton) and Gross Margin (2021–2026)
Table 160. Endura Main Business and Markets Served
Table 161. Endura Recent Developments/Updates
Table 162. Key Raw Materials Lists
Table 163. Raw Materials Key Suppliers Lists
Table 164. Pyrethrins Technical Distributors List
Table 165. Pyrethrins Technical Customers List
Table 166. Pyrethrins Technical Market Trends
Table 167. Pyrethrins Technical Market Drivers
Table 168. Pyrethrins Technical Market Challenges
Table 169. Pyrethrins Technical Market Restraints
Table 170. Research Programs/Design for This Report
Table 171. Key Data Information from Secondary Sources
Table 172. Key Data Information from Primary Sources
Table 173. Authors List of This Report
List of Figures
Figure 1. Product Picture of Pyrethrins Technical
Figure 2. Global Pyrethrins Technical Market Value by Type (US$ Million), 2021–2032
Figure 3. Global Pyrethrins Technical Market Share by Type: 2025 vs 2032
Figure 4. Natural Pyrethrins Product Picture
Figure 5. Enriched Extract Product Picture
Figure 6. Global Pyrethrins Technical Market Value by Purity (US$ Million), 2021–2032
Figure 7. Global Pyrethrins Technical Market Share by Purity: 2025 vs 2032
Figure 8. Low Content Type Product Picture
Figure 9. Medium to High Content Type Product Picture
Figure 10. High Purity Type Product Picture
Figure 11. Global Pyrethrins Technical Market Value by Product Form (US$ Million), 2021–2032
Figure 12. Global Pyrethrins Technical Market Share by Product Form: 2025 vs 2032
Figure 13. Oily Liquid Type Product Picture
Figure 14. Emulsifiable Type Product Picture
Figure 15. Compound Type Product Picture
Figure 16. Global Pyrethrins Technical Market Value by Application (US$ Million), 2021–2032
Figure 17. Global Pyrethrins Technical Market Share by Application: 2025 vs 2032
Figure 18. Agriculture
Figure 19. Livestock Farming
Figure 20. Pet Care Industry
Figure 21. Household and Personal Care Products
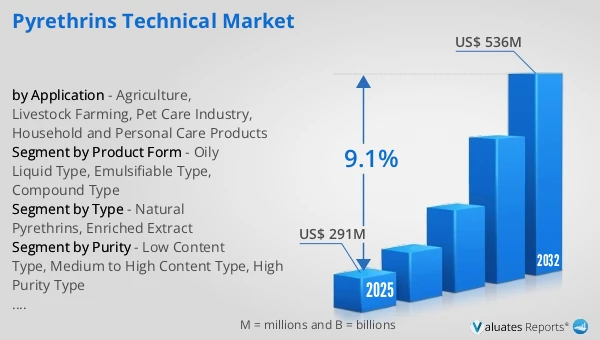
Figure 22. Global Pyrethrins Technical Production Value (US$ Million), 2021 vs 2025 vs 2032
Figure 23. Global Pyrethrins Technical Production Value (US$ Million), 2021–2032
Figure 24. Global Pyrethrins Technical Production Capacity (Tons), 2021–2032
Figure 25. Global Pyrethrins Technical Production (Tons), 2021–2032
Figure 26. Global Pyrethrins Technical Average Price (US$/Ton), 2021–2032
Figure 27. Pyrethrins Technical Report Years Considered
Figure 28. Pyrethrins Technical Production Share by Manufacturers in 2025
Figure 29. Global Pyrethrins Technical Production Value Share by Manufacturers (2025)
Figure 30. Pyrethrins Technical Market Share by Company Type (Tier 1, Tier 2, and Tier 3): 2021 vs 2025
Figure 31. Top 5 and Top 10 Global Players: Market Share by Pyrethrins Technical Revenue in 2025
Figure 32. Global Pyrethrins Technical Production Value by Region: 2021 vs 2025 vs 2032 (US$ Million)
Figure 33. Global Pyrethrins Technical Production Value Market Share by Region: 2021 vs 2025 vs 2032
Figure 34. Global Pyrethrins Technical Production Comparison by Region: 2021 vs 2025 vs 2032 (Tons)
Figure 35. Global Pyrethrins Technical Production Market Share by Region: 2021 vs 2025 vs 2032
Figure 36. North America Pyrethrins Technical Production Value (US$ Million) Growth Rate (2021–2032)
Figure 37. Europe Pyrethrins Technical Production Value (US$ Million) Growth Rate (2021–2032)
Figure 38. China Pyrethrins Technical Production Value (US$ Million) Growth Rate (2021–2032)
Figure 39. Japan Pyrethrins Technical Production Value (US$ Million) Growth Rate (2021–2032)
Figure 40. India Pyrethrins Technical Production Value (US$ Million) Growth Rate (2021–2032)
Figure 41. Southeast Asia Pyrethrins Technical Production Value (US$ Million) Growth Rate (2021–2032)
Figure 42. Global Pyrethrins Technical Consumption by Region: 2021 vs 2025 vs 2032 (Tons)
Figure 43. Global Pyrethrins Technical Consumption Market Share by Region: 2021 vs 2025 vs 2032
Figure 44. North America Pyrethrins Technical Consumption and Growth Rate (Tons), 2021–2032
Figure 45. North America Pyrethrins Technical Consumption Market Share by Country (2021–2032)
Figure 46. U.S. Pyrethrins Technical Consumption and Growth Rate (Tons), 2021–2032
Figure 47. Canada Pyrethrins Technical Consumption and Growth Rate (Tons), 2021–2032
Figure 48. Europe Pyrethrins Technical Consumption and Growth Rate (Tons), 2021–2032
Figure 49. Europe Pyrethrins Technical Consumption Market Share by Country (2021–2032)
Figure 50. Germany Pyrethrins Technical Consumption and Growth Rate (Tons), 2021–2032
Figure 51. France Pyrethrins Technical Consumption and Growth Rate (Tons), 2021–2032
Figure 52. U.K. Pyrethrins Technical Consumption and Growth Rate (Tons), 2021–2032
Figure 53. Italy Pyrethrins Technical Consumption and Growth Rate (Tons), 2021–2032
Figure 54. Russia Pyrethrins Technical Consumption and Growth Rate (Tons), 2021–2032
Figure 55. Asia Pacific Pyrethrins Technical Consumption and Growth Rate (Tons), 2021–2032
Figure 56. Asia Pacific Pyrethrins Technical Consumption Market Share by Region (2021–2032)
Figure 57. China Pyrethrins Technical Consumption and Growth Rate (Tons), 2021–2032
Figure 58. Japan Pyrethrins Technical Consumption and Growth Rate (Tons), 2021–2032
Figure 59. South Korea Pyrethrins Technical Consumption and Growth Rate (Tons), 2021–2032
Figure 60. China Taiwan Pyrethrins Technical Consumption and Growth Rate (Tons), 2021–2032
Figure 61. Southeast Asia Pyrethrins Technical Consumption and Growth Rate (Tons), 2021–2032
Figure 62. India Pyrethrins Technical Consumption and Growth Rate (Tons), 2021–2032
Figure 63. Latin America, Middle East & Africa Pyrethrins Technical Consumption and Growth Rate (Tons), 2021–2032
Figure 64. Latin America, Middle East & Africa Pyrethrins Technical Consumption Market Share by Country (2021–2032)
Figure 65. Mexico Pyrethrins Technical Consumption and Growth Rate (Tons), 2021–2032
Figure 66. Brazil Pyrethrins Technical Consumption and Growth Rate (Tons), 2021–2032
Figure 67. Turkey Pyrethrins Technical Consumption and Growth Rate (Tons), 2021–2032
Figure 68. GCC Countries Pyrethrins Technical Consumption and Growth Rate (Tons), 2021–2032
Figure 69. Global Production Market Share of Pyrethrins Technical by Type (2021–2032)
Figure 70. Global Production Value Market Share of Pyrethrins Technical by Type (2021–2032)
Figure 71. Global Pyrethrins Technical Price (US$/Ton) by Type (2021–2032)
Figure 72. Global Production Market Share of Pyrethrins Technical by Application (2021–2032)
Figure 73. Global Production Value Market Share of Pyrethrins Technical by Application (2021–2032)
Figure 74. Global Pyrethrins Technical Price (US$/Ton) by Application (2021–2032)
Figure 75. Pyrethrins Technical Value Chain
Figure 76. Channels of Distribution (Direct Vs Distribution)
Figure 77. Bottom-up and Top-down Approaches for This Report
Figure 78. Data Triangulation