List of Tables
Table 1. Global AI Structured Query Language (SQL) Tool Market Size Growth Rate by Type (US$ Million): 2020 VS 2024 VS 2031
Table 2. Key Players of Natural Language to SQL Tools
Table 3. Key Players of SQL Optimization Engines
Table 4. Key Players of Knowledge Graph Enhancement Tools
Table 5. Global AI Structured Query Language (SQL) Tool Market Size Growth Rate by Features and Characteristics (US$ Million): 2020 VS 2024 VS 2031
Table 6. Key Players of Dynamic Query Optimization
Table 7. Key Players of Data Type Conversion and ETL Automation
Table 8. Global AI Structured Query Language (SQL) Tool Market Size Growth Rate by Deployment Perspective (US$ Million): 2020 VS 2024 VS 2031
Table 9. Key Players of SaaS Cloud Deployment
Table 10. Key Players of Local Server Deployment
Table 11. Key Players of Hybrid Cloud Deployment
Table 12. Key Players of Edge Deployment
Table 13. Global AI Structured Query Language (SQL) Tool Market Size Growth by Application (US$ Million): 2020 VS 2024 VS 2031
Table 14. Global AI Structured Query Language (SQL) Tool Market Size by Region (US$ Million): 2020 VS 2024 VS 2031
Table 15. Global AI Structured Query Language (SQL) Tool Market Size by Region (2020-2025) & (US$ Million)
Table 16. Global AI Structured Query Language (SQL) Tool Market Share by Region (2020-2025)
Table 17. Global AI Structured Query Language (SQL) Tool Forecasted Market Size by Region (2026-2031) & (US$ Million)
Table 18. Global AI Structured Query Language (SQL) Tool Market Share by Region (2026-2031)
Table 19. AI Structured Query Language (SQL) Tool Market Trends
Table 20. AI Structured Query Language (SQL) Tool Market Drivers
Table 21. AI Structured Query Language (SQL) Tool Market Challenges
Table 22. AI Structured Query Language (SQL) Tool Market Restraints
Table 23. Global AI Structured Query Language (SQL) Tool Revenue by Players (2020-2025) & (US$ Million)
Table 24. Global AI Structured Query Language (SQL) Tool Market Share by Players (2020-2025)
Table 25. Global Top AI Structured Query Language (SQL) Tool Players by Company Type (Tier 1, Tier 2, and Tier 3) & (based on the Revenue in AI Structured Query Language (SQL) Tool as of 2024)
Table 26. Ranking of Global Top AI Structured Query Language (SQL) Tool Companies by Revenue (US$ Million) in 2024
Table 27. Global 5 Largest Players Market Share by AI Structured Query Language (SQL) Tool Revenue (CR5 and HHI) & (2020-2025)
Table 28. Global Key Players of AI Structured Query Language (SQL) Tool, Headquarters and Area Served
Table 29. Global Key Players of AI Structured Query Language (SQL) Tool, Product and Application
Table 30. Global Key Players of AI Structured Query Language (SQL) Tool, Date of Enter into This Industry
Table 31. Mergers & Acquisitions, Expansion Plans
Table 32. Global AI Structured Query Language (SQL) Tool Market Size by Type (2020-2025) & (US$ Million)
Table 33. Global AI Structured Query Language (SQL) Tool Revenue Market Share by Type (2020-2025)
Table 34. Global AI Structured Query Language (SQL) Tool Forecasted Market Size by Type (2026-2031) & (US$ Million)
Table 35. Global AI Structured Query Language (SQL) Tool Revenue Market Share by Type (2026-2031)
Table 36. Global AI Structured Query Language (SQL) Tool Market Size by Application (2020-2025) & (US$ Million)
Table 37. Global AI Structured Query Language (SQL) Tool Revenue Market Share by Application (2020-2025)
Table 38. Global AI Structured Query Language (SQL) Tool Forecasted Market Size by Application (2026-2031) & (US$ Million)
Table 39. Global AI Structured Query Language (SQL) Tool Revenue Market Share by Application (2026-2031)
Table 40. North America AI Structured Query Language (SQL) Tool Market Size Growth Rate by Country (US$ Million): 2020 VS 2024 VS 2031
Table 41. North America AI Structured Query Language (SQL) Tool Market Size by Country (2020-2025) & (US$ Million)
Table 42. North America AI Structured Query Language (SQL) Tool Market Size by Country (2026-2031) & (US$ Million)
Table 43. Europe AI Structured Query Language (SQL) Tool Market Size Growth Rate by Country (US$ Million): 2020 VS 2024 VS 2031
Table 44. Europe AI Structured Query Language (SQL) Tool Market Size by Country (2020-2025) & (US$ Million)
Table 45. Europe AI Structured Query Language (SQL) Tool Market Size by Country (2026-2031) & (US$ Million)
Table 46. Asia-Pacific AI Structured Query Language (SQL) Tool Market Size Growth Rate by Region (US$ Million): 2020 VS 2024 VS 2031
Table 47. Asia-Pacific AI Structured Query Language (SQL) Tool Market Size by Region (2020-2025) & (US$ Million)
Table 48. Asia-Pacific AI Structured Query Language (SQL) Tool Market Size by Region (2026-2031) & (US$ Million)
Table 49. Latin America AI Structured Query Language (SQL) Tool Market Size Growth Rate by Country (US$ Million): 2020 VS 2024 VS 2031
Table 50. Latin America AI Structured Query Language (SQL) Tool Market Size by Country (2020-2025) & (US$ Million)
Table 51. Latin America AI Structured Query Language (SQL) Tool Market Size by Country (2026-2031) & (US$ Million)
Table 52. Middle East & Africa AI Structured Query Language (SQL) Tool Market Size Growth Rate by Country (US$ Million): 2020 VS 2024 VS 2031
Table 53. Middle East & Africa AI Structured Query Language (SQL) Tool Market Size by Country (2020-2025) & (US$ Million)
Table 54. Middle East & Africa AI Structured Query Language (SQL) Tool Market Size by Country (2026-2031) & (US$ Million)
Table 55. Ant Financial Company Details
Table 56. Ant Financial Business Overview
Table 57. Ant Financial AI Structured Query Language (SQL) Tool Product
Table 58. Ant Financial Revenue in AI Structured Query Language (SQL) Tool Business (2020-2025) & (US$ Million)
Table 59. Ant Financial Recent Development
Table 60. Guanyuan Data Company Details
Table 61. Guanyuan Data Business Overview
Table 62. Guanyuan Data AI Structured Query Language (SQL) Tool Product
Table 63. Guanyuan Data Revenue in AI Structured Query Language (SQL) Tool Business (2020-2025) & (US$ Million)
Table 64. Guanyuan Data Recent Development
Table 65. Huawei Company Details
Table 66. Huawei Business Overview
Table 67. Huawei AI Structured Query Language (SQL) Tool Product
Table 68. Huawei Revenue in AI Structured Query Language (SQL) Tool Business (2020-2025) & (US$ Million)
Table 69. Huawei Recent Development
Table 70. Baidu AI Cloud Company Details
Table 71. Baidu AI Cloud Business Overview
Table 72. Baidu AI Cloud AI Structured Query Language (SQL) Tool Product
Table 73. Baidu AI Cloud Revenue in AI Structured Query Language (SQL) Tool Business (2020-2025) & (US$ Million)
Table 74. Baidu AI Cloud Recent Development
Table 75. SenseTime Company Details
Table 76. SenseTime Business Overview
Table 77. SenseTime AI Structured Query Language (SQL) Tool Product
Table 78. SenseTime Revenue in AI Structured Query Language (SQL) Tool Business (2020-2025) & (US$ Million)
Table 79. SenseTime Recent Development
Table 80. Sichuan Jinbiao Network Technology Company Details
Table 81. Sichuan Jinbiao Network Technology Business Overview
Table 82. Sichuan Jinbiao Network Technology AI Structured Query Language (SQL) Tool Product
Table 83. Sichuan Jinbiao Network Technology Revenue in AI Structured Query Language (SQL) Tool Business (2020-2025) & (US$ Million)
Table 84. Sichuan Jinbiao Network Technology Recent Development
Table 85. Databricks Company Details
Table 86. Databricks Business Overview
Table 87. Databricks AI Structured Query Language (SQL) Tool Product
Table 88. Databricks Revenue in AI Structured Query Language (SQL) Tool Business (2020-2025) & (US$ Million)
Table 89. Databricks Recent Development
Table 90. SambaNova Systems Company Details
Table 91. SambaNova Systems Business Overview
Table 92. SambaNova Systems AI Structured Query Language (SQL) Tool Product
Table 93. SambaNova Systems Revenue in AI Structured Query Language (SQL) Tool Business (2020-2025) & (US$ Million)
Table 94. SambaNova Systems Recent Development
Table 95. Haitian Ruisheng Company Details
Table 96. Haitian Ruisheng Business Overview
Table 97. Haitian Ruisheng AI Structured Query Language (SQL) Tool Product
Table 98. Haitian Ruisheng Revenue in AI Structured Query Language (SQL) Tool Business (2020-2025) & (US$ Million)
Table 99. Haitian Ruisheng Recent Development
Table 100. Inspur Information Company Details
Table 101. Inspur Information Business Overview
Table 102. Inspur Information AI Structured Query Language (SQL) Tool Product
Table 103. Inspur Information Revenue in AI Structured Query Language (SQL) Tool Business (2020-2025) & (US$ Million)
Table 104. Inspur Information Recent Development
Table 105. China Unicom Company Details
Table 106. China Unicom Business Overview
Table 107. China Unicom AI Structured Query Language (SQL) Tool Product
Table 108. China Unicom Revenue in AI Structured Query Language (SQL) Tool Business (2020-2025) & (US$ Million)
Table 109. China Unicom Recent Development
Table 110. Yunce Data Company Details
Table 111. Yunce Data Business Overview
Table 112. Yunce Data AI Structured Query Language (SQL) Tool Product
Table 113. Yunce Data Revenue in AI Structured Query Language (SQL) Tool Business (2020-2025) & (US$ Million)
Table 114. Yunce Data Recent Development
Table 115. StarRing Technology Company Details
Table 116. StarRing Technology Business Overview
Table 117. StarRing Technology AI Structured Query Language (SQL) Tool Product
Table 118. StarRing Technology Revenue in AI Structured Query Language (SQL) Tool Business (2020-2025) & (US$ Million)
Table 119. StarRing Technology Recent Development
Table 120. Kaiyun Company Details
Table 121. Kaiyun Business Overview
Table 122. Kaiyun AI Structured Query Language (SQL) Tool Product
Table 123. Kaiyun Revenue in AI Structured Query Language (SQL) Tool Business (2020-2025) & (US$ Million)
Table 124. Kaiyun Recent Development
Table 125. Scale AI Company Details
Table 126. Scale AI Business Overview
Table 127. Scale AI AI Structured Query Language (SQL) Tool Product
Table 128. Scale AI Revenue in AI Structured Query Language (SQL) Tool Business (2020-2025) & (US$ Million)
Table 129. Scale AI Recent Development
Table 130. Dingdian Data Company Details
Table 131. Dingdian Data Business Overview
Table 132. Dingdian Data AI Structured Query Language (SQL) Tool Product
Table 133. Dingdian Data Revenue in AI Structured Query Language (SQL) Tool Business (2020-2025) & (US$ Million)
Table 134. Dingdian Data Recent Development
Table 135. Price2Spy Company Details
Table 136. Price2Spy Business Overview
Table 137. Price2Spy AI Structured Query Language (SQL) Tool Product
Table 138. Price2Spy Revenue in AI Structured Query Language (SQL) Tool Business (2020-2025) & (US$ Million)
Table 139. Price2Spy Recent Development
Table 140. Competera Company Details
Table 141. Competera Business Overview
Table 142. Competera AI Structured Query Language (SQL) Tool Product
Table 143. Competera Revenue in AI Structured Query Language (SQL) Tool Business (2020-2025) & (US$ Million)
Table 144. Competera Recent Development
Table 145. OmniaRetail Company Details
Table 146. OmniaRetail Business Overview
Table 147. OmniaRetail AI Structured Query Language (SQL) Tool Product
Table 148. OmniaRetail Revenue in AI Structured Query Language (SQL) Tool Business (2020-2025) & (US$ Million)
Table 149. OmniaRetail Recent Development
Table 150. Keepa Company Details
Table 151. Keepa Business Overview
Table 152. Keepa AI Structured Query Language (SQL) Tool Product
Table 153. Keepa Revenue in AI Structured Query Language (SQL) Tool Business (2020-2025) & (US$ Million)
Table 154. Keepa Recent Development
Table 155. Research Programs/Design for This Report
Table 156. Key Data Information from Secondary Sources
Table 157. Key Data Information from Primary Sources
Table 158. Authors List of This Report
List of Figures
Figure 1. AI Structured Query Language (SQL) Tool Picture
Figure 2. Global AI Structured Query Language (SQL) Tool Market Size Comparison by Type (2020-2031) & (US$ Million)
Figure 3. Global AI Structured Query Language (SQL) Tool Market Share by Type: 2024 VS 2031
Figure 4. Natural Language to SQL Tools Features
Figure 5. SQL Optimization Engines Features
Figure 6. Knowledge Graph Enhancement Tools Features
Figure 7. Global AI Structured Query Language (SQL) Tool Market Size Comparison by Features and Characteristics (2020-2031) & (US$ Million)
Figure 8. Dynamic Query Optimization Features
Figure 9. Data Type Conversion and ETL Automation Features
Figure 10. Global AI Structured Query Language (SQL) Tool Market Size Comparison by Deployment Perspective (2020-2031) & (US$ Million)
Figure 11. SaaS Cloud Deployment Features
Figure 12. Local Server Deployment Features
Figure 13. Hybrid Cloud Deployment Features
Figure 14. Edge Deployment Features
Figure 15. Global AI Structured Query Language (SQL) Tool Market Size by Application (2020-2031) & (US$ Million)
Figure 16. Global AI Structured Query Language (SQL) Tool Market Share by Application: 2024 VS 2031
Figure 17. Financial Industry Case Studies
Figure 18. Retail Industry Case Studies
Figure 19. Healthcare Industry Case Studies
Figure 20. Manufacturing Industry Case Studies
Figure 21. Other Case Studies
Figure 22. AI Structured Query Language (SQL) Tool Report Years Considered
Figure 23. Global AI Structured Query Language (SQL) Tool Market Size (US$ Million), Year-over-Year: 2020-2031
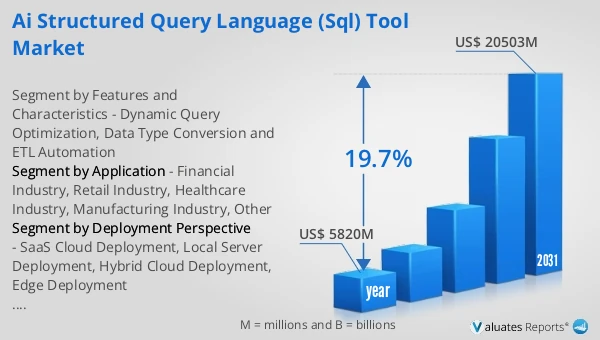
Figure 24. Global AI Structured Query Language (SQL) Tool Market Size, (US$ Million), 2020 VS 2024 VS 2031
Figure 25. Global AI Structured Query Language (SQL) Tool Market Share by Region: 2024 VS 2031
Figure 26. Global AI Structured Query Language (SQL) Tool Market Share by Players in 2024
Figure 27. Global AI Structured Query Language (SQL) Tool Market Share by Company Type (Tier 1, Tier 2, and Tier 3)
Figure 28. The Top 10 and 5 Players Market Share by AI Structured Query Language (SQL) Tool Revenue in 2024
Figure 29. North America AI Structured Query Language (SQL) Tool Market Size YoY Growth (2020-2031) & (US$ Million)
Figure 30. North America AI Structured Query Language (SQL) Tool Market Share by Country (2020-2031)
Figure 31. United States AI Structured Query Language (SQL) Tool Market Size YoY Growth (2020-2031) & (US$ Million)
Figure 32. Canada AI Structured Query Language (SQL) Tool Market Size YoY Growth (2020-2031) & (US$ Million)
Figure 33. Europe AI Structured Query Language (SQL) Tool Market Size YoY Growth (2020-2031) & (US$ Million)
Figure 34. Europe AI Structured Query Language (SQL) Tool Market Share by Country (2020-2031)
Figure 35. Germany AI Structured Query Language (SQL) Tool Market Size YoY Growth (2020-2031) & (US$ Million)
Figure 36. France AI Structured Query Language (SQL) Tool Market Size YoY Growth (2020-2031) & (US$ Million)
Figure 37. U.K. AI Structured Query Language (SQL) Tool Market Size YoY Growth (2020-2031) & (US$ Million)
Figure 38. Italy AI Structured Query Language (SQL) Tool Market Size YoY Growth (2020-2031) & (US$ Million)
Figure 39. Russia AI Structured Query Language (SQL) Tool Market Size YoY Growth (2020-2031) & (US$ Million)
Figure 40. Ireland AI Structured Query Language (SQL) Tool Market Size YoY Growth (2020-2031) & (US$ Million)
Figure 41. Asia-Pacific AI Structured Query Language (SQL) Tool Market Size YoY Growth (2020-2031) & (US$ Million)
Figure 42. Asia-Pacific AI Structured Query Language (SQL) Tool Market Share by Region (2020-2031)
Figure 43. China AI Structured Query Language (SQL) Tool Market Size YoY Growth (2020-2031) & (US$ Million)
Figure 44. Japan AI Structured Query Language (SQL) Tool Market Size YoY Growth (2020-2031) & (US$ Million)
Figure 45. South Korea AI Structured Query Language (SQL) Tool Market Size YoY Growth (2020-2031) & (US$ Million)
Figure 46. Southeast Asia AI Structured Query Language (SQL) Tool Market Size YoY Growth (2020-2031) & (US$ Million)
Figure 47. India AI Structured Query Language (SQL) Tool Market Size YoY Growth (2020-2031) & (US$ Million)
Figure 48. Australia & New Zealand AI Structured Query Language (SQL) Tool Market Size YoY Growth (2020-2031) & (US$ Million)
Figure 49. Latin America AI Structured Query Language (SQL) Tool Market Size YoY Growth (2020-2031) & (US$ Million)
Figure 50. Latin America AI Structured Query Language (SQL) Tool Market Share by Country (2020-2031)
Figure 51. Mexico AI Structured Query Language (SQL) Tool Market Size YoY Growth (2020-2031) & (US$ Million)
Figure 52. Brazil AI Structured Query Language (SQL) Tool Market Size YoY Growth (2020-2031) & (US$ Million)
Figure 53. Middle East & Africa AI Structured Query Language (SQL) Tool Market Size YoY Growth (2020-2031) & (US$ Million)
Figure 54. Middle East & Africa AI Structured Query Language (SQL) Tool Market Share by Country (2020-2031)
Figure 55. Israel AI Structured Query Language (SQL) Tool Market Size YoY Growth (2020-2031) & (US$ Million)
Figure 56. Saudi Arabia AI Structured Query Language (SQL) Tool Market Size YoY Growth (2020-2031) & (US$ Million)
Figure 57. UAE AI Structured Query Language (SQL) Tool Market Size YoY Growth (2020-2031) & (US$ Million)
Figure 58. Ant Financial Revenue Growth Rate in AI Structured Query Language (SQL) Tool Business (2020-2025)
Figure 59. Guanyuan Data Revenue Growth Rate in AI Structured Query Language (SQL) Tool Business (2020-2025)
Figure 60. Huawei Revenue Growth Rate in AI Structured Query Language (SQL) Tool Business (2020-2025)
Figure 61. Baidu AI Cloud Revenue Growth Rate in AI Structured Query Language (SQL) Tool Business (2020-2025)
Figure 62. SenseTime Revenue Growth Rate in AI Structured Query Language (SQL) Tool Business (2020-2025)
Figure 63. Sichuan Jinbiao Network Technology Revenue Growth Rate in AI Structured Query Language (SQL) Tool Business (2020-2025)
Figure 64. Databricks Revenue Growth Rate in AI Structured Query Language (SQL) Tool Business (2020-2025)
Figure 65. SambaNova Systems Revenue Growth Rate in AI Structured Query Language (SQL) Tool Business (2020-2025)
Figure 66. Haitian Ruisheng Revenue Growth Rate in AI Structured Query Language (SQL) Tool Business (2020-2025)
Figure 67. Inspur Information Revenue Growth Rate in AI Structured Query Language (SQL) Tool Business (2020-2025)
Figure 68. China Unicom Revenue Growth Rate in AI Structured Query Language (SQL) Tool Business (2020-2025)
Figure 69. Yunce Data Revenue Growth Rate in AI Structured Query Language (SQL) Tool Business (2020-2025)
Figure 70. StarRing Technology Revenue Growth Rate in AI Structured Query Language (SQL) Tool Business (2020-2025)
Figure 71. Kaiyun Revenue Growth Rate in AI Structured Query Language (SQL) Tool Business (2020-2025)
Figure 72. Scale AI Revenue Growth Rate in AI Structured Query Language (SQL) Tool Business (2020-2025)
Figure 73. Dingdian Data Revenue Growth Rate in AI Structured Query Language (SQL) Tool Business (2020-2025)
Figure 74. Price2Spy Revenue Growth Rate in AI Structured Query Language (SQL) Tool Business (2020-2025)
Figure 75. Competera Revenue Growth Rate in AI Structured Query Language (SQL) Tool Business (2020-2025)
Figure 76. OmniaRetail Revenue Growth Rate in AI Structured Query Language (SQL) Tool Business (2020-2025)
Figure 77. Keepa Revenue Growth Rate in AI Structured Query Language (SQL) Tool Business (2020-2025)
Figure 78. Bottom-up and Top-down Approaches for This Report
Figure 79. Data Triangulation
Figure 80. Key Executives Interviewed