
Due to the COVID-19 pandemic, the global Lubricant Packaging market size is estimated to be worth USD 5823.3 Million in 2022 and is forecast to a readjusted size of USD 6978.4 Million by 2028 with a CAGR of 3.1% during the review period.
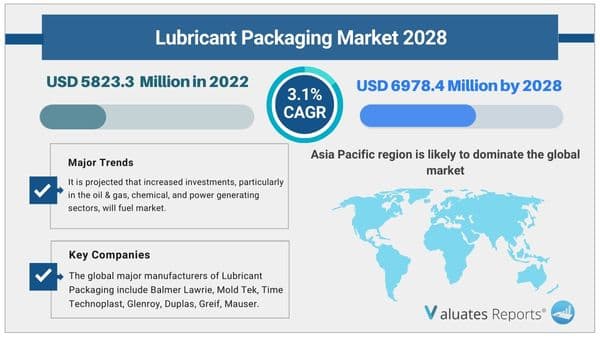
During the forecast period, it is projected that the growth of the power generation sector and the sales of both commercial and passenger cars would fuel the market for lubricant packaging. Additionally, it is anticipated that rising investments will spur market expansion over the course of the projection period, especially in the oil & gas, chemical, and power-generating sectors.
The Lubricant Packaging market is expected to grow throughout the forecasted period as a result of factors like expanding lubricant demand, notably from the automotive industry, and rising industrialization in many emerging economies, including China and India, among others.
The power generation business will profit tremendously over the next several years, significantly raising the demand for the product. Governments must invest in energy projects if they want to expand their economies. The aforementioned trends are expected to hasten the market's expansion for lubricant packaging during the predicted time frame.
The automotive, power generation, oil & gas, and chemical industries are just a few examples of end-use sectors that need mechanical components like pumps, gearboxes, turbines, and compressors, among others. These components require periodic maintenance to function well. Thus, it is predicted that the market for lubricant packaging would grow during the forecast period as a result of rising demand from these end-use industries.
Compressors, turbines, electrostatic rotors, engines, and many other mechanical components in the energy sector typically utilize lubricants to ensure smooth and uninterrupted operation. The need for lubricant packaging would be favorably impacted over the course of the anticipated term by the expansion of power generation projects as a result of significant expenditures made by both private businesses and governments. The market for lubricant packaging is predicted to develop as a result of this aspect.
Lubricant packaging has unavoidably altered over time due to rising costs, shifting material availability, the availability of a wide range of packaging components, and the development of more useful designs. It is anticipated that recycling and sustainable packaging would experience substantial growth in the lubricant packaging industry.
Flexible packaging is gaining popularity among packaging companies due to its accessibility and low cost, which is predicted to fuel the expansion of the packaging market. Additionally, flexible packaging products use 60% less plastic than rigid plastic bottles and are significantly lighter, both of which support the market's expansion.
The Asia Pacific region is anticipated to dominate the global market throughout the projection period. The presence of numerous developing economies, rapid urbanization, and industrialization in the region is expected to boost the demand for lubricants and, as a result, raise the demand for lubricant packaging throughout the course of the projected period.
|
Report Metric |
Details |
|
Report Name |
Lubricant Packaging Market |
|
Market size value in 2022 |
USD 5823.3 Million |
|
Revenue forecast in 2028 |
USD 6978.4 Million |
|
Growth Rate |
CAGR of 3.1% |
|
Base year considered |
2022 |
|
Forecast Period |
2023-2028 |
|
By Type |
Stand-up Pouches, Bottles, Drums, Pails, Cans, Kegs, Tubes, Bag-in-box, IBC |
|
By Application |
Oil & Gas, Automotive, Metal Working, Machine, Industrial, Chemicals |
|
Report Coverage |
Revenue & volume forecast, company share, competitive landscape, growth factors, and trends |
|
Segments Covered |
By Type, Application, and Region |
|
Geographic Regions Covered |
North America, Europe, Asia Pacific, Latin America, Middle East & Africa |
Ans. Yes, we do provide the option to buy chapters in a report. We also can customize the report based on your specific requirements.
Ans. Due to the COVID-19 pandemic, the global Lubricant Packaging market size is estimated to be worth US$ 5823.3 million in 2022 and is forecast to a readjusted size of US$ 6978.4 million by 2028 with a CAGR of 3.1% during the forecast period 2022-2028
Ans. Yes, the report includes a COVID-19 impact analysis. Also, it is further extended into every individual segment of the report.
List of Tables
Table 1. Global Lubricant Packaging Market Size by Type (K MT) & (US$ Million) (2022 VS 2028)
Table 2. Global Lubricant Packaging Market Size by Application (K MT) & (US$ Million) (2022 VS 2028)
Table 3. Lubricant Packaging Market Size Comparison by Region: 2017 VS 2021 VS 2028
Table 4. Global Lubricant Packaging Production Capacity by Manufacturers (2017-2022) & (K MT)
Table 5. Global Lubricant Packaging Production (K MT) by Manufacturers (2017-2022)
Table 6. Global Lubricant Packaging Production Market Share by Manufacturers (2017-2022)
Table 7. Global Lubricant Packaging Revenue by Manufacturers (2017-2022) & (US$ Million)
Table 8. Global Lubricant Packaging Revenue Share by Manufacturers (2017-2022)
Table 9. Company Type (Tier 1, Tier 2 and Tier 3) & (based on the Revenue in Lubricant Packaging as of 2021)
Table 10. Global Market Lubricant Packaging Average Price (USD/MT) of Key Manufacturers (2017-2022)
Table 11. Manufacturers Lubricant Packaging Production Sites and Area Served
Table 12. Manufacturers Lubricant Packaging Product Types
Table 13. Global Lubricant Packaging Manufacturers Market Concentration Ratio (CR5 and HHI)
Table 14. Mergers & Acquisitions, Expansion
Table 15. Global Lubricant Packaging Production Capacity (K MT) by Region (2017-2022)
Table 16. Global Lubricant Packaging Production (K MT) by Region (2017-2022)
Table 17. Global Lubricant Packaging Revenue (US$ Million) by Region (2017-2022)
Table 18. Global Lubricant Packaging Revenue Market Share by Region (2017-2022)
Table 19. Global Lubricant Packaging Production Capacity (K MT), Revenue (US$ Million), Price (USD/MT) and Gross Margin (2017-2022)
Table 20. North America Lubricant Packaging Production Capacity (K MT), Revenue (US$ Million), Price (USD/MT) and Gross Margin (2017-2022)
Table 21. Europe Lubricant Packaging Production (K MT), Revenue (US$ Million), Price (USD/MT) and Gross Margin (2017-2022)
Table 22. China Lubricant Packaging Production Capacity (K MT), Revenue (US$ Million), Price (USD/MT) and Gross Margin (2017-2022)
Table 23. Japan Lubricant Packaging Production Capacity (K MT), Revenue (US$ Million), Price (USD/MT) and Gross Margin (2017-2022)
Table 24. Global Lubricant Packaging Consumption Market by Region (2017-2022) & (K MT)
Table 25. Global Lubricant Packaging Consumption Market Share by Region (2017-2022)
Table 26. North America Lubricant Packaging Consumption by Country (2017-2022) & (K MT)
Table 27. Europe Lubricant Packaging Consumption by Country (2017-2022) & (K MT)
Table 28. Asia Pacific Lubricant Packaging Consumption by Region (2017-2022) & (K MT)
Table 29. Latin America Lubricant Packaging Consumption by Country (2017-2022) & (K MT)
Table 30. Global Lubricant Packaging Production (K MT) by Type (2017-2022)
Table 31. Global Lubricant Packaging Production Market Share by Type (2017-2022)
Table 32. Global Lubricant Packaging Revenue (US$ Million) by Type (2017-2022)
Table 33. Global Lubricant Packaging Revenue Share by Type (2017-2022)
Table 34. Global Lubricant Packaging Price (USD/MT) by Type (2017-2022)
Table 35. Global Lubricant Packaging Production by Application (2017-2022) & (K MT)
Table 36. Global Lubricant Packaging Production Market Share by Application (2017-2022)
Table 37. Global Lubricant Packaging Revenue (US$ Million) by Application (2017-2022)
Table 38. Global Lubricant Packaging Revenue Share by Application (2017-2022)
Table 39. Global Lubricant Packaging Price (USD/MT) by Application (2017-2022)
Table 40. Balmer Lawrie Lubricant Packaging Corporation Information
Table 41. Balmer Lawrie Specification and Application
Table 42. Balmer Lawrie Lubricant Packaging Production Capacity (K MT), Revenue (US$ Million), Price (USD/MT) and Gross Margin (2017-2022)
Table 43. Balmer Lawrie Main Business and Markets Served
Table 44. Balmer Lawrie Recent Developments/Updates
Table 45. Mold Tek Lubricant Packaging Corporation Information
Table 46. Mold Tek Specification and Application
Table 47. Mold Tek Lubricant Packaging Production Capacity (K MT), Revenue (US$ Million), Price (USD/MT) and Gross Margin (2017-2022)
Table 48. Mold Tek Main Business and Markets Served
Table 49. Mold Tek Recent Developments/Updates
Table 50. Time Technoplast Lubricant Packaging Corporation Information
Table 51. Time Technoplast Specification and Application
Table 52. Time Technoplast Lubricant Packaging Production Capacity (K MT), Revenue (US$ Million), Price (USD/MT) and Gross Margin (2017-2022)
Table 53. Time Technoplast Main Business and Markets Served
Table 54. Time Technoplast Recent Developments/Updates
Table 55. Glenroy Lubricant Packaging Corporation Information
Table 56. Glenroy Specification and Application
Table 57. Glenroy Lubricant Packaging Production Capacity (K MT), Revenue (US$ Million), Price (USD/MT) and Gross Margin (2017-2022)
Table 58. Glenroy Main Business and Markets Served
Table 59. Glenroy Recent Developments/Updates
Table 60. Duplas Lubricant Packaging Corporation Information
Table 61. Duplas Specification and Application
Table 62. Duplas Lubricant Packaging Production Capacity (K MT), Revenue (US$ Million), Price (USD/MT) and Gross Margin (2017-2022)
Table 63. Duplas Main Business and Markets Served
Table 64. Duplas Recent Developments/Updates
Table 65. Greif Lubricant Packaging Corporation Information
Table 66. Greif Specification and Application
Table 67. Greif Lubricant Packaging Production Capacity (K MT), Revenue (US$ Million), Price (USD/MT) and Gross Margin (2017-2022)
Table 68. Greif Main Business and Markets Served
Table 69. Greif Recent Developments/Updates
Table 70. Mauser Lubricant Packaging Corporation Information
Table 71. Mauser Specification and Application
Table 72. Mauser Lubricant Packaging Production Capacity (K MT), Revenue (US$ Million), Price (USD/MT) and Gross Margin (2017-2022)
Table 73. Mauser Main Business and Markets Served
Table 74. Mauser Recent Developments/Updates
Table 75. Scholle Lubricant Packaging Corporation Information
Table 76. Scholle Specification and Application
Table 77. Scholle Lubricant Packaging Production Capacity (K MT), Revenue (US$ Million), Price (USD/MT) and Gross Margin (2017-2022)
Table 78. Scholle Main Business and Markets Served
Table 79. Scholle Recent Developments/Updates
Table 80. CYL Lubricant Packaging Corporation Information
Table 81. CYL Specification and Application
Table 82. CYL Lubricant Packaging Production Capacity (K MT), Revenue (US$ Million), Price (USD/MT) and Gross Margin (2017-2022)
Table 83. CYL Main Business and Markets Served
Table 84. CYL Recent Developments/Updates
Table 85. Martin Operating Lubricant Packaging Corporation Information
Table 86. Martin Operating Specification and Application
Table 87. Martin Operating Lubricant Packaging Production Capacity (K MT), Revenue (US$ Million), Price (USD/MT) and Gross Margin (2017-2022)
Table 88. Martin Operating Main Business and Markets Served
Table 89. Martin Operating Recent Developments/Updates
Table 90. Universal Lubricants Lubricant Packaging Corporation Information
Table 91. Universal Lubricants Specification and Application
Table 92. Universal Lubricants Lubricant Packaging Production Capacity (K MT), Revenue (US$ Million), Price (USD/MT) and Gross Margin (2017-2022)
Table 93. Universal Lubricants Main Business and Markets Served
Table 94. Universal Lubricants Recent Developments/Updates
Table 95. Production Base and Market Concentration Rate of Raw Material
Table 96. Key Suppliers of Raw Materials
Table 97. Lubricant Packaging Distributors List
Table 98. Lubricant Packaging Customers List
Table 99. Lubricant Packaging Market Trends
Table 100. Lubricant Packaging Market Drivers
Table 101. Lubricant Packaging Market Challenges
Table 102. Lubricant Packaging Market Restraints
Table 103. Global Lubricant Packaging Production (K MT) Forecast by Region (2023-2028)
Table 104. North America Lubricant Packaging Consumption Forecast by Country (2023-2028) & (K MT)
Table 105. Europe Lubricant Packaging Consumption Forecast by Country (2023-2028) & (K MT)
Table 106. Asia Pacific Lubricant Packaging Consumption Forecast by Region (2023-2028) & (K MT)
Table 107. Latin America Lubricant Packaging Consumption Forecast by Country (2023-2028) & (K MT)
Table 108. Global Lubricant Packaging Production Forecast by Type (2023-2028) & (K MT)
Table 109. Global Lubricant Packaging Revenue Forecast by Type (2023-2028) & (US$ Million)
Table 110. Global Lubricant Packaging Price Forecast by Type (2023-2028) & (USD/MT)
Table 111. Global Lubricant Packaging Production Forecast by Application (2023-2028) & (K MT)
Table 112. Global Lubricant Packaging Revenue Forecast by Application (2023-2028) & (US$ Million)
Table 113. Global Lubricant Packaging Price Forecast by Application (2023-2028) & (USD/MT)
Table 114. Research Programs/Design for This Report
Table 115. Key Data Information from Secondary Sources
Table 116. Key Data Information from Primary Sources
List of Figures
Figure 1. Product Picture of Lubricant Packaging
Figure 2. Global Lubricant Packaging Market Share by Type: 2022 VS 2028
Figure 3. Stand-up Pouches Product Picture
Figure 4. Bottles Product Picture
Figure 5. Drums Product Picture
Figure 6. Pails Product Picture
Figure 7. Cans Product Picture
Figure 8. Tubes Product Picture
Figure 9. Kegs Product Picture
Figure 10. Bag-in-box Product Picture
Figure 11. IBC Product Picture
Figure 12. Global Lubricant Packaging Market Share by Application: 2022 VS 2028
Figure 13. Automotive
Figure 14. Metal working
Figure 15. Oil & Gas
Figure 16. Power Generation
Figure 17. Machine
Figure 18. Industrial
Figure 19. Chemicals
Figure 20. Others
Figure 21. Global Lubricant Packaging Revenue (US$ Million), 2017 VS 2021 VS 2028
Figure 22. Global Lubricant Packaging Revenue (US$ Million) (2017-2028)
Figure 23. Global Lubricant Packaging Production Capacity (K MT) & (2017-2028)
Figure 24. Global Lubricant Packaging Production (K MT) & (2017-2028)
Figure 25. North America Lubricant Packaging Revenue (US$ Million) and Growth Rate (2017-2028)
Figure 26. Europe Lubricant Packaging Revenue (US$ Million) and Growth Rate (2017-2028)
Figure 27. China Lubricant Packaging Revenue (US$ Million) and Growth Rate (2017-2028)
Figure 28. Japan Lubricant Packaging Revenue (US$ Million) and Growth Rate (2017-2028)
Figure 29. Lubricant Packaging Production Share by Manufacturers in 2021
Figure 30. Global Lubricant Packaging Revenue Share by Manufacturers in 2021
Figure 31. Lubricant Packaging Market Share by Company Type (Tier 1, Tier 2 and Tier 3): 2017 VS 2021
Figure 32. Global Market Lubricant Packaging Average Price (USD/MT) of Key Manufacturers in 2021
Figure 33. The Global 5 and 10 Largest Players: Market Share by Lubricant Packaging Revenue in 2021
Figure 34. Global Lubricant Packaging Production Market Share by Region (2017-2022)
Figure 35. North America Lubricant Packaging Production (K MT) Growth Rate (2017-2022)
Figure 36. Europe Lubricant Packaging Production (K MT) Growth Rate (2017-2022)
Figure 37. China Lubricant Packaging Production (K MT) Growth Rate (2017-2022)
Figure 38. Japan Lubricant Packaging Production (K MT) Growth Rate (2017-2022)
Figure 39. Global Lubricant Packaging Consumption Market Share by Region (2017-2022)
Figure 40. North America Lubricant Packaging Consumption and Growth Rate (2017-2022) & (K MT)
Figure 41. North America Lubricant Packaging Consumption Market Share by Country in 2021
Figure 42. Canada Lubricant Packaging Consumption Growth Rate (2017-2022) & (K MT)
Figure 43. U.S. Lubricant Packaging Consumption Growth Rate (2017-2022) & (K MT)
Figure 44. Europe Lubricant Packaging Consumption Growth Rate (2017-2022) & (K MT)
Figure 45. Europe Lubricant Packaging Consumption Market Share by Country in 2021
Figure 46. Germany Lubricant Packaging Consumption and Growth Rate (2017-2022) & (K MT)
Figure 47. France Lubricant Packaging Consumption and Growth Rate (2017-2022) & (K MT)
Figure 48. U.K. Lubricant Packaging Consumption and Growth Rate (2017-2022) & (K MT)
Figure 49. Italy Lubricant Packaging Consumption and Growth Rate (2017-2022) & (K MT)
Figure 50. Russia Lubricant Packaging Consumption and Growth Rate (2017-2022) & (K MT)
Figure 51. Asia Pacific Lubricant Packaging Consumption and Growth Rate (2017-2022) & (K MT)
Figure 52. Asia Pacific Lubricant Packaging Consumption Market Share by Regions in 2021
Figure 53. China Lubricant Packaging Consumption and Growth Rate (2017-2022) & (K MT)
Figure 54. Japan Lubricant Packaging Consumption and Growth Rate (2017-2022) & (K MT)
Figure 55. South Korea Lubricant Packaging Consumption and Growth Rate (2017-2022) & (K MT)
Figure 56. China Taiwan Lubricant Packaging Consumption and Growth Rate (2017-2022) & (K MT)
Figure 57. Southeast Asia Lubricant Packaging Consumption and Growth Rate (2017-2022) & (K MT)
Figure 58. India Lubricant Packaging Consumption and Growth Rate (2017-2022) & (K MT)
Figure 59. Australia Lubricant Packaging Consumption and Growth Rate (2017-2022) & (K MT)
Figure 60. Latin America Lubricant Packaging Consumption and Growth Rate (2017-2022) & (K MT)
Figure 61. Latin America Lubricant Packaging Consumption Market Share by Country in 2021
Figure 62. Mexico Lubricant Packaging Consumption and Growth Rate (2017-2022) & (K MT)
Figure 63. Brazil Lubricant Packaging Consumption and Growth Rate (2017-2022) & (K MT)
Figure 64. Production Market Share of Lubricant Packaging by Type (2017-2022)
Figure 65. Production Market Share of Lubricant Packaging by Type in 2021
Figure 66. Revenue Share of Lubricant Packaging by Type (2017-2022)
Figure 67. Revenue Market Share of Lubricant Packaging by Type in 2021
Figure 68. Production Market Share of Lubricant Packaging by Application (2017-2022)
Figure 69. Production Market Share of Lubricant Packaging by Application in 2021
Figure 70. Revenue Share of Lubricant Packaging by Application (2017-2022)
Figure 71. Revenue Market Share of Lubricant Packaging by Application in 2021
Figure 72. Manufacturing Cost Structure of Lubricant Packaging
Figure 73. Manufacturing Process Analysis of Lubricant Packaging
Figure 74. Lubricant Packaging Industrial Chain Analysis
Figure 75. Channels of Distribution
Figure 76. Distributors Profiles
Figure 77. Global Lubricant Packaging Production Market Share Forecast by Region (2023-2028)
Figure 78. North America Lubricant Packaging Production (K MT) Growth Rate Forecast (2023-2028)
Figure 79. Europe Lubricant Packaging Production (K MT) Growth Rate Forecast (2023-2028)
Figure 80. China Lubricant Packaging Production (K MT) Growth Rate Forecast (2023-2028)
Figure 81. Japan Lubricant Packaging Production (K MT) Growth Rate Forecast (2023-2028)
Figure 82. Global Forecasted Demand Analysis of Lubricant Packaging (2017-2028) & (K MT)
Figure 83. Global Lubricant Packaging Production Market Share Forecast by Type (2023-2028)
Figure 84. Global Lubricant Packaging Revenue Market Share Forecast by Type (2023-2028)
Figure 85. Global Lubricant Packaging Production Market Share Forecast by Application (2023-2028)
Figure 86. Global Lubricant Packaging Revenue Market Share Forecast by Application (2023-2028)
Figure 87. Bottom-up and Top-down Approaches for This Report
Figure 88. Data Triangulation
$2900
$5800
HAVE A QUERY?
OUR CUSTOMER
