List of Tables
Table 1. Global Military Thermal Imaging Equipment Market Size Growth Rate by Type (US$ Million): 2021 vs 2025 vs 2032
Table 2. Key Players of Man-portable
Table 3. Key Players of Fixed Mounted
Table 4. Global Military Thermal Imaging Equipment Market Size Growth by Application (US$ Million): 2021 vs 2025 vs 2032
Table 5. Global Military Thermal Imaging Equipment Market Size by Region (US$ Million): 2021 vs 2025 vs 2032
Table 6. Global Military Thermal Imaging Equipment Market Size by Region (US$ Million), 2021–2026
Table 7. Global Military Thermal Imaging Equipment Market Share by Region (2021–2026)
Table 8. Global Military Thermal Imaging Equipment Forecasted Market Size by Region (US$ Million), 2027–2032
Table 9. Global Military Thermal Imaging Equipment Market Share by Region (2027–2032)
Table 10. Military Thermal Imaging Equipment Market Trends
Table 11. Military Thermal Imaging Equipment Market Drivers
Table 12. Military Thermal Imaging Equipment Market Challenges
Table 13. Military Thermal Imaging Equipment Market Restraints
Table 14. Global Military Thermal Imaging Equipment Revenue by Players (US$ Million), 2021–2026
Table 15. Global Military Thermal Imaging Equipment Market Share by Players (2021–2026)
Table 16. Global Top Military Thermal Imaging Equipment Players by Tier (Tier 1, Tier 2, and Tier 3), based on Military Thermal Imaging Equipment Revenue, 2025
Table 17. Ranking of Global Top Military Thermal Imaging Equipment Companies by Revenue (US$ Million) in 2025
Table 18. Global 5 Largest Players Market Share by Military Thermal Imaging Equipment Revenue (CR5 and HHI), 2021–2026
Table 19. Global Key Players of Military Thermal Imaging Equipment, Headquarters and Area Served
Table 20. Global Key Players of Military Thermal Imaging Equipment, Products and Applications
Table 21. Global Key Players of Military Thermal Imaging Equipment, Date of General Availability (GA)
Table 22. Mergers and Acquisitions, Expansion Plans
Table 23. Global Military Thermal Imaging Equipment Market Size by Type (US$ Million), 2021–2026
Table 24. Global Military Thermal Imaging Equipment Revenue Market Share by Type (2021–2026)
Table 25. Global Military Thermal Imaging Equipment Forecasted Market Size by Type (US$ Million), 2027–2032
Table 26. Global Military Thermal Imaging Equipment Revenue Market Share by Type (2027–2032)
Table 27. Global Military Thermal Imaging Equipment Market Size by Application (US$ Million), 2021–2026
Table 28. Global Military Thermal Imaging Equipment Revenue Market Share by Application (2021–2026)
Table 29. Global Military Thermal Imaging Equipment Forecasted Market Size by Application (US$ Million), 2027–2032
Table 30. Global Military Thermal Imaging Equipment Revenue Market Share by Application (2027–2032)
Table 31. North America Military Thermal Imaging Equipment Market Size Growth Rate by Country (US$ Million): 2021 vs 2025 vs 2032
Table 32. North America Military Thermal Imaging Equipment Market Size by Country (US$ Million), 2021–2026
Table 33. North America Military Thermal Imaging Equipment Market Size by Country (US$ Million), 2027–2032
Table 34. Europe Military Thermal Imaging Equipment Market Size Growth Rate by Country (US$ Million): 2021 vs 2025 vs 2032
Table 35. Europe Military Thermal Imaging Equipment Market Size by Country (US$ Million), 2021–2026
Table 36. Europe Military Thermal Imaging Equipment Market Size by Country (US$ Million), 2027–2032
Table 37. Asia-Pacific Military Thermal Imaging Equipment Market Size Growth Rate by Region (US$ Million): 2021 vs 2025 vs 2032
Table 38. Asia-Pacific Military Thermal Imaging Equipment Market Size by Region (US$ Million), 2021–2026
Table 39. Asia-Pacific Military Thermal Imaging Equipment Market Size by Region (US$ Million), 2027–2032
Table 40. Latin America Military Thermal Imaging Equipment Market Size Growth Rate by Country (US$ Million): 2021 vs 2025 vs 2032
Table 41. Latin America Military Thermal Imaging Equipment Market Size by Country (US$ Million), 2021–2026
Table 42. Latin America Military Thermal Imaging Equipment Market Size by Country (US$ Million), 2027–2032
Table 43. Middle East & Africa Military Thermal Imaging Equipment Market Size Growth Rate by Country (US$ Million): 2021 vs 2025 vs 2032
Table 44. Middle East & Africa Military Thermal Imaging Equipment Market Size by Country (US$ Million), 2021–2026
Table 45. Middle East & Africa Military Thermal Imaging Equipment Market Size by Country (US$ Million), 2027–2032
Table 46. Lockheed Martin Company Details
Table 47. Lockheed Martin Business Overview
Table 48. Lockheed Martin Military Thermal Imaging Equipment Product
Table 49. Lockheed Martin Revenue in Military Thermal Imaging Equipment Business (US$ Million), 2021–2026
Table 50. Lockheed Martin Recent Development
Table 51. FLIR Systems Company Details
Table 52. FLIR Systems Business Overview
Table 53. FLIR Systems Military Thermal Imaging Equipment Product
Table 54. FLIR Systems Revenue in Military Thermal Imaging Equipment Business (US$ Million), 2021–2026
Table 55. FLIR Systems Recent Development
Table 56. Raytheon Company Details
Table 57. Raytheon Business Overview
Table 58. Raytheon Military Thermal Imaging Equipment Product
Table 59. Raytheon Revenue in Military Thermal Imaging Equipment Business (US$ Million), 2021–2026
Table 60. Raytheon Recent Development
Table 61. L3 Technologies Company Details
Table 62. L3 Technologies Business Overview
Table 63. L3 Technologies Military Thermal Imaging Equipment Product
Table 64. L3 Technologies Revenue in Military Thermal Imaging Equipment Business (US$ Million), 2021–2026
Table 65. L3 Technologies Recent Development
Table 66. Leonardo DRS Company Details
Table 67. Leonardo DRS Business Overview
Table 68. Leonardo DRS Military Thermal Imaging Equipment Product
Table 69. Leonardo DRS Revenue in Military Thermal Imaging Equipment Business (US$ Million), 2021–2026
Table 70. Leonardo DRS Recent Development
Table 71. Teledyne Technologies Company Details
Table 72. Teledyne Technologies Business Overview
Table 73. Teledyne Technologies Military Thermal Imaging Equipment Product
Table 74. Teledyne Technologies Revenue in Military Thermal Imaging Equipment Business (US$ Million), 2021–2026
Table 75. Teledyne Technologies Recent Development
Table 76. Sofradir Company Details
Table 77. Sofradir Business Overview
Table 78. Sofradir Military Thermal Imaging Equipment Product
Table 79. Sofradir Revenue in Military Thermal Imaging Equipment Business (US$ Million), 2021–2026
Table 80. Sofradir Recent Development
Table 81. BAE Systems Company Details
Table 82. BAE Systems Business Overview
Table 83. BAE Systems Military Thermal Imaging Equipment Product
Table 84. BAE Systems Revenue in Military Thermal Imaging Equipment Business (US$ Million), 2021–2026
Table 85. BAE Systems Recent Development
Table 86. Northrop Grumman Company Details
Table 87. Northrop Grumman Business Overview
Table 88. Northrop Grumman Military Thermal Imaging Equipment Product
Table 89. Northrop Grumman Revenue in Military Thermal Imaging Equipment Business (US$ Million), 2021–2026
Table 90. Northrop Grumman Recent Development
Table 91. Harris Company Details
Table 92. Harris Business Overview
Table 93. Harris Military Thermal Imaging Equipment Product
Table 94. Harris Revenue in Military Thermal Imaging Equipment Business (US$ Million), 2021–2026
Table 95. Harris Recent Development
Table 96. Elbit Systems Company Details
Table 97. Elbit Systems Business Overview
Table 98. Elbit Systems Military Thermal Imaging Equipment Product
Table 99. Elbit Systems Revenue in Military Thermal Imaging Equipment Business (US$ Million), 2021–2026
Table 100. Elbit Systems Recent Development
Table 101. General Dynamics Mission Systems Company Details
Table 102. General Dynamics Mission Systems Business Overview
Table 103. General Dynamics Mission Systems Military Thermal Imaging Equipment Product
Table 104. General Dynamics Mission Systems Revenue in Military Thermal Imaging Equipment Business (US$ Million), 2021–2026
Table 105. General Dynamics Mission Systems Recent Development
Table 106. Guangzhou SAT Company Details
Table 107. Guangzhou SAT Business Overview
Table 108. Guangzhou SAT Military Thermal Imaging Equipment Product
Table 109. Guangzhou SAT Revenue in Military Thermal Imaging Equipment Business (US$ Million), 2021–2026
Table 110. Guangzhou SAT Recent Development
Table 111. Wuhan Guide Infrared Company Details
Table 112. Wuhan Guide Infrared Business Overview
Table 113. Wuhan Guide Infrared Military Thermal Imaging Equipment Product
Table 114. Wuhan Guide Infrared Revenue in Military Thermal Imaging Equipment Business (US$ Million), 2021–2026
Table 115. Wuhan Guide Infrared Recent Development
Table 116. Zhejiang Dali Technology Company Details
Table 117. Zhejiang Dali Technology Business Overview
Table 118. Zhejiang Dali Technology Military Thermal Imaging Equipment Product
Table 119. Zhejiang Dali Technology Revenue in Military Thermal Imaging Equipment Business (US$ Million), 2021–2026
Table 120. Zhejiang Dali Technology Recent Development
Table 121. Axis Communications AB Company Details
Table 122. Axis Communications AB Business Overview
Table 123. Axis Communications AB Military Thermal Imaging Equipment Product
Table 124. Axis Communications AB Revenue in Military Thermal Imaging Equipment Business (US$ Million), 2021–2026
Table 125. Axis Communications AB Recent Development
Table 126. ViPRO Corporation Company Details
Table 127. ViPRO Corporation Business Overview
Table 128. ViPRO Corporation Military Thermal Imaging Equipment Product
Table 129. ViPRO Corporation Revenue in Military Thermal Imaging Equipment Business (US$ Million), 2021–2026
Table 130. ViPRO Corporation Recent Development
Table 131. Research Programs/Design for This Report
Table 132. Key Data Information from Secondary Sources
Table 133. Key Data Information from Primary Sources
Table 134. Authors List of This Report
List of Figures
Figure 1. Military Thermal Imaging Equipment Picture
Figure 2. Global Military Thermal Imaging Equipment Market Size Comparison by Type (US$ Million), 2021–2032
Figure 3. Global Military Thermal Imaging Equipment Market Share by Type: 2025 vs 2032
Figure 4. Man-portable Features
Figure 5. Fixed Mounted Features
Figure 6. Global Military Thermal Imaging Equipment Market Size by Application (US$ Million), 2021–2032
Figure 7. Global Military Thermal Imaging Equipment Market Share by Application: 2025 vs 2032
Figure 8. Land Case Studies
Figure 9. Marine Case Studies
Figure 10. Airborne Case Studies
Figure 11. Military Thermal Imaging Equipment Report Years Considered
Figure 12. Global Military Thermal Imaging Equipment Market Size (US$ Million), Year-over-Year: 2021–2032
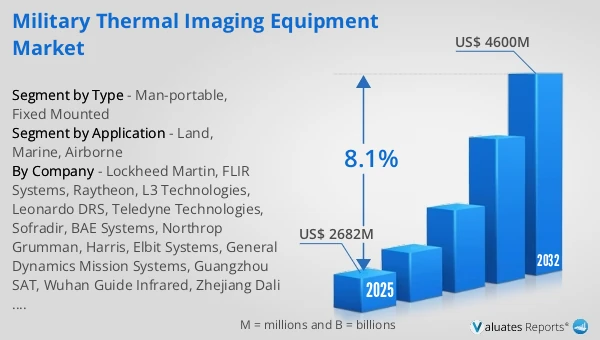
Figure 13. Global Military Thermal Imaging Equipment Market Size, (US$ Million), 2021 vs 2025 vs 2032
Figure 14. Global Military Thermal Imaging Equipment Market Share by Region: 2025 vs 2032
Figure 15. Global Military Thermal Imaging Equipment Market Share by Players in 2025
Figure 16. Global Military Thermal Imaging Equipment Market Share by Company Type (Tier 1, Tier 2, and Tier 3)
Figure 17. The Top 10 and 5 Players Market Share by Military Thermal Imaging Equipment Revenue in 2025
Figure 18. North America Military Thermal Imaging Equipment Market Size YoY Growth (US$ Million), 2021–2032
Figure 19. North America Military Thermal Imaging Equipment Market Share by Country (2021–2032)
Figure 20. United States Military Thermal Imaging Equipment Market Size YoY Growth (US$ Million), 2021–2032
Figure 21. Canada Military Thermal Imaging Equipment Market Size YoY Growth (US$ Million), 2021–2032
Figure 22. Europe Military Thermal Imaging Equipment Market Size YoY Growth (US$ Million), 2021–2032
Figure 23. Europe Military Thermal Imaging Equipment Market Share by Country (2021–2032)
Figure 24. Germany Military Thermal Imaging Equipment Market Size YoY Growth (US$ Million), 2021–2032
Figure 25. France Military Thermal Imaging Equipment Market Size YoY Growth (US$ Million), 2021–2032
Figure 26. U.K. Military Thermal Imaging Equipment Market Size YoY Growth (US$ Million), 2021–2032
Figure 27. Italy Military Thermal Imaging Equipment Market Size YoY Growth (US$ Million), 2021–2032
Figure 28. Russia Military Thermal Imaging Equipment Market Size YoY Growth (US$ Million), 2021–2032
Figure 29. Ireland Military Thermal Imaging Equipment Market Size YoY Growth (US$ Million), 2021–2032
Figure 30. Asia-Pacific Military Thermal Imaging Equipment Market Size YoY Growth (US$ Million), 2021–2032
Figure 31. Asia-Pacific Military Thermal Imaging Equipment Market Share by Region (2021–2032)
Figure 32. China Military Thermal Imaging Equipment Market Size YoY Growth (US$ Million), 2021–2032
Figure 33. Japan Military Thermal Imaging Equipment Market Size YoY Growth (US$ Million), 2021–2032
Figure 34. South Korea Military Thermal Imaging Equipment Market Size YoY Growth (US$ Million), 2021–2032
Figure 35. Southeast Asia Military Thermal Imaging Equipment Market Size YoY Growth (US$ Million), 2021–2032
Figure 36. India Military Thermal Imaging Equipment Market Size YoY Growth (US$ Million), 2021–2032
Figure 37. Australia & New Zealand Military Thermal Imaging Equipment Market Size YoY Growth (US$ Million), 2021–2032
Figure 38. Latin America Military Thermal Imaging Equipment Market Size YoY Growth (US$ Million), 2021–2032
Figure 39. Latin America Military Thermal Imaging Equipment Market Share by Country (2021–2032)
Figure 40. Mexico Military Thermal Imaging Equipment Market Size YoY Growth (US$ Million), 2021–2032
Figure 41. Brazil Military Thermal Imaging Equipment Market Size YoY Growth (US$ Million), 2021–2032
Figure 42. Middle East & Africa Military Thermal Imaging Equipment Market Size YoY Growth (US$ Million), 2021–2032
Figure 43. Middle East & Africa Military Thermal Imaging Equipment Market Share by Country (2021–2032)
Figure 44. Israel Military Thermal Imaging Equipment Market Size YoY Growth (US$ Million), 2021–2032
Figure 45. Saudi Arabia Military Thermal Imaging Equipment Market Size YoY Growth (US$ Million), 2021–2032
Figure 46. UAE Military Thermal Imaging Equipment Market Size YoY Growth (US$ Million), 2021–2032
Figure 47. Lockheed Martin Revenue Growth Rate in Military Thermal Imaging Equipment Business (2021–2026)
Figure 48. FLIR Systems Revenue Growth Rate in Military Thermal Imaging Equipment Business (2021–2026)
Figure 49. Raytheon Revenue Growth Rate in Military Thermal Imaging Equipment Business (2021–2026)
Figure 50. L3 Technologies Revenue Growth Rate in Military Thermal Imaging Equipment Business (2021–2026)
Figure 51. Leonardo DRS Revenue Growth Rate in Military Thermal Imaging Equipment Business (2021–2026)
Figure 52. Teledyne Technologies Revenue Growth Rate in Military Thermal Imaging Equipment Business (2021–2026)
Figure 53. Sofradir Revenue Growth Rate in Military Thermal Imaging Equipment Business (2021–2026)
Figure 54. BAE Systems Revenue Growth Rate in Military Thermal Imaging Equipment Business (2021–2026)
Figure 55. Northrop Grumman Revenue Growth Rate in Military Thermal Imaging Equipment Business (2021–2026)
Figure 56. Harris Revenue Growth Rate in Military Thermal Imaging Equipment Business (2021–2026)
Figure 57. Elbit Systems Revenue Growth Rate in Military Thermal Imaging Equipment Business (2021–2026)
Figure 58. General Dynamics Mission Systems Revenue Growth Rate in Military Thermal Imaging Equipment Business (2021–2026)
Figure 59. Guangzhou SAT Revenue Growth Rate in Military Thermal Imaging Equipment Business (2021–2026)
Figure 60. Wuhan Guide Infrared Revenue Growth Rate in Military Thermal Imaging Equipment Business (2021–2026)
Figure 61. Zhejiang Dali Technology Revenue Growth Rate in Military Thermal Imaging Equipment Business (2021–2026)
Figure 62. Axis Communications AB Revenue Growth Rate in Military Thermal Imaging Equipment Business (2021–2026)
Figure 63. ViPRO Corporation Revenue Growth Rate in Military Thermal Imaging Equipment Business (2021–2026)
Figure 64. Bottom-up and Top-down Approaches for This Report
Figure 65. Data Triangulation
Figure 66. Key Executives Interviewed