0
U.S. (TOLL FREE)
+1 (315) 215-3225
Automative

0
U.S. (TOLL FREE)
+1 (315) 215-3225
Global IV Drip Therapy Market Research Report 2026
Published Date: 2026-01-15
|
Report Code: QYRE-Auto-25B18788
Home | Market Reports | Health| Nursing
Global IV Drip Therapy Market Research Report 2025
BUY CHAPTERS

Global IV Drip Therapy Market Research Report 2026

Code: QYRE-Auto-25B18788
Report
2026-01-15
Pages:165
QYResearch
Buy Now with 15% Discount
DESCRIPTION
TABLE OF CONTENT
TABLES & FIGURES

IV Drip Therapy Market Size

The global IV Drip Therapy market was valued at US$ 3629 million in 2025 and is anticipated to reach US$ 5533 million by 2032, at a CAGR of 6.3% from 2026 to 2032.

IV Drip Therapy Market

IV Drip Therapy Market

IV Drip Therapy, also known as intravenous therapy, is a medical procedure where fluids, medications, nutrients, or blood products are administered directly into a patient's vein. This method offers a rapid and efficient way to deliver substances into the bloodstream, bypassing the digestive system. In medical settings, it's crucial for treating a wide range of conditions. For example, in cases of severe dehydration, fluids like normal saline or lactated Ringer's are infused to restore the body's fluid balance. It's also used to administer antibiotics for serious infections, chemotherapy drugs for cancer treatment, and pain relievers for post - surgical or trauma - related pain. In the wellness realm, it has gained popularity among athletes for quick rehydration and recovery, and in aesthetics for skin - enhancing and anti - aging purposes. IV Drip Therapy is a versatile tool that plays a significant role in both medical treatment and maintaining overall well - being.
The IV drip therapy industry chain is structured into upstream supply, midstream manufacturing & service integration, downstream delivery & end - users, and supporting infrastructure (logistics, regulation, tech).
The upstream supplies the foundational inputs for IV products and solutions, with high concentration among top suppliers. The midstream is the core value-adding layer, covering product manufacturing and service bundling, split into two sub - segments. End - users drive demand, while channels determine accessibility and pricing power.
This report delivers a comprehensive overview of the global IV Drip Therapy market, with both quantitative and qualitative analyses, to help readers develop growth strategies, assess the competitive landscape, evaluate their position in the current market, and make informed business decisions regarding IV Drip Therapy. The IV Drip Therapy market size, estimates, and forecasts are provided in terms of revenue (US$ millions), with 2025 as the base year and historical and forecast data for 2021–2032.
The report segments the global IV Drip Therapy market comprehensively. Regional market sizes by Type, by Application, by Route of Administration, and by player are also provided. For deeper insight, the report profiles the competitive landscape, key competitors, and their respective market rankings, and discusses technological trends and new product developments.
This report will assist IV Drip Therapy manufacturers, new entrants, and companies across the industry value chain with information on revenues, sales volume, and average prices for the overall market and its sub-segments, by company, by Type, by Application, and by region.
Market Segmentation

Scope of IV Drip Therapy Market Report

Report Metric Details
Report Name IV Drip Therapy Market
Accounted market size in 2025 US$ 3629 million
Forecasted market size in 2032 US$ 5533 million
CAGR 6.3%
Base Year 2025
Forecasted years 2026 - 2032
Segment by Type
  • lmmune Boosters
  • Energy Boosters
  • Skin Care
  • Migraine
  • Others
Segment by Route of Administration
  • Peripheral Intravenous (PIV) Therapy
  • Central Venous (CV) Therapy
  • Intraosseous (IO) Therapy
Segment by Regulatory
  • Prescription-Only IV Therapy
  • Over-the-Counter (OTC) Wellness IV Therapy
Segment by Application
  • Medical Applications
  • Outpatient Clinics
  • Wellness Applications
  • Others
By Region
  • North America (United States, Canada)
  • Europe (Germany, France, UK, Italy, Russia) Rest of Europe
  • Nordic Countries
  • Asia-Pacific (China, Japan, South Korea)
  • Southeast Asia (India, Australia)
  • Rest of Asia
  • Latin America (Mexico, Brazil)
  • Rest of Latin America
  • Middle East & Africa (Turkey, Saudi Arabia, UAE, Rest of MEA)
By Company REVIV, Get A Drip, Drip Boost, IntraVita, Drip Hydration, NutriZen IV, The Wellness Co., IV Doc, IV Zeal, DRIPBaR, Hydrate IV Bar, Prime IV, Liquivida, Mobile IV Medics, IV Vitamin Therapy Clinic, iV Bars, The IV Bar, Reset iV, NutriDrip, Glow Wellness, True Health DPC, Dynamic Drips, Flow IV, sk:n, Infusion IV, Hydrelief, BFLO Hydration, Onus IV, Thrive Solutions, Wellness IV Infusion Therapy
Forecast units USD million in value
Report coverage Revenue and volume forecast, company share, competitive landscape, growth factors and trends

Chapter Outline

  • Chapter 1: Defines the scope of the report and presents an executive summary of market segments (by Type, by Application, by Route of Administration, etc.), including the size of each segment and its future growth potential. It offers a high-level view of the current market and its likely evolution in the short, medium, and long term.
  • Chapter 2: Summarizes global and regional market size and outlines market dynamics and recent developments, including key drivers, restraints, challenges and risks for industry participants, and relevant policy analysis.
  • Chapter 3: Provides a detailed view of the competitive landscape for IV Drip Therapy companies, covering revenue share, development plans, and mergers and acquisitions.
  • Chapter 4: Analyzes segments by Type, detailing the size and growth potential of each segment to help readers identify blue-ocean opportunities.
  • Chapter 5: Analyzes segments by Application, detailing the size and growth potential of each downstream segment to help readers identify blue-ocean opportunities.
  • Chapter 6–10: Regional deep dives (North America, Europe, Asia Pacific, Latin America, Middle East & Africa) broken down by country. Each chapter quantifies market size and growth potential by region and key countries, and outlines market development, outlook, addressable space, and capacity.
  • Chapter 11: Profiles key players, presenting essential information on leading companies, including product/ service offerings, revenue, gross margin, product introductions/portfolios, recent developments, etc.
  • Chapter 12: Key findings and conclusions of the report.

FAQ for this report

How fast is IV Drip Therapy Market growing?

Ans: The IV Drip Therapy Market witnessing a CAGR of 6.3% during the forecast period 2026-2032.

What is the IV Drip Therapy Market size in 2032?

Ans: The IV Drip Therapy Market size in 2032 will be US$ 5533 million.

Who are the main players in the IV Drip Therapy Market report?

Ans: The main players in the IV Drip Therapy Market are REVIV, Get A Drip, Drip Boost, IntraVita, Drip Hydration, NutriZen IV, The Wellness Co., IV Doc, IV Zeal, DRIPBaR, Hydrate IV Bar, Prime IV, Liquivida, Mobile IV Medics, IV Vitamin Therapy Clinic, iV Bars, The IV Bar, Reset iV, NutriDrip, Glow Wellness, True Health DPC, Dynamic Drips, Flow IV, sk:n, Infusion IV, Hydrelief, BFLO Hydration, Onus IV, Thrive Solutions, Wellness IV Infusion Therapy

What are the Application segmentation covered in the IV Drip Therapy Market report?

Ans: The Applications covered in the IV Drip Therapy Market report are Medical Applications, Outpatient Clinics, Wellness Applications, Others

What are the Type segmentation covered in the IV Drip Therapy Market report?

Ans: The Types covered in the IV Drip Therapy Market report are lmmune Boosters, Energy Boosters, Skin Care, Migraine, Others

1 Report Overview
1.1 Study Scope
1.2 Market Analysis by Type
1.2.1 Global IV Drip Therapy Market Size Growth Rate by Type: 2021 vs 2025 vs 2032
1.2.2 lmmune Boosters
1.2.3 Energy Boosters
1.2.4 Skin Care
1.2.5 Migraine
1.2.6 Others
1.3 Market by Route of Administration
1.3.1 Global IV Drip Therapy Market Size Growth Rate by Route of Administration: 2021 vs 2025 vs 2032
1.3.2 Peripheral Intravenous (PIV) Therapy
1.3.3 Central Venous (CV) Therapy
1.3.4 Intraosseous (IO) Therapy
1.4 Market by Regulatory
1.4.1 Global IV Drip Therapy Market Size Growth Rate by Regulatory: 2021 vs 2025 vs 2032
1.4.2 Prescription-Only IV Therapy
1.4.3 Over-the-Counter (OTC) Wellness IV Therapy
1.5 Market by Application
1.5.1 Global IV Drip Therapy Market Growth by Application: 2021 vs 2025 vs 2032
1.5.2 Medical Applications
1.5.3 Outpatient Clinics
1.5.4 Wellness Applications
1.5.5 Others
1.6 Assumptions and Limitations
1.7 Study Objectives
1.8 Years Considered
2 Global Growth Trends
2.1 Global IV Drip Therapy Market Perspective (2021–2032)
2.2 Global IV Drip Therapy Growth Trends by Region
2.2.1 Global IV Drip Therapy Market Size by Region: 2021 vs 2025 vs 2032
2.2.2 IV Drip Therapy Historic Market Size by Region (2021–2026)
2.2.3 IV Drip Therapy Forecasted Market Size by Region (2027–2032)
2.3 IV Drip Therapy Market Dynamics
2.3.1 IV Drip Therapy Industry Trends
2.3.2 IV Drip Therapy Market Drivers
2.3.3 IV Drip Therapy Market Challenges
2.3.4 IV Drip Therapy Market Restraints
3 Competition Landscape by Key Players
3.1 Global Top IV Drip Therapy Players by Revenue
3.1.1 Global Top IV Drip Therapy Players by Revenue (2021–2026)
3.1.2 Global IV Drip Therapy Revenue Market Share by Players (2021–2026)
3.2 Global Top IV Drip Therapy Players Market Share by Company Tier (Tier 1, Tier 2, Tier 3)
3.3 Global Key Players Ranking by IV Drip Therapy Revenue
3.4 Global IV Drip Therapy Market Concentration Ratio
3.4.1 Global IV Drip Therapy Market Concentration Ratio (CR5 and HHI)
3.4.2 Global Top 10 and Top 5 Companies by IV Drip Therapy Revenue in 2025
3.5 Global Key Players of IV Drip Therapy Head Offices and Areas Served
3.6 Global Key Players of IV Drip Therapy, Products and Applications
3.7 Global Key Players of IV Drip Therapy, Date of General Availability (GA)
3.8 Mergers and Acquisitions, Expansion Plans
4 IV Drip Therapy Breakdown Data by Type
4.1 Global IV Drip Therapy Historic Market Size by Type (2021–2026)
4.2 Global IV Drip Therapy Forecasted Market Size by Type (2027–2032)
5 IV Drip Therapy Breakdown Data by Application
5.1 Global IV Drip Therapy Historic Market Size by Application (2021–2026)
5.2 Global IV Drip Therapy Forecasted Market Size by Application (2027–2032)
6 North America
6.1 North America IV Drip Therapy Market Size (2021–2032)
6.2 North America IV Drip Therapy Market Growth Rate by Country: 2021 vs 2025 vs 2032
6.3 North America IV Drip Therapy Market Size by Country (2021–2026)
6.4 North America IV Drip Therapy Market Size by Country (2027–2032)
6.5 United States
6.6 Canada
7 Europe
7.1 Europe IV Drip Therapy Market Size (2021–2032)
7.2 Europe IV Drip Therapy Market Growth Rate by Country: 2021 vs 2025 vs 2032
7.3 Europe IV Drip Therapy Market Size by Country (2021–2026)
7.4 Europe IV Drip Therapy Market Size by Country (2027–2032)
7.5 Germany
7.6 France
7.7 U.K.
7.8 Italy
7.9 Russia
7.10 Ireland
8 Asia-Pacific
8.1 Asia-Pacific IV Drip Therapy Market Size (2021–2032)
8.2 Asia-Pacific IV Drip Therapy Market Growth Rate by Region: 2021 vs 2025 vs 2032
8.3 Asia-Pacific IV Drip Therapy Market Size by Region (2021–2026)
8.4 Asia-Pacific IV Drip Therapy Market Size by Region (2027–2032)
8.5 China
8.6 Japan
8.7 South Korea
8.8 Southeast Asia
8.9 India
8.10 Australia & New Zealand
9 Latin America
9.1 Latin America IV Drip Therapy Market Size (2021–2032)
9.2 Latin America IV Drip Therapy Market Growth Rate by Country: 2021 vs 2025 vs 2032
9.3 Latin America IV Drip Therapy Market Size by Country (2021–2026)
9.4 Latin America IV Drip Therapy Market Size by Country (2027–2032)
9.5 Mexico
9.6 Brazil
10 Middle East & Africa
10.1 Middle East & Africa IV Drip Therapy Market Size (2021–2032)
10.2 Middle East & Africa IV Drip Therapy Market Growth Rate by Country: 2021 vs 2025 vs 2032
10.3 Middle East & Africa IV Drip Therapy Market Size by Country (2021–2026)
10.4 Middle East & Africa IV Drip Therapy Market Size by Country (2027–2032)
10.5 Israel
10.6 Saudi Arabia
10.7 UAE
11 Key Players Profiles
11.1 REVIV
11.1.1 REVIV Company Details
11.1.2 REVIV Business Overview
11.1.3 REVIV IV Drip Therapy Introduction
11.1.4 REVIV Revenue in IV Drip Therapy Business (2021–2026)
11.1.5 REVIV Recent Development
11.2 Get A Drip
11.2.1 Get A Drip Company Details
11.2.2 Get A Drip Business Overview
11.2.3 Get A Drip IV Drip Therapy Introduction
11.2.4 Get A Drip Revenue in IV Drip Therapy Business (2021–2026)
11.2.5 Get A Drip Recent Development
11.3 Drip Boost
11.3.1 Drip Boost Company Details
11.3.2 Drip Boost Business Overview
11.3.3 Drip Boost IV Drip Therapy Introduction
11.3.4 Drip Boost Revenue in IV Drip Therapy Business (2021–2026)
11.3.5 Drip Boost Recent Development
11.4 IntraVita
11.4.1 IntraVita Company Details
11.4.2 IntraVita Business Overview
11.4.3 IntraVita IV Drip Therapy Introduction
11.4.4 IntraVita Revenue in IV Drip Therapy Business (2021–2026)
11.4.5 IntraVita Recent Development
11.5 Drip Hydration
11.5.1 Drip Hydration Company Details
11.5.2 Drip Hydration Business Overview
11.5.3 Drip Hydration IV Drip Therapy Introduction
11.5.4 Drip Hydration Revenue in IV Drip Therapy Business (2021–2026)
11.5.5 Drip Hydration Recent Development
11.6 NutriZen IV
11.6.1 NutriZen IV Company Details
11.6.2 NutriZen IV Business Overview
11.6.3 NutriZen IV IV Drip Therapy Introduction
11.6.4 NutriZen IV Revenue in IV Drip Therapy Business (2021–2026)
11.6.5 NutriZen IV Recent Development
11.7 The Wellness Co.
11.7.1 The Wellness Co. Company Details
11.7.2 The Wellness Co. Business Overview
11.7.3 The Wellness Co. IV Drip Therapy Introduction
11.7.4 The Wellness Co. Revenue in IV Drip Therapy Business (2021–2026)
11.7.5 The Wellness Co. Recent Development
11.8 IV Doc
11.8.1 IV Doc Company Details
11.8.2 IV Doc Business Overview
11.8.3 IV Doc IV Drip Therapy Introduction
11.8.4 IV Doc Revenue in IV Drip Therapy Business (2021–2026)
11.8.5 IV Doc Recent Development
11.9 IV Zeal
11.9.1 IV Zeal Company Details
11.9.2 IV Zeal Business Overview
11.9.3 IV Zeal IV Drip Therapy Introduction
11.9.4 IV Zeal Revenue in IV Drip Therapy Business (2021–2026)
11.9.5 IV Zeal Recent Development
11.10 DRIPBaR
11.10.1 DRIPBaR Company Details
11.10.2 DRIPBaR Business Overview
11.10.3 DRIPBaR IV Drip Therapy Introduction
11.10.4 DRIPBaR Revenue in IV Drip Therapy Business (2021–2026)
11.10.5 DRIPBaR Recent Development
11.11 Hydrate IV Bar
11.11.1 Hydrate IV Bar Company Details
11.11.2 Hydrate IV Bar Business Overview
11.11.3 Hydrate IV Bar IV Drip Therapy Introduction
11.11.4 Hydrate IV Bar Revenue in IV Drip Therapy Business (2021–2026)
11.11.5 Hydrate IV Bar Recent Development
11.12 Prime IV
11.12.1 Prime IV Company Details
11.12.2 Prime IV Business Overview
11.12.3 Prime IV IV Drip Therapy Introduction
11.12.4 Prime IV Revenue in IV Drip Therapy Business (2021–2026)
11.12.5 Prime IV Recent Development
11.13 Liquivida
11.13.1 Liquivida Company Details
11.13.2 Liquivida Business Overview
11.13.3 Liquivida IV Drip Therapy Introduction
11.13.4 Liquivida Revenue in IV Drip Therapy Business (2021–2026)
11.13.5 Liquivida Recent Development
11.14 Mobile IV Medics
11.14.1 Mobile IV Medics Company Details
11.14.2 Mobile IV Medics Business Overview
11.14.3 Mobile IV Medics IV Drip Therapy Introduction
11.14.4 Mobile IV Medics Revenue in IV Drip Therapy Business (2021–2026)
11.14.5 Mobile IV Medics Recent Development
11.15 IV Vitamin Therapy Clinic
11.15.1 IV Vitamin Therapy Clinic Company Details
11.15.2 IV Vitamin Therapy Clinic Business Overview
11.15.3 IV Vitamin Therapy Clinic IV Drip Therapy Introduction
11.15.4 IV Vitamin Therapy Clinic Revenue in IV Drip Therapy Business (2021–2026)
11.15.5 IV Vitamin Therapy Clinic Recent Development
11.16 iV Bars
11.16.1 iV Bars Company Details
11.16.2 iV Bars Business Overview
11.16.3 iV Bars IV Drip Therapy Introduction
11.16.4 iV Bars Revenue in IV Drip Therapy Business (2021–2026)
11.16.5 iV Bars Recent Development
11.17 The IV Bar
11.17.1 The IV Bar Company Details
11.17.2 The IV Bar Business Overview
11.17.3 The IV Bar IV Drip Therapy Introduction
11.17.4 The IV Bar Revenue in IV Drip Therapy Business (2021–2026)
11.17.5 The IV Bar Recent Development
11.18 Reset iV
11.18.1 Reset iV Company Details
11.18.2 Reset iV Business Overview
11.18.3 Reset iV IV Drip Therapy Introduction
11.18.4 Reset iV Revenue in IV Drip Therapy Business (2021–2026)
11.18.5 Reset iV Recent Development
11.19 NutriDrip
11.19.1 NutriDrip Company Details
11.19.2 NutriDrip Business Overview
11.19.3 NutriDrip IV Drip Therapy Introduction
11.19.4 NutriDrip Revenue in IV Drip Therapy Business (2021–2026)
11.19.5 NutriDrip Recent Development
11.20 Glow Wellness
11.20.1 Glow Wellness Company Details
11.20.2 Glow Wellness Business Overview
11.20.3 Glow Wellness IV Drip Therapy Introduction
11.20.4 Glow Wellness Revenue in IV Drip Therapy Business (2021–2026)
11.20.5 Glow Wellness Recent Development
11.21 True Health DPC
11.21.1 True Health DPC Company Details
11.21.2 True Health DPC Business Overview
11.21.3 True Health DPC IV Drip Therapy Introduction
11.21.4 True Health DPC Revenue in IV Drip Therapy Business (2021–2026)
11.21.5 True Health DPC Recent Development
11.22 Dynamic Drips
11.22.1 Dynamic Drips Company Details
11.22.2 Dynamic Drips Business Overview
11.22.3 Dynamic Drips IV Drip Therapy Introduction
11.22.4 Dynamic Drips Revenue in IV Drip Therapy Business (2021–2026)
11.22.5 Dynamic Drips Recent Development
11.23 Flow IV
11.23.1 Flow IV Company Details
11.23.2 Flow IV Business Overview
11.23.3 Flow IV IV Drip Therapy Introduction
11.23.4 Flow IV Revenue in IV Drip Therapy Business (2021–2026)
11.23.5 Flow IV Recent Development
11.24 sk:n
11.24.1 sk:n Company Details
11.24.2 sk:n Business Overview
11.24.3 sk:n IV Drip Therapy Introduction
11.24.4 sk:n Revenue in IV Drip Therapy Business (2021–2026)
11.24.5 sk:n Recent Development
11.25 Infusion IV
11.25.1 Infusion IV Company Details
11.25.2 Infusion IV Business Overview
11.25.3 Infusion IV IV Drip Therapy Introduction
11.25.4 Infusion IV Revenue in IV Drip Therapy Business (2021–2026)
11.25.5 Infusion IV Recent Development
11.26 Hydrelief
11.26.1 Hydrelief Company Details
11.26.2 Hydrelief Business Overview
11.26.3 Hydrelief IV Drip Therapy Introduction
11.26.4 Hydrelief Revenue in IV Drip Therapy Business (2021–2026)
11.26.5 Hydrelief Recent Development
11.27 BFLO Hydration
11.27.1 BFLO Hydration Company Details
11.27.2 BFLO Hydration Business Overview
11.27.3 BFLO Hydration IV Drip Therapy Introduction
11.27.4 BFLO Hydration Revenue in IV Drip Therapy Business (2021–2026)
11.27.5 BFLO Hydration Recent Development
11.28 Onus IV
11.28.1 Onus IV Company Details
11.28.2 Onus IV Business Overview
11.28.3 Onus IV IV Drip Therapy Introduction
11.28.4 Onus IV Revenue in IV Drip Therapy Business (2021–2026)
11.28.5 Onus IV Recent Development
11.29 Thrive Solutions
11.29.1 Thrive Solutions Company Details
11.29.2 Thrive Solutions Business Overview
11.29.3 Thrive Solutions IV Drip Therapy Introduction
11.29.4 Thrive Solutions Revenue in IV Drip Therapy Business (2021–2026)
11.29.5 Thrive Solutions Recent Development
11.30 Wellness IV Infusion Therapy
11.30.1 Wellness IV Infusion Therapy Company Details
11.30.2 Wellness IV Infusion Therapy Business Overview
11.30.3 Wellness IV Infusion Therapy IV Drip Therapy Introduction
11.30.4 Wellness IV Infusion Therapy Revenue in IV Drip Therapy Business (2021–2026)
11.30.5 Wellness IV Infusion Therapy Recent Development
12 Analyst's Viewpoints/Conclusions
13 Appendix
13.1 Research Methodology
13.1.1 Methodology/Research Approach
13.1.1.1 Research Programs/Design
13.1.1.2 Market Size Estimation
13.1.1.3 Market Breakdown and Data Triangulation
13.1.2 Data Source
13.1.2.1 Secondary Sources
13.1.2.2 Primary Sources
13.2 Author Details
13.3 Disclaimer
List of Tables
 Table 1. Global IV Drip Therapy Market Size Growth Rate by Type (US$ Million): 2021 vs 2025 vs 2032
 Table 2. Key Players of lmmune Boosters
 Table 3. Key Players of Energy Boosters
 Table 4. Key Players of Skin Care
 Table 5. Key Players of Migraine
 Table 6. Key Players of Others
 Table 7. Global IV Drip Therapy Market Size Growth Rate by Route of Administration (US$ Million): 2021 vs 2025 vs 2032
 Table 8. Key Players of Peripheral Intravenous (PIV) Therapy
 Table 9. Key Players of Central Venous (CV) Therapy
 Table 10. Key Players of Intraosseous (IO) Therapy
 Table 11. Global IV Drip Therapy Market Size Growth Rate by Regulatory (US$ Million): 2021 vs 2025 vs 2032
 Table 12. Key Players of Prescription-Only IV Therapy
 Table 13. Key Players of Over-the-Counter (OTC) Wellness IV Therapy
 Table 14. Global IV Drip Therapy Market Size Growth by Application (US$ Million): 2021 vs 2025 vs 2032
 Table 15. Global IV Drip Therapy Market Size by Region (US$ Million): 2021 vs 2025 vs 2032
 Table 16. Global IV Drip Therapy Market Size by Region (US$ Million), 2021–2026
 Table 17. Global IV Drip Therapy Market Share by Region (2021–2026)
 Table 18. Global IV Drip Therapy Forecasted Market Size by Region (US$ Million), 2027–2032
 Table 19. Global IV Drip Therapy Market Share by Region (2027–2032)
 Table 20. IV Drip Therapy Market Trends
 Table 21. IV Drip Therapy Market Drivers
 Table 22. IV Drip Therapy Market Challenges
 Table 23. IV Drip Therapy Market Restraints
 Table 24. Global IV Drip Therapy Revenue by Players (US$ Million), 2021–2026
 Table 25. Global IV Drip Therapy Market Share by Players (2021–2026)
 Table 26. Global Top IV Drip Therapy Players by Tier (Tier 1, Tier 2, and Tier 3), based on IV Drip Therapy Revenue, 2025
 Table 27. Ranking of Global Top IV Drip Therapy Companies by Revenue (US$ Million) in 2025
 Table 28. Global 5 Largest Players Market Share by IV Drip Therapy Revenue (CR5 and HHI), 2021–2026
 Table 29. Global Key Players of IV Drip Therapy, Headquarters and Area Served
 Table 30. Global Key Players of IV Drip Therapy, Products and Applications
 Table 31. Global Key Players of IV Drip Therapy, Date of General Availability (GA)
 Table 32. Mergers and Acquisitions, Expansion Plans
 Table 33. Global IV Drip Therapy Market Size by Type (US$ Million), 2021–2026
 Table 34. Global IV Drip Therapy Revenue Market Share by Type (2021–2026)
 Table 35. Global IV Drip Therapy Forecasted Market Size by Type (US$ Million), 2027–2032
 Table 36. Global IV Drip Therapy Revenue Market Share by Type (2027–2032)
 Table 37. Global IV Drip Therapy Market Size by Application (US$ Million), 2021–2026
 Table 38. Global IV Drip Therapy Revenue Market Share by Application (2021–2026)
 Table 39. Global IV Drip Therapy Forecasted Market Size by Application (US$ Million), 2027–2032
 Table 40. Global IV Drip Therapy Revenue Market Share by Application (2027–2032)
 Table 41. North America IV Drip Therapy Market Size Growth Rate by Country (US$ Million): 2021 vs 2025 vs 2032
 Table 42. North America IV Drip Therapy Market Size by Country (US$ Million), 2021–2026
 Table 43. North America IV Drip Therapy Market Size by Country (US$ Million), 2027–2032
 Table 44. Europe IV Drip Therapy Market Size Growth Rate by Country (US$ Million): 2021 vs 2025 vs 2032
 Table 45. Europe IV Drip Therapy Market Size by Country (US$ Million), 2021–2026
 Table 46. Europe IV Drip Therapy Market Size by Country (US$ Million), 2027–2032
 Table 47. Asia-Pacific IV Drip Therapy Market Size Growth Rate by Region (US$ Million): 2021 vs 2025 vs 2032
 Table 48. Asia-Pacific IV Drip Therapy Market Size by Region (US$ Million), 2021–2026
 Table 49. Asia-Pacific IV Drip Therapy Market Size by Region (US$ Million), 2027–2032
 Table 50. Latin America IV Drip Therapy Market Size Growth Rate by Country (US$ Million): 2021 vs 2025 vs 2032
 Table 51. Latin America IV Drip Therapy Market Size by Country (US$ Million), 2021–2026
 Table 52. Latin America IV Drip Therapy Market Size by Country (US$ Million), 2027–2032
 Table 53. Middle East & Africa IV Drip Therapy Market Size Growth Rate by Country (US$ Million): 2021 vs 2025 vs 2032
 Table 54. Middle East & Africa IV Drip Therapy Market Size by Country (US$ Million), 2021–2026
 Table 55. Middle East & Africa IV Drip Therapy Market Size by Country (US$ Million), 2027–2032
 Table 56. REVIV Company Details
 Table 57. REVIV Business Overview
 Table 58. REVIV IV Drip Therapy Product
 Table 59. REVIV Revenue in IV Drip Therapy Business (US$ Million), 2021–2026
 Table 60. REVIV Recent Development
 Table 61. Get A Drip Company Details
 Table 62. Get A Drip Business Overview
 Table 63. Get A Drip IV Drip Therapy Product
 Table 64. Get A Drip Revenue in IV Drip Therapy Business (US$ Million), 2021–2026
 Table 65. Get A Drip Recent Development
 Table 66. Drip Boost Company Details
 Table 67. Drip Boost Business Overview
 Table 68. Drip Boost IV Drip Therapy Product
 Table 69. Drip Boost Revenue in IV Drip Therapy Business (US$ Million), 2021–2026
 Table 70. Drip Boost Recent Development
 Table 71. IntraVita Company Details
 Table 72. IntraVita Business Overview
 Table 73. IntraVita IV Drip Therapy Product
 Table 74. IntraVita Revenue in IV Drip Therapy Business (US$ Million), 2021–2026
 Table 75. IntraVita Recent Development
 Table 76. Drip Hydration Company Details
 Table 77. Drip Hydration Business Overview
 Table 78. Drip Hydration IV Drip Therapy Product
 Table 79. Drip Hydration Revenue in IV Drip Therapy Business (US$ Million), 2021–2026
 Table 80. Drip Hydration Recent Development
 Table 81. NutriZen IV Company Details
 Table 82. NutriZen IV Business Overview
 Table 83. NutriZen IV IV Drip Therapy Product
 Table 84. NutriZen IV Revenue in IV Drip Therapy Business (US$ Million), 2021–2026
 Table 85. NutriZen IV Recent Development
 Table 86. The Wellness Co. Company Details
 Table 87. The Wellness Co. Business Overview
 Table 88. The Wellness Co. IV Drip Therapy Product
 Table 89. The Wellness Co. Revenue in IV Drip Therapy Business (US$ Million), 2021–2026
 Table 90. The Wellness Co. Recent Development
 Table 91. IV Doc Company Details
 Table 92. IV Doc Business Overview
 Table 93. IV Doc IV Drip Therapy Product
 Table 94. IV Doc Revenue in IV Drip Therapy Business (US$ Million), 2021–2026
 Table 95. IV Doc Recent Development
 Table 96. IV Zeal Company Details
 Table 97. IV Zeal Business Overview
 Table 98. IV Zeal IV Drip Therapy Product
 Table 99. IV Zeal Revenue in IV Drip Therapy Business (US$ Million), 2021–2026
 Table 100. IV Zeal Recent Development
 Table 101. DRIPBaR Company Details
 Table 102. DRIPBaR Business Overview
 Table 103. DRIPBaR IV Drip Therapy Product
 Table 104. DRIPBaR Revenue in IV Drip Therapy Business (US$ Million), 2021–2026
 Table 105. DRIPBaR Recent Development
 Table 106. Hydrate IV Bar Company Details
 Table 107. Hydrate IV Bar Business Overview
 Table 108. Hydrate IV Bar IV Drip Therapy Product
 Table 109. Hydrate IV Bar Revenue in IV Drip Therapy Business (US$ Million), 2021–2026
 Table 110. Hydrate IV Bar Recent Development
 Table 111. Prime IV Company Details
 Table 112. Prime IV Business Overview
 Table 113. Prime IV IV Drip Therapy Product
 Table 114. Prime IV Revenue in IV Drip Therapy Business (US$ Million), 2021–2026
 Table 115. Prime IV Recent Development
 Table 116. Liquivida Company Details
 Table 117. Liquivida Business Overview
 Table 118. Liquivida IV Drip Therapy Product
 Table 119. Liquivida Revenue in IV Drip Therapy Business (US$ Million), 2021–2026
 Table 120. Liquivida Recent Development
 Table 121. Mobile IV Medics Company Details
 Table 122. Mobile IV Medics Business Overview
 Table 123. Mobile IV Medics IV Drip Therapy Product
 Table 124. Mobile IV Medics Revenue in IV Drip Therapy Business (US$ Million), 2021–2026
 Table 125. Mobile IV Medics Recent Development
 Table 126. IV Vitamin Therapy Clinic Company Details
 Table 127. IV Vitamin Therapy Clinic Business Overview
 Table 128. IV Vitamin Therapy Clinic IV Drip Therapy Product
 Table 129. IV Vitamin Therapy Clinic Revenue in IV Drip Therapy Business (US$ Million), 2021–2026
 Table 130. IV Vitamin Therapy Clinic Recent Development
 Table 131. iV Bars Company Details
 Table 132. iV Bars Business Overview
 Table 133. iV Bars IV Drip Therapy Product
 Table 134. iV Bars Revenue in IV Drip Therapy Business (US$ Million), 2021–2026
 Table 135. iV Bars Recent Development
 Table 136. The IV Bar Company Details
 Table 137. The IV Bar Business Overview
 Table 138. The IV Bar IV Drip Therapy Product
 Table 139. The IV Bar Revenue in IV Drip Therapy Business (US$ Million), 2021–2026
 Table 140. The IV Bar Recent Development
 Table 141. Reset iV Company Details
 Table 142. Reset iV Business Overview
 Table 143. Reset iV IV Drip Therapy Product
 Table 144. Reset iV Revenue in IV Drip Therapy Business (US$ Million), 2021–2026
 Table 145. Reset iV Recent Development
 Table 146. NutriDrip Company Details
 Table 147. NutriDrip Business Overview
 Table 148. NutriDrip IV Drip Therapy Product
 Table 149. NutriDrip Revenue in IV Drip Therapy Business (US$ Million), 2021–2026
 Table 150. NutriDrip Recent Development
 Table 151. Glow Wellness Company Details
 Table 152. Glow Wellness Business Overview
 Table 153. Glow Wellness IV Drip Therapy Product
 Table 154. Glow Wellness Revenue in IV Drip Therapy Business (US$ Million), 2021–2026
 Table 155. Glow Wellness Recent Development
 Table 156. True Health DPC Company Details
 Table 157. True Health DPC Business Overview
 Table 158. True Health DPC IV Drip Therapy Product
 Table 159. True Health DPC Revenue in IV Drip Therapy Business (US$ Million), 2021–2026
 Table 160. True Health DPC Recent Development
 Table 161. Dynamic Drips Company Details
 Table 162. Dynamic Drips Business Overview
 Table 163. Dynamic Drips IV Drip Therapy Product
 Table 164. Dynamic Drips Revenue in IV Drip Therapy Business (US$ Million), 2021–2026
 Table 165. Dynamic Drips Recent Development
 Table 166. Flow IV Company Details
 Table 167. Flow IV Business Overview
 Table 168. Flow IV IV Drip Therapy Product
 Table 169. Flow IV Revenue in IV Drip Therapy Business (US$ Million), 2021–2026
 Table 170. Flow IV Recent Development
 Table 171. sk:n Company Details
 Table 172. sk:n Business Overview
 Table 173. sk:n IV Drip Therapy Product
 Table 174. sk:n Revenue in IV Drip Therapy Business (US$ Million), 2021–2026
 Table 175. sk:n Recent Development
 Table 176. Infusion IV Company Details
 Table 177. Infusion IV Business Overview
 Table 178. Infusion IV IV Drip Therapy Product
 Table 179. Infusion IV Revenue in IV Drip Therapy Business (US$ Million), 2021–2026
 Table 180. Infusion IV Recent Development
 Table 181. Hydrelief Company Details
 Table 182. Hydrelief Business Overview
 Table 183. Hydrelief IV Drip Therapy Product
 Table 184. Hydrelief Revenue in IV Drip Therapy Business (US$ Million), 2021–2026
 Table 185. Hydrelief Recent Development
 Table 186. BFLO Hydration Company Details
 Table 187. BFLO Hydration Business Overview
 Table 188. BFLO Hydration IV Drip Therapy Product
 Table 189. BFLO Hydration Revenue in IV Drip Therapy Business (US$ Million), 2021–2026
 Table 190. BFLO Hydration Recent Development
 Table 191. Onus IV Company Details
 Table 192. Onus IV Business Overview
 Table 193. Onus IV IV Drip Therapy Product
 Table 194. Onus IV Revenue in IV Drip Therapy Business (US$ Million), 2021–2026
 Table 195. Onus IV Recent Development
 Table 196. Thrive Solutions Company Details
 Table 197. Thrive Solutions Business Overview
 Table 198. Thrive Solutions IV Drip Therapy Product
 Table 199. Thrive Solutions Revenue in IV Drip Therapy Business (US$ Million), 2021–2026
 Table 200. Thrive Solutions Recent Development
 Table 201. Wellness IV Infusion Therapy Company Details
 Table 202. Wellness IV Infusion Therapy Business Overview
 Table 203. Wellness IV Infusion Therapy IV Drip Therapy Product
 Table 204. Wellness IV Infusion Therapy Revenue in IV Drip Therapy Business (US$ Million), 2021–2026
 Table 205. Wellness IV Infusion Therapy Recent Development
 Table 206. Research Programs/Design for This Report
 Table 207. Key Data Information from Secondary Sources
 Table 208. Key Data Information from Primary Sources
 Table 209. Authors List of This Report


List of Figures
 Figure 1. IV Drip Therapy Picture
 Figure 2. Global IV Drip Therapy Market Size Comparison by Type (US$ Million), 2021–2032
 Figure 3. Global IV Drip Therapy Market Share by Type: 2025 vs 2032
 Figure 4. lmmune Boosters Features
 Figure 5. Energy Boosters Features
 Figure 6. Skin Care Features
 Figure 7. Migraine Features
 Figure 8. Others Features
 Figure 9. Global IV Drip Therapy Market Size Comparison by Route of Administration (US$ Million), 2021–2032
 Figure 10. Peripheral Intravenous (PIV) Therapy Features
 Figure 11. Central Venous (CV) Therapy Features
 Figure 12. Intraosseous (IO) Therapy Features
 Figure 13. Global IV Drip Therapy Market Size Comparison by Regulatory (US$ Million), 2021–2032
 Figure 14. Prescription-Only IV Therapy Features
 Figure 15. Over-the-Counter (OTC) Wellness IV Therapy Features
 Figure 16. Global IV Drip Therapy Market Size by Application (US$ Million), 2021–2032
 Figure 17. Global IV Drip Therapy Market Share by Application: 2025 vs 2032
 Figure 18. Medical Applications Case Studies
 Figure 19. Outpatient Clinics Case Studies
 Figure 20. Wellness Applications Case Studies
 Figure 21. Others Case Studies
 Figure 22. IV Drip Therapy Report Years Considered
 Figure 23. Global IV Drip Therapy Market Size (US$ Million), Year-over-Year: 2021–2032
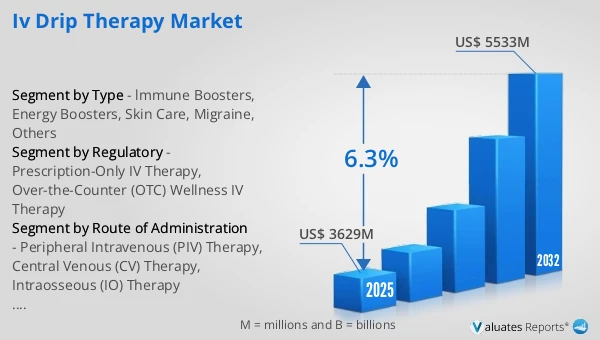
 Figure 24. Global IV Drip Therapy Market Size, (US$ Million), 2021 vs 2025 vs 2032
 Figure 25. Global IV Drip Therapy Market Share by Region: 2025 vs 2032
 Figure 26. Global IV Drip Therapy Market Share by Players in 2025
 Figure 27. Global IV Drip Therapy Market Share by Company Type (Tier 1, Tier 2, and Tier 3)
 Figure 28. The Top 10 and 5 Players Market Share by IV Drip Therapy Revenue in 2025
 Figure 29. North America IV Drip Therapy Market Size YoY Growth (US$ Million), 2021–2032
 Figure 30. North America IV Drip Therapy Market Share by Country (2021–2032)
 Figure 31. United States IV Drip Therapy Market Size YoY Growth (US$ Million), 2021–2032
 Figure 32. Canada IV Drip Therapy Market Size YoY Growth (US$ Million), 2021–2032
 Figure 33. Europe IV Drip Therapy Market Size YoY Growth (US$ Million), 2021–2032
 Figure 34. Europe IV Drip Therapy Market Share by Country (2021–2032)
 Figure 35. Germany IV Drip Therapy Market Size YoY Growth (US$ Million), 2021–2032
 Figure 36. France IV Drip Therapy Market Size YoY Growth (US$ Million), 2021–2032
 Figure 37. U.K. IV Drip Therapy Market Size YoY Growth (US$ Million), 2021–2032
 Figure 38. Italy IV Drip Therapy Market Size YoY Growth (US$ Million), 2021–2032
 Figure 39. Russia IV Drip Therapy Market Size YoY Growth (US$ Million), 2021–2032
 Figure 40. Ireland IV Drip Therapy Market Size YoY Growth (US$ Million), 2021–2032
 Figure 41. Asia-Pacific IV Drip Therapy Market Size YoY Growth (US$ Million), 2021–2032
 Figure 42. Asia-Pacific IV Drip Therapy Market Share by Region (2021–2032)
 Figure 43. China IV Drip Therapy Market Size YoY Growth (US$ Million), 2021–2032
 Figure 44. Japan IV Drip Therapy Market Size YoY Growth (US$ Million), 2021–2032
 Figure 45. South Korea IV Drip Therapy Market Size YoY Growth (US$ Million), 2021–2032
 Figure 46. Southeast Asia IV Drip Therapy Market Size YoY Growth (US$ Million), 2021–2032
 Figure 47. India IV Drip Therapy Market Size YoY Growth (US$ Million), 2021–2032
 Figure 48. Australia & New Zealand IV Drip Therapy Market Size YoY Growth (US$ Million), 2021–2032
 Figure 49. Latin America IV Drip Therapy Market Size YoY Growth (US$ Million), 2021–2032
 Figure 50. Latin America IV Drip Therapy Market Share by Country (2021–2032)
 Figure 51. Mexico IV Drip Therapy Market Size YoY Growth (US$ Million), 2021–2032
 Figure 52. Brazil IV Drip Therapy Market Size YoY Growth (US$ Million), 2021–2032
 Figure 53. Middle East & Africa IV Drip Therapy Market Size YoY Growth (US$ Million), 2021–2032
 Figure 54. Middle East & Africa IV Drip Therapy Market Share by Country (2021–2032)
 Figure 55. Israel IV Drip Therapy Market Size YoY Growth (US$ Million), 2021–2032
 Figure 56. Saudi Arabia IV Drip Therapy Market Size YoY Growth (US$ Million), 2021–2032
 Figure 57. UAE IV Drip Therapy Market Size YoY Growth (US$ Million), 2021–2032
 Figure 58. REVIV Revenue Growth Rate in IV Drip Therapy Business (2021–2026)
 Figure 59. Get A Drip Revenue Growth Rate in IV Drip Therapy Business (2021–2026)
 Figure 60. Drip Boost Revenue Growth Rate in IV Drip Therapy Business (2021–2026)
 Figure 61. IntraVita Revenue Growth Rate in IV Drip Therapy Business (2021–2026)
 Figure 62. Drip Hydration Revenue Growth Rate in IV Drip Therapy Business (2021–2026)
 Figure 63. NutriZen IV Revenue Growth Rate in IV Drip Therapy Business (2021–2026)
 Figure 64. The Wellness Co. Revenue Growth Rate in IV Drip Therapy Business (2021–2026)
 Figure 65. IV Doc Revenue Growth Rate in IV Drip Therapy Business (2021–2026)
 Figure 66. IV Zeal Revenue Growth Rate in IV Drip Therapy Business (2021–2026)
 Figure 67. DRIPBaR Revenue Growth Rate in IV Drip Therapy Business (2021–2026)
 Figure 68. Hydrate IV Bar Revenue Growth Rate in IV Drip Therapy Business (2021–2026)
 Figure 69. Prime IV Revenue Growth Rate in IV Drip Therapy Business (2021–2026)
 Figure 70. Liquivida Revenue Growth Rate in IV Drip Therapy Business (2021–2026)
 Figure 71. Mobile IV Medics Revenue Growth Rate in IV Drip Therapy Business (2021–2026)
 Figure 72. IV Vitamin Therapy Clinic Revenue Growth Rate in IV Drip Therapy Business (2021–2026)
 Figure 73. iV Bars Revenue Growth Rate in IV Drip Therapy Business (2021–2026)
 Figure 74. The IV Bar Revenue Growth Rate in IV Drip Therapy Business (2021–2026)
 Figure 75. Reset iV Revenue Growth Rate in IV Drip Therapy Business (2021–2026)
 Figure 76. NutriDrip Revenue Growth Rate in IV Drip Therapy Business (2021–2026)
 Figure 77. Glow Wellness Revenue Growth Rate in IV Drip Therapy Business (2021–2026)
 Figure 78. True Health DPC Revenue Growth Rate in IV Drip Therapy Business (2021–2026)
 Figure 79. Dynamic Drips Revenue Growth Rate in IV Drip Therapy Business (2021–2026)
 Figure 80. Flow IV Revenue Growth Rate in IV Drip Therapy Business (2021–2026)
 Figure 81. sk:n Revenue Growth Rate in IV Drip Therapy Business (2021–2026)
 Figure 82. Infusion IV Revenue Growth Rate in IV Drip Therapy Business (2021–2026)
 Figure 83. Hydrelief Revenue Growth Rate in IV Drip Therapy Business (2021–2026)
 Figure 84. BFLO Hydration Revenue Growth Rate in IV Drip Therapy Business (2021–2026)
 Figure 85. Onus IV Revenue Growth Rate in IV Drip Therapy Business (2021–2026)
 Figure 86. Thrive Solutions Revenue Growth Rate in IV Drip Therapy Business (2021–2026)
 Figure 87. Wellness IV Infusion Therapy Revenue Growth Rate in IV Drip Therapy Business (2021–2026)
 Figure 88. Bottom-up and Top-down Approaches for This Report
 Figure 89. Data Triangulation
 Figure 90. Key Executives Interviewed
SELECT A FORMAT
Added to Cart
Electronic

$2900

Single User License
Electronic

$4350

Multi User License
Electronic

$5800

Enterprise License
Add to Cart
Buy Now (15% Discount)

OUR CUSTOMER

Nano Dimension

SIMILAR REPORTS