List of Tables
Table 1. Global Next Flight Out (NFO) Service Market Size Growth Rate by Type (US$ Million): 2021 vs 2025 vs 2032
Table 2. Key Players of National Services
Table 3. Key Players of International Services
Table 4. Global Next Flight Out (NFO) Service Market Size Growth Rate by Service Operation Mode (US$ Million): 2021 vs 2025 vs 2032
Table 5. Key Players of Commercial Flight Utilization NFO
Table 6. Key Players of Chartered Flight Exclusive NFO
Table 7. Key Players of Dedicated Cargo Shuttle NFO
Table 8. Global Next Flight Out (NFO) Service Market Size Growth by Application (US$ Million): 2021 vs 2025 vs 2032
Table 9. Global Next Flight Out (NFO) Service Market Size by Region (US$ Million): 2021 vs 2025 vs 2032
Table 10. Global Next Flight Out (NFO) Service Market Size by Region (US$ Million), 2021–2026
Table 11. Global Next Flight Out (NFO) Service Market Share by Region (2021–2026)
Table 12. Global Next Flight Out (NFO) Service Forecasted Market Size by Region (US$ Million), 2027–2032
Table 13. Global Next Flight Out (NFO) Service Market Share by Region (2027–2032)
Table 14. Next Flight Out (NFO) Service Market Trends
Table 15. Next Flight Out (NFO) Service Market Drivers
Table 16. Next Flight Out (NFO) Service Market Challenges
Table 17. Next Flight Out (NFO) Service Market Restraints
Table 18. Global Next Flight Out (NFO) Service Revenue by Players (US$ Million), 2021–2026
Table 19. Global Next Flight Out (NFO) Service Market Share by Players (2021–2026)
Table 20. Global Top Next Flight Out (NFO) Service Players by Tier (Tier 1, Tier 2, and Tier 3), based on Next Flight Out (NFO) Service Revenue, 2025
Table 21. Ranking of Global Top Next Flight Out (NFO) Service Companies by Revenue (US$ Million) in 2025
Table 22. Global 5 Largest Players Market Share by Next Flight Out (NFO) Service Revenue (CR5 and HHI), 2021–2026
Table 23. Global Key Players of Next Flight Out (NFO) Service, Headquarters and Area Served
Table 24. Global Key Players of Next Flight Out (NFO) Service, Products and Applications
Table 25. Global Key Players of Next Flight Out (NFO) Service, Date of General Availability (GA)
Table 26. Mergers and Acquisitions, Expansion Plans
Table 27. Global Next Flight Out (NFO) Service Market Size by Type (US$ Million), 2021–2026
Table 28. Global Next Flight Out (NFO) Service Revenue Market Share by Type (2021–2026)
Table 29. Global Next Flight Out (NFO) Service Forecasted Market Size by Type (US$ Million), 2027–2032
Table 30. Global Next Flight Out (NFO) Service Revenue Market Share by Type (2027–2032)
Table 31. Global Next Flight Out (NFO) Service Market Size by Application (US$ Million), 2021–2026
Table 32. Global Next Flight Out (NFO) Service Revenue Market Share by Application (2021–2026)
Table 33. Global Next Flight Out (NFO) Service Forecasted Market Size by Application (US$ Million), 2027–2032
Table 34. Global Next Flight Out (NFO) Service Revenue Market Share by Application (2027–2032)
Table 35. North America Next Flight Out (NFO) Service Market Size Growth Rate by Country (US$ Million): 2021 vs 2025 vs 2032
Table 36. North America Next Flight Out (NFO) Service Market Size by Country (US$ Million), 2021–2026
Table 37. North America Next Flight Out (NFO) Service Market Size by Country (US$ Million), 2027–2032
Table 38. Europe Next Flight Out (NFO) Service Market Size Growth Rate by Country (US$ Million): 2021 vs 2025 vs 2032
Table 39. Europe Next Flight Out (NFO) Service Market Size by Country (US$ Million), 2021–2026
Table 40. Europe Next Flight Out (NFO) Service Market Size by Country (US$ Million), 2027–2032
Table 41. Asia-Pacific Next Flight Out (NFO) Service Market Size Growth Rate by Region (US$ Million): 2021 vs 2025 vs 2032
Table 42. Asia-Pacific Next Flight Out (NFO) Service Market Size by Region (US$ Million), 2021–2026
Table 43. Asia-Pacific Next Flight Out (NFO) Service Market Size by Region (US$ Million), 2027–2032
Table 44. Latin America Next Flight Out (NFO) Service Market Size Growth Rate by Country (US$ Million): 2021 vs 2025 vs 2032
Table 45. Latin America Next Flight Out (NFO) Service Market Size by Country (US$ Million), 2021–2026
Table 46. Latin America Next Flight Out (NFO) Service Market Size by Country (US$ Million), 2027–2032
Table 47. Middle East & Africa Next Flight Out (NFO) Service Market Size Growth Rate by Country (US$ Million): 2021 vs 2025 vs 2032
Table 48. Middle East & Africa Next Flight Out (NFO) Service Market Size by Country (US$ Million), 2021–2026
Table 49. Middle East & Africa Next Flight Out (NFO) Service Market Size by Country (US$ Million), 2027–2032
Table 50. UPS Express Company Details
Table 51. UPS Express Business Overview
Table 52. UPS Express Next Flight Out (NFO) Service Product
Table 53. UPS Express Revenue in Next Flight Out (NFO) Service Business (US$ Million), 2021–2026
Table 54. UPS Express Recent Development
Table 55. SEKO Logistics Company Details
Table 56. SEKO Logistics Business Overview
Table 57. SEKO Logistics Next Flight Out (NFO) Service Product
Table 58. SEKO Logistics Revenue in Next Flight Out (NFO) Service Business (US$ Million), 2021–2026
Table 59. SEKO Logistics Recent Development
Table 60. DHL Company Details
Table 61. DHL Business Overview
Table 62. DHL Next Flight Out (NFO) Service Product
Table 63. DHL Revenue in Next Flight Out (NFO) Service Business (US$ Million), 2021–2026
Table 64. DHL Recent Development
Table 65. Royale International Company Details
Table 66. Royale International Business Overview
Table 67. Royale International Next Flight Out (NFO) Service Product
Table 68. Royale International Revenue in Next Flight Out (NFO) Service Business (US$ Million), 2021–2026
Table 69. Royale International Recent Development
Table 70. AIT Worldwide Logistics Company Details
Table 71. AIT Worldwide Logistics Business Overview
Table 72. AIT Worldwide Logistics Next Flight Out (NFO) Service Product
Table 73. AIT Worldwide Logistics Revenue in Next Flight Out (NFO) Service Business (US$ Million), 2021–2026
Table 74. AIT Worldwide Logistics Recent Development
Table 75. Reliable Couriers Company Details
Table 76. Reliable Couriers Business Overview
Table 77. Reliable Couriers Next Flight Out (NFO) Service Product
Table 78. Reliable Couriers Revenue in Next Flight Out (NFO) Service Business (US$ Million), 2021–2026
Table 79. Reliable Couriers Recent Development
Table 80. CNW Company Details
Table 81. CNW Business Overview
Table 82. CNW Next Flight Out (NFO) Service Product
Table 83. CNW Revenue in Next Flight Out (NFO) Service Business (US$ Million), 2021–2026
Table 84. CNW Recent Development
Table 85. Air Partner Company Details
Table 86. Air Partner Business Overview
Table 87. Air Partner Next Flight Out (NFO) Service Product
Table 88. Air Partner Revenue in Next Flight Out (NFO) Service Business (US$ Million), 2021–2026
Table 89. Air Partner Recent Development
Table 90. time:matters Company Details
Table 91. time:matters Business Overview
Table 92. time:matters Next Flight Out (NFO) Service Product
Table 93. time:matters Revenue in Next Flight Out (NFO) Service Business (US$ Million), 2021–2026
Table 94. time:matters Recent Development
Table 95. Nextflightcourier Company Details
Table 96. Nextflightcourier Business Overview
Table 97. Nextflightcourier Next Flight Out (NFO) Service Product
Table 98. Nextflightcourier Revenue in Next Flight Out (NFO) Service Business (US$ Million), 2021–2026
Table 99. Nextflightcourier Recent Development
Table 100. Atlantic International Company Details
Table 101. Atlantic International Business Overview
Table 102. Atlantic International Next Flight Out (NFO) Service Product
Table 103. Atlantic International Revenue in Next Flight Out (NFO) Service Business (US$ Million), 2021–2026
Table 104. Atlantic International Recent Development
Table 105. Mercury Company Details
Table 106. Mercury Business Overview
Table 107. Mercury Next Flight Out (NFO) Service Product
Table 108. Mercury Revenue in Next Flight Out (NFO) Service Business (US$ Million), 2021–2026
Table 109. Mercury Recent Development
Table 110. QuickSTAT Company Details
Table 111. QuickSTAT Business Overview
Table 112. QuickSTAT Next Flight Out (NFO) Service Product
Table 113. QuickSTAT Revenue in Next Flight Out (NFO) Service Business (US$ Million), 2021–2026
Table 114. QuickSTAT Recent Development
Table 115. Sterling AOG Company Details
Table 116. Sterling AOG Business Overview
Table 117. Sterling AOG Next Flight Out (NFO) Service Product
Table 118. Sterling AOG Revenue in Next Flight Out (NFO) Service Business (US$ Million), 2021–2026
Table 119. Sterling AOG Recent Development
Table 120. SameDayAir Company Details
Table 121. SameDayAir Business Overview
Table 122. SameDayAir Next Flight Out (NFO) Service Product
Table 123. SameDayAir Revenue in Next Flight Out (NFO) Service Business (US$ Million), 2021–2026
Table 124. SameDayAir Recent Development
Table 125. Jetpak Company Details
Table 126. Jetpak Business Overview
Table 127. Jetpak Next Flight Out (NFO) Service Product
Table 128. Jetpak Revenue in Next Flight Out (NFO) Service Business (US$ Million), 2021–2026
Table 129. Jetpak Recent Development
Table 130. SSAF Logistics Company Details
Table 131. SSAF Logistics Business Overview
Table 132. SSAF Logistics Next Flight Out (NFO) Service Product
Table 133. SSAF Logistics Revenue in Next Flight Out (NFO) Service Business (US$ Million), 2021–2026
Table 134. SSAF Logistics Recent Development
Table 135. COGISTICS Transportation Company Details
Table 136. COGISTICS Transportation Business Overview
Table 137. COGISTICS Transportation Next Flight Out (NFO) Service Product
Table 138. COGISTICS Transportation Revenue in Next Flight Out (NFO) Service Business (US$ Million), 2021–2026
Table 139. COGISTICS Transportation Recent Development
Table 140. Research Programs/Design for This Report
Table 141. Key Data Information from Secondary Sources
Table 142. Key Data Information from Primary Sources
Table 143. Authors List of This Report
List of Figures
Figure 1. Next Flight Out (NFO) Service Picture
Figure 2. Global Next Flight Out (NFO) Service Market Size Comparison by Type (US$ Million), 2021–2032
Figure 3. Global Next Flight Out (NFO) Service Market Share by Type: 2025 vs 2032
Figure 4. National Services Features
Figure 5. International Services Features
Figure 6. Global Next Flight Out (NFO) Service Market Size Comparison by Service Operation Mode (US$ Million), 2021–2032
Figure 7. Commercial Flight Utilization NFO Features
Figure 8. Chartered Flight Exclusive NFO Features
Figure 9. Dedicated Cargo Shuttle NFO Features
Figure 10. Global Next Flight Out (NFO) Service Market Size by Application (US$ Million), 2021–2032
Figure 11. Global Next Flight Out (NFO) Service Market Share by Application: 2025 vs 2032
Figure 12. Emergency Medical Logistics Case Studies
Figure 13. Industrial Critical Parts Delivery Case Studies
Figure 14. High-Value Goods Fulfillment Case Studies
Figure 15. Disaster Relief Supply Transport Case Studies
Figure 16. Business Critical Asset Delivery Case Studies
Figure 17. Others Case Studies
Figure 18. Next Flight Out (NFO) Service Report Years Considered
Figure 19. Global Next Flight Out (NFO) Service Market Size (US$ Million), Year-over-Year: 2021–2032
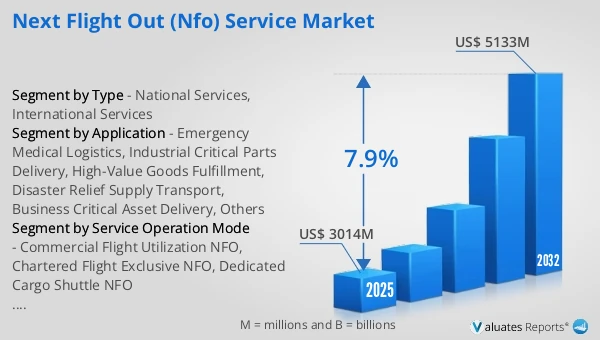
Figure 20. Global Next Flight Out (NFO) Service Market Size, (US$ Million), 2021 vs 2025 vs 2032
Figure 21. Global Next Flight Out (NFO) Service Market Share by Region: 2025 vs 2032
Figure 22. Global Next Flight Out (NFO) Service Market Share by Players in 2025
Figure 23. Global Next Flight Out (NFO) Service Market Share by Company Type (Tier 1, Tier 2, and Tier 3)
Figure 24. The Top 10 and 5 Players Market Share by Next Flight Out (NFO) Service Revenue in 2025
Figure 25. North America Next Flight Out (NFO) Service Market Size YoY Growth (US$ Million), 2021–2032
Figure 26. North America Next Flight Out (NFO) Service Market Share by Country (2021–2032)
Figure 27. United States Next Flight Out (NFO) Service Market Size YoY Growth (US$ Million), 2021–2032
Figure 28. Canada Next Flight Out (NFO) Service Market Size YoY Growth (US$ Million), 2021–2032
Figure 29. Europe Next Flight Out (NFO) Service Market Size YoY Growth (US$ Million), 2021–2032
Figure 30. Europe Next Flight Out (NFO) Service Market Share by Country (2021–2032)
Figure 31. Germany Next Flight Out (NFO) Service Market Size YoY Growth (US$ Million), 2021–2032
Figure 32. France Next Flight Out (NFO) Service Market Size YoY Growth (US$ Million), 2021–2032
Figure 33. U.K. Next Flight Out (NFO) Service Market Size YoY Growth (US$ Million), 2021–2032
Figure 34. Italy Next Flight Out (NFO) Service Market Size YoY Growth (US$ Million), 2021–2032
Figure 35. Russia Next Flight Out (NFO) Service Market Size YoY Growth (US$ Million), 2021–2032
Figure 36. Ireland Next Flight Out (NFO) Service Market Size YoY Growth (US$ Million), 2021–2032
Figure 37. Asia-Pacific Next Flight Out (NFO) Service Market Size YoY Growth (US$ Million), 2021–2032
Figure 38. Asia-Pacific Next Flight Out (NFO) Service Market Share by Region (2021–2032)
Figure 39. China Next Flight Out (NFO) Service Market Size YoY Growth (US$ Million), 2021–2032
Figure 40. Japan Next Flight Out (NFO) Service Market Size YoY Growth (US$ Million), 2021–2032
Figure 41. South Korea Next Flight Out (NFO) Service Market Size YoY Growth (US$ Million), 2021–2032
Figure 42. Southeast Asia Next Flight Out (NFO) Service Market Size YoY Growth (US$ Million), 2021–2032
Figure 43. India Next Flight Out (NFO) Service Market Size YoY Growth (US$ Million), 2021–2032
Figure 44. Australia & New Zealand Next Flight Out (NFO) Service Market Size YoY Growth (US$ Million), 2021–2032
Figure 45. Latin America Next Flight Out (NFO) Service Market Size YoY Growth (US$ Million), 2021–2032
Figure 46. Latin America Next Flight Out (NFO) Service Market Share by Country (2021–2032)
Figure 47. Mexico Next Flight Out (NFO) Service Market Size YoY Growth (US$ Million), 2021–2032
Figure 48. Brazil Next Flight Out (NFO) Service Market Size YoY Growth (US$ Million), 2021–2032
Figure 49. Middle East & Africa Next Flight Out (NFO) Service Market Size YoY Growth (US$ Million), 2021–2032
Figure 50. Middle East & Africa Next Flight Out (NFO) Service Market Share by Country (2021–2032)
Figure 51. Israel Next Flight Out (NFO) Service Market Size YoY Growth (US$ Million), 2021–2032
Figure 52. Saudi Arabia Next Flight Out (NFO) Service Market Size YoY Growth (US$ Million), 2021–2032
Figure 53. UAE Next Flight Out (NFO) Service Market Size YoY Growth (US$ Million), 2021–2032
Figure 54. UPS Express Revenue Growth Rate in Next Flight Out (NFO) Service Business (2021–2026)
Figure 55. SEKO Logistics Revenue Growth Rate in Next Flight Out (NFO) Service Business (2021–2026)
Figure 56. DHL Revenue Growth Rate in Next Flight Out (NFO) Service Business (2021–2026)
Figure 57. Royale International Revenue Growth Rate in Next Flight Out (NFO) Service Business (2021–2026)
Figure 58. AIT Worldwide Logistics Revenue Growth Rate in Next Flight Out (NFO) Service Business (2021–2026)
Figure 59. Reliable Couriers Revenue Growth Rate in Next Flight Out (NFO) Service Business (2021–2026)
Figure 60. CNW Revenue Growth Rate in Next Flight Out (NFO) Service Business (2021–2026)
Figure 61. Air Partner Revenue Growth Rate in Next Flight Out (NFO) Service Business (2021–2026)
Figure 62. time:matters Revenue Growth Rate in Next Flight Out (NFO) Service Business (2021–2026)
Figure 63. Nextflightcourier Revenue Growth Rate in Next Flight Out (NFO) Service Business (2021–2026)
Figure 64. Atlantic International Revenue Growth Rate in Next Flight Out (NFO) Service Business (2021–2026)
Figure 65. Mercury Revenue Growth Rate in Next Flight Out (NFO) Service Business (2021–2026)
Figure 66. QuickSTAT Revenue Growth Rate in Next Flight Out (NFO) Service Business (2021–2026)
Figure 67. Sterling AOG Revenue Growth Rate in Next Flight Out (NFO) Service Business (2021–2026)
Figure 68. SameDayAir Revenue Growth Rate in Next Flight Out (NFO) Service Business (2021–2026)
Figure 69. Jetpak Revenue Growth Rate in Next Flight Out (NFO) Service Business (2021–2026)
Figure 70. SSAF Logistics Revenue Growth Rate in Next Flight Out (NFO) Service Business (2021–2026)
Figure 71. COGISTICS Transportation Revenue Growth Rate in Next Flight Out (NFO) Service Business (2021–2026)
Figure 72. Bottom-up and Top-down Approaches for This Report
Figure 73. Data Triangulation
Figure 74. Key Executives Interviewed