List of Tables
Table 1. Global Semiconductor Consumables Market Size Growth Rate by Type (US$ Million): 2020 VS 2024 VS 2031
Table 2. Key Players of Wafer Manufacturing Materials
Table 3. Key Players of Packaging Materials
Table 4. Key Players of Consumable Parts for Semiconductor Equipment
Table 5. Global Semiconductor Consumables Market Size Growth by Application (US$ Million): 2020 VS 2024 VS 2031
Table 6. Global Semiconductor Consumables Market Size by Region (US$ Million): 2020 VS 2024 VS 2031
Table 7. Global Semiconductor Consumables Market Size by Region (2020-2025) & (US$ Million)
Table 8. Global Semiconductor Consumables Market Share by Region (2020-2025)
Table 9. Global Semiconductor Consumables Forecasted Market Size by Region (2026-2031) & (US$ Million)
Table 10. Global Semiconductor Consumables Market Share by Region (2026-2031)
Table 11. Semiconductor Consumables Market Trends
Table 12. Semiconductor Consumables Market Drivers
Table 13. Semiconductor Consumables Market Challenges
Table 14. Semiconductor Consumables Market Restraints
Table 15. Global Semiconductor Consumables Revenue by Players (2020-2025) & (US$ Million)
Table 16. Global Semiconductor Consumables Market Share by Players (2020-2025)
Table 17. Global Top Semiconductor Consumables Players by Company Type (Tier 1, Tier 2, and Tier 3) & (based on the Revenue in Semiconductor Consumables as of 2024)
Table 18. Ranking of Global Top Semiconductor Consumables Companies by Revenue (US$ Million) in 2024
Table 19. Global 5 Largest Players Market Share by Semiconductor Consumables Revenue (CR5 and HHI) & (2020-2025)
Table 20. Global Key Players of Semiconductor Consumables, Headquarters and Area Served
Table 21. Global Key Players of Semiconductor Consumables, Product and Application
Table 22. Global Key Players of Semiconductor Consumables, Date of Enter into This Industry
Table 23. Mergers & Acquisitions, Expansion Plans
Table 24. Global Semiconductor Consumables Market Size by Type (2020-2025) & (US$ Million)
Table 25. Global Semiconductor Consumables Revenue Market Share by Type (2020-2025)
Table 26. Global Semiconductor Consumables Forecasted Market Size by Type (2026-2031) & (US$ Million)
Table 27. Global Semiconductor Consumables Revenue Market Share by Type (2026-2031)
Table 28. Global Semiconductor Consumables Market Size by Application (2020-2025) & (US$ Million)
Table 29. Global Semiconductor Consumables Revenue Market Share by Application (2020-2025)
Table 30. Global Semiconductor Consumables Forecasted Market Size by Application (2026-2031) & (US$ Million)
Table 31. Global Semiconductor Consumables Revenue Market Share by Application (2026-2031)
Table 32. North America Semiconductor Consumables Market Size Growth Rate by Country (US$ Million): 2020 VS 2024 VS 2031
Table 33. North America Semiconductor Consumables Market Size by Country (2020-2025) & (US$ Million)
Table 34. North America Semiconductor Consumables Market Size by Country (2026-2031) & (US$ Million)
Table 35. Europe Semiconductor Consumables Market Size Growth Rate by Country (US$ Million): 2020 VS 2024 VS 2031
Table 36. Europe Semiconductor Consumables Market Size by Country (2020-2025) & (US$ Million)
Table 37. Europe Semiconductor Consumables Market Size by Country (2026-2031) & (US$ Million)
Table 38. Asia-Pacific Semiconductor Consumables Market Size Growth Rate by Region (US$ Million): 2020 VS 2024 VS 2031
Table 39. Asia-Pacific Semiconductor Consumables Market Size by Region (2020-2025) & (US$ Million)
Table 40. Asia-Pacific Semiconductor Consumables Market Size by Region (2026-2031) & (US$ Million)
Table 41. Latin America Semiconductor Consumables Market Size Growth Rate by Country (US$ Million): 2020 VS 2024 VS 2031
Table 42. Latin America Semiconductor Consumables Market Size by Country (2020-2025) & (US$ Million)
Table 43. Latin America Semiconductor Consumables Market Size by Country (2026-2031) & (US$ Million)
Table 44. Middle East & Africa Semiconductor Consumables Market Size Growth Rate by Country (US$ Million): 2020 VS 2024 VS 2031
Table 45. Middle East & Africa Semiconductor Consumables Market Size by Country (2020-2025) & (US$ Million)
Table 46. Middle East & Africa Semiconductor Consumables Market Size by Country (2026-2031) & (US$ Million)
Table 47. Shin-Etsu Chemical Company Details
Table 48. Shin-Etsu Chemical Business Overview
Table 49. Shin-Etsu Chemical Semiconductor Consumables Product
Table 50. Shin-Etsu Chemical Revenue in Semiconductor Consumables Business (2020-2025) & (US$ Million)
Table 51. Shin-Etsu Chemical Recent Development
Table 52. SUMCO Company Details
Table 53. SUMCO Business Overview
Table 54. SUMCO Semiconductor Consumables Product
Table 55. SUMCO Revenue in Semiconductor Consumables Business (2020-2025) & (US$ Million)
Table 56. SUMCO Recent Development
Table 57. GlobalWafers Company Details
Table 58. GlobalWafers Business Overview
Table 59. GlobalWafers Semiconductor Consumables Product
Table 60. GlobalWafers Revenue in Semiconductor Consumables Business (2020-2025) & (US$ Million)
Table 61. GlobalWafers Recent Development
Table 62. Kyocera Company Details
Table 63. Kyocera Business Overview
Table 64. Kyocera Semiconductor Consumables Product
Table 65. Kyocera Revenue in Semiconductor Consumables Business (2020-2025) & (US$ Million)
Table 66. Kyocera Recent Development
Table 67. Ibiden Company Details
Table 68. Ibiden Business Overview
Table 69. Ibiden Semiconductor Consumables Product
Table 70. Ibiden Revenue in Semiconductor Consumables Business (2020-2025) & (US$ Million)
Table 71. Ibiden Recent Development
Table 72. Unimicron Company Details
Table 73. Unimicron Business Overview
Table 74. Unimicron Semiconductor Consumables Product
Table 75. Unimicron Revenue in Semiconductor Consumables Business (2020-2025) & (US$ Million)
Table 76. Unimicron Recent Development
Table 77. SK Siltron Company Details
Table 78. SK Siltron Business Overview
Table 79. SK Siltron Semiconductor Consumables Product
Table 80. SK Siltron Revenue in Semiconductor Consumables Business (2020-2025) & (US$ Million)
Table 81. SK Siltron Recent Development
Table 82. Siltronic AG Company Details
Table 83. Siltronic AG Business Overview
Table 84. Siltronic AG Semiconductor Consumables Product
Table 85. Siltronic AG Revenue in Semiconductor Consumables Business (2020-2025) & (US$ Million)
Table 86. Siltronic AG Recent Development
Table 87. Samsung Electro-Mechanics Company Details
Table 88. Samsung Electro-Mechanics Business Overview
Table 89. Samsung Electro-Mechanics Semiconductor Consumables Product
Table 90. Samsung Electro-Mechanics Revenue in Semiconductor Consumables Business (2020-2025) & (US$ Million)
Table 91. Samsung Electro-Mechanics Recent Development
Table 92. Shinko Electric Industries Company Details
Table 93. Shinko Electric Industries Business Overview
Table 94. Shinko Electric Industries Semiconductor Consumables Product
Table 95. Shinko Electric Industries Revenue in Semiconductor Consumables Business (2020-2025) & (US$ Million)
Table 96. Shinko Electric Industries Recent Development
Table 97. Nan Ya PCB Company Details
Table 98. Nan Ya PCB Business Overview
Table 99. Nan Ya PCB Semiconductor Consumables Product
Table 100. Nan Ya PCB Revenue in Semiconductor Consumables Business (2020-2025) & (US$ Million)
Table 101. Nan Ya PCB Recent Development
Table 102. DuPont Company Details
Table 103. DuPont Business Overview
Table 104. DuPont Semiconductor Consumables Product
Table 105. DuPont Revenue in Semiconductor Consumables Business (2020-2025) & (US$ Million)
Table 106. DuPont Recent Development
Table 107. LG InnoTek Company Details
Table 108. LG InnoTek Business Overview
Table 109. LG InnoTek Semiconductor Consumables Product
Table 110. LG InnoTek Revenue in Semiconductor Consumables Business (2020-2025) & (US$ Million)
Table 111. LG InnoTek Recent Development
Table 112. Simmtech Company Details
Table 113. Simmtech Business Overview
Table 114. Simmtech Semiconductor Consumables Product
Table 115. Simmtech Revenue in Semiconductor Consumables Business (2020-2025) & (US$ Million)
Table 116. Simmtech Recent Development
Table 117. Daeduck Electronics Company Details
Table 118. Daeduck Electronics Business Overview
Table 119. Daeduck Electronics Semiconductor Consumables Product
Table 120. Daeduck Electronics Revenue in Semiconductor Consumables Business (2020-2025) & (US$ Million)
Table 121. Daeduck Electronics Recent Development
Table 122. Kinsus Interconnect Technology Company Details
Table 123. Kinsus Interconnect Technology Business Overview
Table 124. Kinsus Interconnect Technology Semiconductor Consumables Product
Table 125. Kinsus Interconnect Technology Revenue in Semiconductor Consumables Business (2020-2025) & (US$ Million)
Table 126. Kinsus Interconnect Technology Recent Development
Table 127. Resonac Company Details
Table 128. Resonac Business Overview
Table 129. Resonac Semiconductor Consumables Product
Table 130. Resonac Revenue in Semiconductor Consumables Business (2020-2025) & (US$ Million)
Table 131. Resonac Recent Development
Table 132. Sumitomo Bakelite Company Details
Table 133. Sumitomo Bakelite Business Overview
Table 134. Sumitomo Bakelite Semiconductor Consumables Product
Table 135. Sumitomo Bakelite Revenue in Semiconductor Consumables Business (2020-2025) & (US$ Million)
Table 136. Sumitomo Bakelite Recent Development
Table 137. Entegris Company Details
Table 138. Entegris Business Overview
Table 139. Entegris Semiconductor Consumables Product
Table 140. Entegris Revenue in Semiconductor Consumables Business (2020-2025) & (US$ Million)
Table 141. Entegris Recent Development
Table 142. Merck KGaA Company Details
Table 143. Merck KGaA Business Overview
Table 144. Merck KGaA Semiconductor Consumables Product
Table 145. Merck KGaA Revenue in Semiconductor Consumables Business (2020-2025) & (US$ Million)
Table 146. Merck KGaA Recent Development
Table 147. AT&S Company Details
Table 148. AT&S Business Overview
Table 149. AT&S Semiconductor Consumables Product
Table 150. AT&S Revenue in Semiconductor Consumables Business (2020-2025) & (US$ Million)
Table 151. AT&S Recent Development
Table 152. Photronics Company Details
Table 153. Photronics Business Overview
Table 154. Photronics Semiconductor Consumables Product
Table 155. Photronics Revenue in Semiconductor Consumables Business (2020-2025) & (US$ Million)
Table 156. Photronics Recent Development
Table 157. JSR Corporation Company Details
Table 158. JSR Corporation Business Overview
Table 159. JSR Corporation Semiconductor Consumables Product
Table 160. JSR Corporation Revenue in Semiconductor Consumables Business (2020-2025) & (US$ Million)
Table 161. JSR Corporation Recent Development
Table 162. Toppan Company Details
Table 163. Toppan Business Overview
Table 164. Toppan Semiconductor Consumables Product
Table 165. Toppan Revenue in Semiconductor Consumables Business (2020-2025) & (US$ Million)
Table 166. Toppan Recent Development
Table 167. ASE Material Company Details
Table 168. ASE Material Business Overview
Table 169. ASE Material Semiconductor Consumables Product
Table 170. ASE Material Revenue in Semiconductor Consumables Business (2020-2025) & (US$ Million)
Table 171. ASE Material Recent Development
Table 172. TOKYO OHKA KOGYO CO., LTD. (TOK) Company Details
Table 173. TOKYO OHKA KOGYO CO., LTD. (TOK) Business Overview
Table 174. TOKYO OHKA KOGYO CO., LTD. (TOK) Semiconductor Consumables Product
Table 175. TOKYO OHKA KOGYO CO., LTD. (TOK) Revenue in Semiconductor Consumables Business (2020-2025) & (US$ Million)
Table 176. TOKYO OHKA KOGYO CO., LTD. (TOK) Recent Development
Table 177. FST Corporation Company Details
Table 178. FST Corporation Business Overview
Table 179. FST Corporation Semiconductor Consumables Product
Table 180. FST Corporation Revenue in Semiconductor Consumables Business (2020-2025) & (US$ Million)
Table 181. FST Corporation Recent Development
Table 182. JX Nippon Mining & Metals Corporation Company Details
Table 183. JX Nippon Mining & Metals Corporation Business Overview
Table 184. JX Nippon Mining & Metals Corporation Semiconductor Consumables Product
Table 185. JX Nippon Mining & Metals Corporation Revenue in Semiconductor Consumables Business (2020-2025) & (US$ Million)
Table 186. JX Nippon Mining & Metals Corporation Recent Development
Table 187. Mitsui High-tec Company Details
Table 188. Mitsui High-tec Business Overview
Table 189. Mitsui High-tec Semiconductor Consumables Product
Table 190. Mitsui High-tec Revenue in Semiconductor Consumables Business (2020-2025) & (US$ Million)
Table 191. Mitsui High-tec Recent Development
Table 192. Fujifilm Company Details
Table 193. Fujifilm Business Overview
Table 194. Fujifilm Semiconductor Consumables Product
Table 195. Fujifilm Revenue in Semiconductor Consumables Business (2020-2025) & (US$ Million)
Table 196. Fujifilm Recent Development
Table 197. SK materials Company Details
Table 198. SK materials Business Overview
Table 199. SK materials Semiconductor Consumables Product
Table 200. SK materials Revenue in Semiconductor Consumables Business (2020-2025) & (US$ Million)
Table 201. SK materials Recent Development
Table 202. National Silicon Industry Group (NSIG) Company Details
Table 203. National Silicon Industry Group (NSIG) Business Overview
Table 204. National Silicon Industry Group (NSIG) Semiconductor Consumables Product
Table 205. National Silicon Industry Group (NSIG) Revenue in Semiconductor Consumables Business (2020-2025) & (US$ Million)
Table 206. National Silicon Industry Group (NSIG) Recent Development
Table 207. Zhonghuan Advanced Semiconductor Materials Company Details
Table 208. Zhonghuan Advanced Semiconductor Materials Business Overview
Table 209. Zhonghuan Advanced Semiconductor Materials Semiconductor Consumables Product
Table 210. Zhonghuan Advanced Semiconductor Materials Revenue in Semiconductor Consumables Business (2020-2025) & (US$ Million)
Table 211. Zhonghuan Advanced Semiconductor Materials Recent Development
Table 212. Wafer Works Corporation Company Details
Table 213. Wafer Works Corporation Business Overview
Table 214. Wafer Works Corporation Semiconductor Consumables Product
Table 215. Wafer Works Corporation Revenue in Semiconductor Consumables Business (2020-2025) & (US$ Million)
Table 216. Wafer Works Corporation Recent Development
Table 217. DNP Company Details
Table 218. DNP Business Overview
Table 219. DNP Semiconductor Consumables Product
Table 220. DNP Revenue in Semiconductor Consumables Business (2020-2025) & (US$ Million)
Table 221. DNP Recent Development
Table 222. HAESUNG DS Company Details
Table 223. HAESUNG DS Business Overview
Table 224. HAESUNG DS Semiconductor Consumables Product
Table 225. HAESUNG DS Revenue in Semiconductor Consumables Business (2020-2025) & (US$ Million)
Table 226. HAESUNG DS Recent Development
Table 227. Chang Wah Technology Company Details
Table 228. Chang Wah Technology Business Overview
Table 229. Chang Wah Technology Semiconductor Consumables Product
Table 230. Chang Wah Technology Revenue in Semiconductor Consumables Business (2020-2025) & (US$ Million)
Table 231. Chang Wah Technology Recent Development
Table 232. Murata Company Details
Table 233. Murata Business Overview
Table 234. Murata Semiconductor Consumables Product
Table 235. Murata Revenue in Semiconductor Consumables Business (2020-2025) & (US$ Million)
Table 236. Murata Recent Development
Table 237. Shennan Circuit Company Details
Table 238. Shennan Circuit Business Overview
Table 239. Shennan Circuit Semiconductor Consumables Product
Table 240. Shennan Circuit Revenue in Semiconductor Consumables Business (2020-2025) & (US$ Million)
Table 241. Shennan Circuit Recent Development
Table 242. Advanced Assembly Materials International Company Details
Table 243. Advanced Assembly Materials International Business Overview
Table 244. Advanced Assembly Materials International Semiconductor Consumables Product
Table 245. Advanced Assembly Materials International Revenue in Semiconductor Consumables Business (2020-2025) & (US$ Million)
Table 246. Advanced Assembly Materials International Recent Development
Table 247. Research Programs/Design for This Report
Table 248. Key Data Information from Secondary Sources
Table 249. Key Data Information from Primary Sources
Table 250. Authors List of This Report
List of Figures
Figure 1. Semiconductor Consumables Picture
Figure 2. Global Semiconductor Consumables Market Size Comparison by Type (2020-2031) & (US$ Million)
Figure 3. Global Semiconductor Consumables Market Share by Type: 2024 VS 2031
Figure 4. Wafer Manufacturing Materials Features
Figure 5. Packaging Materials Features
Figure 6. Consumable Parts for Semiconductor Equipment Features
Figure 7. Global Semiconductor Consumables Market Size by Application (2020-2031) & (US$ Million)
Figure 8. Global Semiconductor Consumables Market Share by Application: 2024 VS 2031
Figure 9. 300mm Wafer Case Studies
Figure 10. 200mm Wafer Case Studies
Figure 11. Semiconductor Consumables Report Years Considered
Figure 12. Global Semiconductor Consumables Market Size (US$ Million), Year-over-Year: 2020-2031
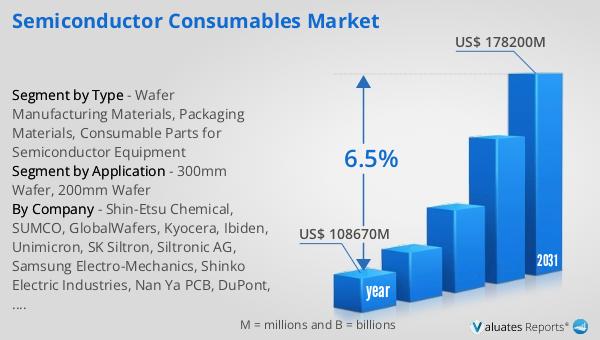
Figure 13. Global Semiconductor Consumables Market Size, (US$ Million), 2020 VS 2024 VS 2031
Figure 14. Global Semiconductor Consumables Market Share by Region: 2024 VS 2031
Figure 15. Global Semiconductor Consumables Market Share by Players in 2024
Figure 16. Global Semiconductor Consumables Market Share by Company Type (Tier 1, Tier 2, and Tier 3)
Figure 17. The Top 10 and 5 Players Market Share by Semiconductor Consumables Revenue in 2024
Figure 18. North America Semiconductor Consumables Market Size YoY Growth (2020-2031) & (US$ Million)
Figure 19. North America Semiconductor Consumables Market Share by Country (2020-2031)
Figure 20. United States Semiconductor Consumables Market Size YoY Growth (2020-2031) & (US$ Million)
Figure 21. Canada Semiconductor Consumables Market Size YoY Growth (2020-2031) & (US$ Million)
Figure 22. Europe Semiconductor Consumables Market Size YoY Growth (2020-2031) & (US$ Million)
Figure 23. Europe Semiconductor Consumables Market Share by Country (2020-2031)
Figure 24. Germany Semiconductor Consumables Market Size YoY Growth (2020-2031) & (US$ Million)
Figure 25. France Semiconductor Consumables Market Size YoY Growth (2020-2031) & (US$ Million)
Figure 26. U.K. Semiconductor Consumables Market Size YoY Growth (2020-2031) & (US$ Million)
Figure 27. Italy Semiconductor Consumables Market Size YoY Growth (2020-2031) & (US$ Million)
Figure 28. Russia Semiconductor Consumables Market Size YoY Growth (2020-2031) & (US$ Million)
Figure 29. Nordic Countries Semiconductor Consumables Market Size YoY Growth (2020-2031) & (US$ Million)
Figure 30. Asia-Pacific Semiconductor Consumables Market Size YoY Growth (2020-2031) & (US$ Million)
Figure 31. Asia-Pacific Semiconductor Consumables Market Share by Region (2020-2031)
Figure 32. China Semiconductor Consumables Market Size YoY Growth (2020-2031) & (US$ Million)
Figure 33. Japan Semiconductor Consumables Market Size YoY Growth (2020-2031) & (US$ Million)
Figure 34. South Korea Semiconductor Consumables Market Size YoY Growth (2020-2031) & (US$ Million)
Figure 35. Southeast Asia Semiconductor Consumables Market Size YoY Growth (2020-2031) & (US$ Million)
Figure 36. India Semiconductor Consumables Market Size YoY Growth (2020-2031) & (US$ Million)
Figure 37. Australia Semiconductor Consumables Market Size YoY Growth (2020-2031) & (US$ Million)
Figure 38. Latin America Semiconductor Consumables Market Size YoY Growth (2020-2031) & (US$ Million)
Figure 39. Latin America Semiconductor Consumables Market Share by Country (2020-2031)
Figure 40. Mexico Semiconductor Consumables Market Size YoY Growth (2020-2031) & (US$ Million)
Figure 41. Brazil Semiconductor Consumables Market Size YoY Growth (2020-2031) & (US$ Million)
Figure 42. Middle East & Africa Semiconductor Consumables Market Size YoY Growth (2020-2031) & (US$ Million)
Figure 43. Middle East & Africa Semiconductor Consumables Market Share by Country (2020-2031)
Figure 44. Turkey Semiconductor Consumables Market Size YoY Growth (2020-2031) & (US$ Million)
Figure 45. Saudi Arabia Semiconductor Consumables Market Size YoY Growth (2020-2031) & (US$ Million)
Figure 46. UAE Semiconductor Consumables Market Size YoY Growth (2020-2031) & (US$ Million)
Figure 47. Shin-Etsu Chemical Revenue Growth Rate in Semiconductor Consumables Business (2020-2025)
Figure 48. SUMCO Revenue Growth Rate in Semiconductor Consumables Business (2020-2025)
Figure 49. GlobalWafers Revenue Growth Rate in Semiconductor Consumables Business (2020-2025)
Figure 50. Kyocera Revenue Growth Rate in Semiconductor Consumables Business (2020-2025)
Figure 51. Ibiden Revenue Growth Rate in Semiconductor Consumables Business (2020-2025)
Figure 52. Unimicron Revenue Growth Rate in Semiconductor Consumables Business (2020-2025)
Figure 53. SK Siltron Revenue Growth Rate in Semiconductor Consumables Business (2020-2025)
Figure 54. Siltronic AG Revenue Growth Rate in Semiconductor Consumables Business (2020-2025)
Figure 55. Samsung Electro-Mechanics Revenue Growth Rate in Semiconductor Consumables Business (2020-2025)
Figure 56. Shinko Electric Industries Revenue Growth Rate in Semiconductor Consumables Business (2020-2025)
Figure 57. Nan Ya PCB Revenue Growth Rate in Semiconductor Consumables Business (2020-2025)
Figure 58. DuPont Revenue Growth Rate in Semiconductor Consumables Business (2020-2025)
Figure 59. LG InnoTek Revenue Growth Rate in Semiconductor Consumables Business (2020-2025)
Figure 60. Simmtech Revenue Growth Rate in Semiconductor Consumables Business (2020-2025)
Figure 61. Daeduck Electronics Revenue Growth Rate in Semiconductor Consumables Business (2020-2025)
Figure 62. Kinsus Interconnect Technology Revenue Growth Rate in Semiconductor Consumables Business (2020-2025)
Figure 63. Resonac Revenue Growth Rate in Semiconductor Consumables Business (2020-2025)
Figure 64. Sumitomo Bakelite Revenue Growth Rate in Semiconductor Consumables Business (2020-2025)
Figure 65. Entegris Revenue Growth Rate in Semiconductor Consumables Business (2020-2025)
Figure 66. Merck KGaA Revenue Growth Rate in Semiconductor Consumables Business (2020-2025)
Figure 67. AT&S Revenue Growth Rate in Semiconductor Consumables Business (2020-2025)
Figure 68. Photronics Revenue Growth Rate in Semiconductor Consumables Business (2020-2025)
Figure 69. JSR Corporation Revenue Growth Rate in Semiconductor Consumables Business (2020-2025)
Figure 70. Toppan Revenue Growth Rate in Semiconductor Consumables Business (2020-2025)
Figure 71. ASE Material Revenue Growth Rate in Semiconductor Consumables Business (2020-2025)
Figure 72. TOKYO OHKA KOGYO CO., LTD. (TOK) Revenue Growth Rate in Semiconductor Consumables Business (2020-2025)
Figure 73. FST Corporation Revenue Growth Rate in Semiconductor Consumables Business (2020-2025)
Figure 74. JX Nippon Mining & Metals Corporation Revenue Growth Rate in Semiconductor Consumables Business (2020-2025)
Figure 75. Mitsui High-tec Revenue Growth Rate in Semiconductor Consumables Business (2020-2025)
Figure 76. Fujifilm Revenue Growth Rate in Semiconductor Consumables Business (2020-2025)
Figure 77. SK materials Revenue Growth Rate in Semiconductor Consumables Business (2020-2025)
Figure 78. National Silicon Industry Group (NSIG) Revenue Growth Rate in Semiconductor Consumables Business (2020-2025)
Figure 79. Zhonghuan Advanced Semiconductor Materials Revenue Growth Rate in Semiconductor Consumables Business (2020-2025)
Figure 80. Wafer Works Corporation Revenue Growth Rate in Semiconductor Consumables Business (2020-2025)
Figure 81. DNP Revenue Growth Rate in Semiconductor Consumables Business (2020-2025)
Figure 82. HAESUNG DS Revenue Growth Rate in Semiconductor Consumables Business (2020-2025)
Figure 83. Chang Wah Technology Revenue Growth Rate in Semiconductor Consumables Business (2020-2025)
Figure 84. Murata Revenue Growth Rate in Semiconductor Consumables Business (2020-2025)
Figure 85. Shennan Circuit Revenue Growth Rate in Semiconductor Consumables Business (2020-2025)
Figure 86. Advanced Assembly Materials International Revenue Growth Rate in Semiconductor Consumables Business (2020-2025)
Figure 87. Bottom-up and Top-down Approaches for This Report
Figure 88. Data Triangulation
Figure 89. Key Executives Interviewed