List of Tables
Table 1. Bulk Carrier Ships Market Trends
Table 2. Bulk Carrier Ships Market Drivers & Opportunity
Table 3. Bulk Carrier Ships Market Challenges
Table 4. Bulk Carrier Ships Market Restraints
Table 5. Global Bulk Carrier Ships Revenue by Company (2020-2025) & (US$ Million)
Table 6. Global Bulk Carrier Ships Revenue Market Share by Company (2020-2025)
Table 7. Global Bulk Carrier Ships Sales Volume by Company (2020-2025) & (K Units)
Table 8. Global Bulk Carrier Ships Sales Volume Market Share by Company (2020-2025)
Table 9. Global Market Bulk Carrier Ships Price by Company (2020-2025) & (US$/Unit)
Table 10. Key Manufacturers Bulk Carrier Ships Manufacturing Base and Headquarters
Table 11. Key Manufacturers Bulk Carrier Ships Product Type
Table 12. Key Manufacturers Time to Begin Mass Production of Bulk Carrier Ships
Table 13. Global Bulk Carrier Ships Manufacturers Market Concentration Ratio (CR5 and HHI)
Table 14. Global Top Manufacturers Market Share by Company Type (Tier 1, Tier 2, and Tier 3) & (based on the Revenue in Bulk Carrier Ships as of 2024)
Table 15. Mergers & Acquisitions, Expansion Plans
Table 16. Global Bulk Carrier Ships Sales Value by Type: 2020 VS 2024 VS 2031 (US$ Million)
Table 17. Global Bulk Carrier Ships Sales Value by Type (2020-2025) & (US$ Million)
Table 18. Global Bulk Carrier Ships Sales Value by Type (2026-2031) & (US$ Million)
Table 19. Global Bulk Carrier Ships Sales Market Share in Value by Type (2020-2025)
Table 20. Global Bulk Carrier Ships Sales Market Share in Value by Type (2026-2031)
Table 21. Global Bulk Carrier Ships Sales Volume by Type: 2020 VS 2024 VS 2031 (K Units)
Table 22. Global Bulk Carrier Ships Sales Volume by Type (2020-2025) & (K Units)
Table 23. Global Bulk Carrier Ships Sales Volume by Type (2026-2031) & (K Units)
Table 24. Global Bulk Carrier Ships Sales Market Share in Volume by Type (2020-2025)
Table 25. Global Bulk Carrier Ships Sales Market Share in Volume by Type (2026-2031)
Table 26. Global Bulk Carrier Ships Price by Type (2020-2025) & (US$/Unit)
Table 27. Global Bulk Carrier Ships Price by Type (2026-2031) & (US$/Unit)
Table 28. Global Bulk Carrier Ships Sales Value by Application: 2020 VS 2024 VS 2031 (US$ Million)
Table 29. Global Bulk Carrier Ships Sales Value by Application (2020-2025) & (US$ Million)
Table 30. Global Bulk Carrier Ships Sales Value by Application (2026-2031) & (US$ Million)
Table 31. Global Bulk Carrier Ships Sales Market Share in Value by Application (2020-2025)
Table 32. Global Bulk Carrier Ships Sales Market Share in Value by Application (2026-2031)
Table 33. Global Bulk Carrier Ships Sales Volume by Application: 2020 VS 2024 VS 2031 (K Units)
Table 34. Global Bulk Carrier Ships Sales Volume by Application (2020-2025) & (K Units)
Table 35. Global Bulk Carrier Ships Sales Volume by Application (2026-2031) & (K Units)
Table 36. Global Bulk Carrier Ships Sales Market Share in Volume by Application (2020-2025)
Table 37. Global Bulk Carrier Ships Sales Market Share in Volume by Application (2026-2031)
Table 38. Global Bulk Carrier Ships Price by Application (2020-2025) & (US$/Unit)
Table 39. Global Bulk Carrier Ships Price by Application (2026-2031) & (US$/Unit)
Table 40. Global Bulk Carrier Ships Sales Value by Region, (2020 VS 2024 VS 2031) & (US$ Million)
Table 41. Global Bulk Carrier Ships Sales Value by Region (2020-2025) & (US$ Million)
Table 42. Global Bulk Carrier Ships Sales Value by Region (2026-2031) & (US$ Million)
Table 43. Global Bulk Carrier Ships Sales Value by Region (2020-2025) & (%)
Table 44. Global Bulk Carrier Ships Sales Value by Region (2026-2031) & (%)
Table 45. Global Bulk Carrier Ships Sales Volume by Region (K Units): 2020 VS 2024 VS 2031
Table 46. Global Bulk Carrier Ships Sales Volume by Region (2020-2025) & (K Units)
Table 47. Global Bulk Carrier Ships Sales Volume by Region (2026-2031) & (K Units)
Table 48. Global Bulk Carrier Ships Sales Volume by Region (2020-2025) & (%)
Table 49. Global Bulk Carrier Ships Sales Volume by Region (2026-2031) & (%)
Table 50. Global Bulk Carrier Ships Average Price by Region (2020-2025) & (US$/Unit)
Table 51. Global Bulk Carrier Ships Average Price by Region (2026-2031) & (US$/Unit)
Table 52. Key Countries/Regions Bulk Carrier Ships Sales Value Growth Trends, (US$ Million): 2020 VS 2024 VS 2031
Table 53. Key Countries/Regions Bulk Carrier Ships Sales Value, (2020-2025) & (US$ Million)
Table 54. Key Countries/Regions Bulk Carrier Ships Sales Value, (2026-2031) & (US$ Million)
Table 55. Key Countries/Regions Bulk Carrier Ships Sales Volume, (2020-2025) & (K Units)
Table 56. Key Countries/Regions Bulk Carrier Ships Sales Volume, (2026-2031) & (K Units)
Table 57. Navios Maritime Partners Company Information
Table 58. Navios Maritime Partners Introduction and Business Overview
Table 59. Navios Maritime Partners Bulk Carrier Ships Sales (K Units), Revenue (US$ Million), Price (US$/Unit) and Gross Margin (2020-2025)
Table 60. Navios Maritime Partners Bulk Carrier Ships Product Offerings
Table 61. Navios Maritime Partners Recent Development
Table 62. Eagle Bulk Shipping Inc Company Information
Table 63. Eagle Bulk Shipping Inc Introduction and Business Overview
Table 64. Eagle Bulk Shipping Inc Bulk Carrier Ships Sales (K Units), Revenue (US$ Million), Price (US$/Unit) and Gross Margin (2020-2025)
Table 65. Eagle Bulk Shipping Inc Bulk Carrier Ships Product Offerings
Table 66. Eagle Bulk Shipping Inc Recent Development
Table 67. Genco Shipping & Trading Limited Company Information
Table 68. Genco Shipping & Trading Limited Introduction and Business Overview
Table 69. Genco Shipping & Trading Limited Bulk Carrier Ships Sales (K Units), Revenue (US$ Million), Price (US$/Unit) and Gross Margin (2020-2025)
Table 70. Genco Shipping & Trading Limited Bulk Carrier Ships Product Offerings
Table 71. Genco Shipping & Trading Limited Recent Development
Table 72. Euronav Company Information
Table 73. Euronav Introduction and Business Overview
Table 74. Euronav Bulk Carrier Ships Sales (K Units), Revenue (US$ Million), Price (US$/Unit) and Gross Margin (2020-2025)
Table 75. Euronav Bulk Carrier Ships Product Offerings
Table 76. Euronav Recent Development
Table 77. Star Bulk Company Information
Table 78. Star Bulk Introduction and Business Overview
Table 79. Star Bulk Bulk Carrier Ships Sales (K Units), Revenue (US$ Million), Price (US$/Unit) and Gross Margin (2020-2025)
Table 80. Star Bulk Bulk Carrier Ships Product Offerings
Table 81. Star Bulk Recent Development
Table 82. Golden Ocean Group Ltd Company Information
Table 83. Golden Ocean Group Ltd Introduction and Business Overview
Table 84. Golden Ocean Group Ltd Bulk Carrier Ships Sales (K Units), Revenue (US$ Million), Price (US$/Unit) and Gross Margin (2020-2025)
Table 85. Golden Ocean Group Ltd Bulk Carrier Ships Product Offerings
Table 86. Golden Ocean Group Ltd Recent Development
Table 87. Castor Maritime Company Information
Table 88. Castor Maritime Introduction and Business Overview
Table 89. Castor Maritime Bulk Carrier Ships Sales (K Units), Revenue (US$ Million), Price (US$/Unit) and Gross Margin (2020-2025)
Table 90. Castor Maritime Bulk Carrier Ships Product Offerings
Table 91. Castor Maritime Recent Development
Table 92. Matson Inc Company Information
Table 93. Matson Inc Introduction and Business Overview
Table 94. Matson Inc Bulk Carrier Ships Sales (K Units), Revenue (US$ Million), Price (US$/Unit) and Gross Margin (2020-2025)
Table 95. Matson Inc Bulk Carrier Ships Product Offerings
Table 96. Matson Inc Recent Development
Table 97. Kirby Corporation Company Information
Table 98. Kirby Corporation Introduction and Business Overview
Table 99. Kirby Corporation Bulk Carrier Ships Sales (K Units), Revenue (US$ Million), Price (US$/Unit) and Gross Margin (2020-2025)
Table 100. Kirby Corporation Bulk Carrier Ships Product Offerings
Table 101. Kirby Corporation Recent Development
Table 102. Bodewes Shipyards B.V. Company Information
Table 103. Bodewes Shipyards B.V. Introduction and Business Overview
Table 104. Bodewes Shipyards B.V. Bulk Carrier Ships Sales (K Units), Revenue (US$ Million), Price (US$/Unit) and Gross Margin (2020-2025)
Table 105. Bodewes Shipyards B.V. Bulk Carrier Ships Product Offerings
Table 106. Bodewes Shipyards B.V. Recent Development
Table 107. Damen Shipyards Company Information
Table 108. Damen Shipyards Introduction and Business Overview
Table 109. Damen Shipyards Bulk Carrier Ships Sales (K Units), Revenue (US$ Million), Price (US$/Unit) and Gross Margin (2020-2025)
Table 110. Damen Shipyards Bulk Carrier Ships Product Offerings
Table 111. Damen Shipyards Recent Development
Table 112. CSBC Corporation Company Information
Table 113. CSBC Corporation Introduction and Business Overview
Table 114. CSBC Corporation Bulk Carrier Ships Sales (K Units), Revenue (US$ Million), Price (US$/Unit) and Gross Margin (2020-2025)
Table 115. CSBC Corporation Bulk Carrier Ships Product Offerings
Table 116. CSBC Corporation Recent Development
Table 117. Mitsui Engineering and Shipbuilding Company Information
Table 118. Mitsui Engineering and Shipbuilding Introduction and Business Overview
Table 119. Mitsui Engineering and Shipbuilding Bulk Carrier Ships Sales (K Units), Revenue (US$ Million), Price (US$/Unit) and Gross Margin (2020-2025)
Table 120. Mitsui Engineering and Shipbuilding Bulk Carrier Ships Product Offerings
Table 121. Mitsui Engineering and Shipbuilding Recent Development
Table 122. Hyundai Heavy Industries Company Information
Table 123. Hyundai Heavy Industries Introduction and Business Overview
Table 124. Hyundai Heavy Industries Bulk Carrier Ships Sales (K Units), Revenue (US$ Million), Price (US$/Unit) and Gross Margin (2020-2025)
Table 125. Hyundai Heavy Industries Bulk Carrier Ships Product Offerings
Table 126. Hyundai Heavy Industries Recent Development
Table 127. Barkmeijer Stroobos BV Company Information
Table 128. Barkmeijer Stroobos BV Introduction and Business Overview
Table 129. Barkmeijer Stroobos BV Bulk Carrier Ships Sales (K Units), Revenue (US$ Million), Price (US$/Unit) and Gross Margin (2020-2025)
Table 130. Barkmeijer Stroobos BV Bulk Carrier Ships Product Offerings
Table 131. Barkmeijer Stroobos BV Recent Development
Table 132. SembCorp Marine Company Information
Table 133. SembCorp Marine Introduction and Business Overview
Table 134. SembCorp Marine Bulk Carrier Ships Sales (K Units), Revenue (US$ Million), Price (US$/Unit) and Gross Margin (2020-2025)
Table 135. SembCorp Marine Bulk Carrier Ships Product Offerings
Table 136. SembCorp Marine Recent Development
Table 137. Brodosplit Company Information
Table 138. Brodosplit Introduction and Business Overview
Table 139. Brodosplit Bulk Carrier Ships Sales (K Units), Revenue (US$ Million), Price (US$/Unit) and Gross Margin (2020-2025)
Table 140. Brodosplit Bulk Carrier Ships Product Offerings
Table 141. Brodosplit Recent Development
Table 142. Cemre Shipyard Company Information
Table 143. Cemre Shipyard Introduction and Business Overview
Table 144. Cemre Shipyard Bulk Carrier Ships Sales (K Units), Revenue (US$ Million), Price (US$/Unit) and Gross Margin (2020-2025)
Table 145. Cemre Shipyard Bulk Carrier Ships Product Offerings
Table 146. Cemre Shipyard Recent Development
Table 147. MEYER WERFT Company Information
Table 148. MEYER WERFT Introduction and Business Overview
Table 149. MEYER WERFT Bulk Carrier Ships Sales (K Units), Revenue (US$ Million), Price (US$/Unit) and Gross Margin (2020-2025)
Table 150. MEYER WERFT Bulk Carrier Ships Product Offerings
Table 151. MEYER WERFT Recent Development
Table 152. Dae Sun Shipbuilding Company Information
Table 153. Dae Sun Shipbuilding Introduction and Business Overview
Table 154. Dae Sun Shipbuilding Bulk Carrier Ships Sales (K Units), Revenue (US$ Million), Price (US$/Unit) and Gross Margin (2020-2025)
Table 155. Dae Sun Shipbuilding Bulk Carrier Ships Product Offerings
Table 156. Dae Sun Shipbuilding Recent Development
Table 157. Daewoo Shipbuilding & Marine Engineering Company Information
Table 158. Daewoo Shipbuilding & Marine Engineering Introduction and Business Overview
Table 159. Daewoo Shipbuilding & Marine Engineering Bulk Carrier Ships Sales (K Units), Revenue (US$ Million), Price (US$/Unit) and Gross Margin (2020-2025)
Table 160. Daewoo Shipbuilding & Marine Engineering Bulk Carrier Ships Product Offerings
Table 161. Daewoo Shipbuilding & Marine Engineering Recent Development
Table 162. Namura Shipbuilding Company Information
Table 163. Namura Shipbuilding Introduction and Business Overview
Table 164. Namura Shipbuilding Bulk Carrier Ships Sales (K Units), Revenue (US$ Million), Price (US$/Unit) and Gross Margin (2020-2025)
Table 165. Namura Shipbuilding Bulk Carrier Ships Product Offerings
Table 166. Namura Shipbuilding Recent Development
Table 167. National Steel and Shipbuilding Company Company Information
Table 168. National Steel and Shipbuilding Company Introduction and Business Overview
Table 169. National Steel and Shipbuilding Company Bulk Carrier Ships Sales (K Units), Revenue (US$ Million), Price (US$/Unit) and Gross Margin (2020-2025)
Table 170. National Steel and Shipbuilding Company Bulk Carrier Ships Product Offerings
Table 171. National Steel and Shipbuilding Company Recent Development
Table 172. HJ Shipbuilding & Construction Company Information
Table 173. HJ Shipbuilding & Construction Introduction and Business Overview
Table 174. HJ Shipbuilding & Construction Bulk Carrier Ships Sales (K Units), Revenue (US$ Million), Price (US$/Unit) and Gross Margin (2020-2025)
Table 175. HJ Shipbuilding & Construction Bulk Carrier Ships Product Offerings
Table 176. HJ Shipbuilding & Construction Recent Development
Table 177. Imabari Shipbuilding Company Information
Table 178. Imabari Shipbuilding Introduction and Business Overview
Table 179. Imabari Shipbuilding Bulk Carrier Ships Sales (K Units), Revenue (US$ Million), Price (US$/Unit) and Gross Margin (2020-2025)
Table 180. Imabari Shipbuilding Bulk Carrier Ships Product Offerings
Table 181. Imabari Shipbuilding Recent Development
Table 182. Anhui Peida Ship Engineering Company Information
Table 183. Anhui Peida Ship Engineering Introduction and Business Overview
Table 184. Anhui Peida Ship Engineering Bulk Carrier Ships Sales (K Units), Revenue (US$ Million), Price (US$/Unit) and Gross Margin (2020-2025)
Table 185. Anhui Peida Ship Engineering Bulk Carrier Ships Product Offerings
Table 186. Anhui Peida Ship Engineering Recent Development
Table 187. K Shipbuilding Company Information
Table 188. K Shipbuilding Introduction and Business Overview
Table 189. K Shipbuilding Bulk Carrier Ships Sales (K Units), Revenue (US$ Million), Price (US$/Unit) and Gross Margin (2020-2025)
Table 190. K Shipbuilding Bulk Carrier Ships Product Offerings
Table 191. K Shipbuilding Recent Development
Table 192. Kherson Shipyard Company Information
Table 193. Kherson Shipyard Introduction and Business Overview
Table 194. Kherson Shipyard Bulk Carrier Ships Sales (K Units), Revenue (US$ Million), Price (US$/Unit) and Gross Margin (2020-2025)
Table 195. Kherson Shipyard Bulk Carrier Ships Product Offerings
Table 196. Kherson Shipyard Recent Development
Table 197. Key Raw Materials Lists
Table 198. Raw Materials Key Suppliers Lists
Table 199. Bulk Carrier Ships Downstream Customers
Table 200. Bulk Carrier Ships Distributors List
Table 201. Research Programs/Design for This Report
Table 202. Key Data Information from Secondary Sources
Table 203. Key Data Information from Primary Sources
List of Figures
Figure 1. Bulk Carrier Ships Product Picture
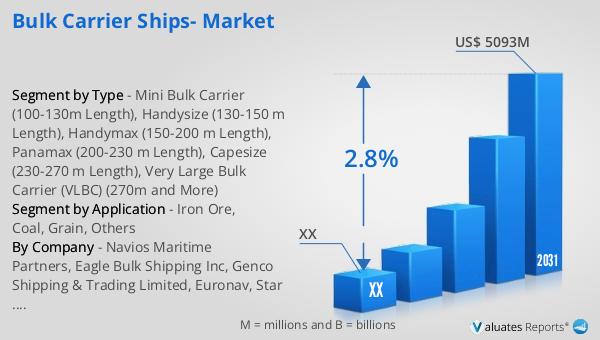
Figure 2. Global Bulk Carrier Ships Sales Value, 2020 VS 2024 VS 2031 (US$ Million)
Figure 3. Global Bulk Carrier Ships Sales Value (2020-2031) & (US$ Million)
Figure 4. Global Bulk Carrier Ships Sales Volume (2020-2031) & (K Units)
Figure 5. Global Bulk Carrier Ships Sales Price (2020-2031) & (US$/Unit)
Figure 6. Bulk Carrier Ships Report Years Considered
Figure 7. Global Bulk Carrier Ships Players Revenue Ranking (2024) & (US$ Million)
Figure 8. Global Bulk Carrier Ships Players Sales Volume Ranking (2024) & (K Units)
Figure 9. The 5 and 10 Largest Manufacturers in the World: Market Share by Bulk Carrier Ships Revenue in 2024
Figure 10. Bulk Carrier Ships Market Share by Company Type (Tier 1, Tier 2, and Tier 3): 2020 VS 2024
Figure 11. Mini Bulk Carrier (100-130m Length) Picture
Figure 12. Handysize (130-150 m Length) Picture
Figure 13. Handymax (150-200 m Length) Picture
Figure 14. Panamax (200-230 m Length) Picture
Figure 15. Capesize (230-270 m Length) Picture
Figure 16. Very Large Bulk Carrier (VLBC) (270m and More) Picture
Figure 17. Global Bulk Carrier Ships Sales Value by Type (2020 VS 2024 VS 2031) & (US$ Million)
Figure 18. Global Bulk Carrier Ships Sales Value Market Share by Type, 2024 & 2031
Figure 19. Global Bulk Carrier Ships Sales Volume by Type (2020 VS 2024 VS 2031) & (K Units)
Figure 20. Global Bulk Carrier Ships Sales Volume Market Share by Type, 2024 & 2031
Figure 21. Global Bulk Carrier Ships Price by Type (2020-2031) & (US$/Unit)
Figure 22. Product Picture of Iron Ore
Figure 23. Product Picture of Coal
Figure 24. Product Picture of Grain
Figure 25. Product Picture of Others
Figure 26. Global Bulk Carrier Ships Sales Value by Application (2020 VS 2024 VS 2031) & (US$ Million)
Figure 27. Global Bulk Carrier Ships Sales Value Market Share by Application, 2024 & 2031
Figure 28. Global Bulk Carrier Ships Sales Volume by Application (2020 VS 2024 VS 2031) & (K Units)
Figure 29. Global Bulk Carrier Ships Sales Volume Market Share by Application, 2024 & 2031
Figure 30. Global Bulk Carrier Ships Price by Application (2020-2031) & (US$/Unit)
Figure 31. North America Bulk Carrier Ships Sales Value (2020-2031) & (US$ Million)
Figure 32. North America Bulk Carrier Ships Sales Value by Country (%), 2024 VS 2031
Figure 33. Europe Bulk Carrier Ships Sales Value, (2020-2031) & (US$ Million)
Figure 34. Europe Bulk Carrier Ships Sales Value by Country (%), 2024 VS 2031
Figure 35. Asia Pacific Bulk Carrier Ships Sales Value, (2020-2031) & (US$ Million)
Figure 36. Asia Pacific Bulk Carrier Ships Sales Value by Region (%), 2024 VS 2031
Figure 37. South America Bulk Carrier Ships Sales Value, (2020-2031) & (US$ Million)
Figure 38. South America Bulk Carrier Ships Sales Value by Country (%), 2024 VS 2031
Figure 39. Middle East & Africa Bulk Carrier Ships Sales Value, (2020-2031) & (US$ Million)
Figure 40. Middle East & Africa Bulk Carrier Ships Sales Value by Country (%), 2024 VS 2031
Figure 41. Key Countries/Regions Bulk Carrier Ships Sales Value (%), (2020-2031)
Figure 42. Key Countries/Regions Bulk Carrier Ships Sales Volume (%), (2020-2031)
Figure 43. United States Bulk Carrier Ships Sales Value, (2020-2031) & (US$ Million)
Figure 44. United States Bulk Carrier Ships Sales Value by Type (%), 2024 VS 2031
Figure 45. United States Bulk Carrier Ships Sales Value by Application (%), 2024 VS 2031
Figure 46. Europe Bulk Carrier Ships Sales Value, (2020-2031) & (US$ Million)
Figure 47. Europe Bulk Carrier Ships Sales Value by Type (%), 2024 VS 2031
Figure 48. Europe Bulk Carrier Ships Sales Value by Application (%), 2024 VS 2031
Figure 49. China Bulk Carrier Ships Sales Value, (2020-2031) & (US$ Million)
Figure 50. China Bulk Carrier Ships Sales Value by Type (%), 2024 VS 2031
Figure 51. China Bulk Carrier Ships Sales Value by Application (%), 2024 VS 2031
Figure 52. Japan Bulk Carrier Ships Sales Value, (2020-2031) & (US$ Million)
Figure 53. Japan Bulk Carrier Ships Sales Value by Type (%), 2024 VS 2031
Figure 54. Japan Bulk Carrier Ships Sales Value by Application (%), 2024 VS 2031
Figure 55. South Korea Bulk Carrier Ships Sales Value, (2020-2031) & (US$ Million)
Figure 56. South Korea Bulk Carrier Ships Sales Value by Type (%), 2024 VS 2031
Figure 57. South Korea Bulk Carrier Ships Sales Value by Application (%), 2024 VS 2031
Figure 58. Southeast Asia Bulk Carrier Ships Sales Value, (2020-2031) & (US$ Million)
Figure 59. Southeast Asia Bulk Carrier Ships Sales Value by Type (%), 2024 VS 2031
Figure 60. Southeast Asia Bulk Carrier Ships Sales Value by Application (%), 2024 VS 2031
Figure 61. India Bulk Carrier Ships Sales Value, (2020-2031) & (US$ Million)
Figure 62. India Bulk Carrier Ships Sales Value by Type (%), 2024 VS 2031
Figure 63. India Bulk Carrier Ships Sales Value by Application (%), 2024 VS 2031
Figure 64. Bulk Carrier Ships Industrial Chain
Figure 65. Bulk Carrier Ships Manufacturing Cost Structure
Figure 66. Channels of Distribution (Direct Sales, and Distribution)
Figure 67. Bottom-up and Top-down Approaches for This Report
Figure 68. Data Triangulation
Figure 69. Key Executives Interviewed