0
U.S. (TOLL FREE)
+1 (315) 215-3225
Automative

0
U.S. (TOLL FREE)
+1 (315) 215-3225
Global Calcitriol Drug Market Research Report 2026
Published Date: 2026-01-08
|
Report Code: QYRE-Auto-25L11385
Home | Market Reports | Business & Industrial| Pharmaceuticals & Biotech
Global Calcitriol Drug Market Research Report 2022
BUY CHAPTERS

Global Calcitriol Drug Market Research Report 2026

Code: QYRE-Auto-25L11385
Report
2026-01-08
Pages:143
QYResearch
Buy Now with 15% Discount
DESCRIPTION
TABLE OF CONTENT
TABLES & FIGURES

Calcitriol Drug Market Size

The global Calcitriol Drug market was valued at US$ 380 million in 2025 and is anticipated to reach US$ 485 million by 2032, at a CAGR of 3.7% from 2026 to 2032.

Calcitriol Drug Market

Calcitriol Drug Market

The 2025 U.S. tariff policies introduce profound uncertainty into the global economic landscape. This report critically examines the implications of recent tariff adjustments and international strategic countermeasures on Calcitriol Drug competitive dynamics, regional economic interdependencies, and supply chain reconfigurations.
Calcitriol Drug is the hormonally active vitamin D medicine used in prescription care to raise or stabilize calcium and phosphate balance and to reduce inappropriate parathyroid hormone signaling, which makes it strategically important in renal mineral bone management, endocrine calcium disorders, and a narrower set of dermatology needs. Commercially, it is delivered as tightly controlled high potency products rather than high tonnage commodities, with the core traded forms concentrated in oral capsules and oral solution for outpatient dispensing, injectable solution for supervised renal and dialysis settings, and topical ointment for plaque psoriasis treatment pathways. Upstream supply depends on GMP grade synthesis and finishing, potent compound handling, validated analytical methods, and stability protected packaging, because micro dose accuracy and impurity control largely determine clinical risk and regulatory acceptability. Downstream, purchasing is governed by reimbursement and formulary mechanics more than discretionary demand, with the dominant buyer ecosystems spanning hospital and dialysis provider networks, outpatient prescribers in nephrology and endocrinology, dermatology clinics for topical use, and large pharmacy channels that negotiate supply under national reimbursement listings, hospital tenders, group purchasing contracts, and annual framework agreements focused on continuity of supply, batch traceability, and pharmacovigilance responsibilities.
In the current market, global production is around 1980 million standard unit, with an average selling price of about 0.19 USD per standard unit EXW basis. The supplier landscape is moderately concentrated, with CR5 at about 48% of global revenue, reflecting the fact that many companies can list the molecule, but fewer can sustain multi market compliance, reliable batch release, and uninterrupted supply across multiple dosage forms. Oral capsule and capsule related formats account for most standard unit volume and a large share of value, while injectable products carry a smaller unit count but typically have stronger unit economics because sterile manufacturing and supervised channel requirements raise qualification and supply assurance costs. Topical ointment remains structurally distinct, tied to dermatology prescribing patterns and specific labeling boundaries, so its demand cadence and channel mix differ from renal and endocrine use. Typical procurement behavior reinforces these splits: outpatient oral products move through retail and specialty pharmacy contracting and generic substitution, injectable products are pulled through hospital or dialysis supply pathways with tighter stocking discipline, and topical products are influenced by dermatology formulary placement and patient adherence patterns. A reasonable gross margin estimate for established compliant suppliers is 27%, supported by barriers such as potent quality systems, regulatory filing maintenance, stability and serialization controls, and switching friction created by payer rules and formulary review cycles.
Calcitriol Drug demand is expected to evolve steadily rather than surge, with the primary tailwinds coming from aging populations, sustained chronic kidney disease and dialysis case loads, and more guideline driven management of mineral bone disorder and related hypocalcemia conditions. Policy and compliance forces will continue to shape where value accrues, especially through reference pricing, tender reforms, and substitution rules that can redistribute share between brands and generics even when treated patient counts rise. Technology progress in this market is less about new molecular innovation and more about manufacturing and supply chain execution, including tighter lot release analytics, end to end traceability, and inventory resilience for low volume high potency batches. AI adoption is most likely to appear as demand sensing, supply planning, and safety signal detection across pharma operations and healthcare systems, improving service levels and adherence without changing the underlying chemistry. The most practical constraints remain the cost and rigor of maintaining validated potent manufacturing and testing, the compliance burden and capacity discipline required for sterile supply, and reimbursement driven price pressure that can discourage aggressive capacity expansion unless suppliers can lock in multi year contracts and predictable volumes.
This report delivers a comprehensive overview of the global Calcitriol Drug market, with both quantitative and qualitative analyses, to help readers develop growth strategies, assess the competitive landscape, evaluate their position in the current market, and make informed business decisions regarding Calcitriol Drug. The Calcitriol Drug market size, estimates, and forecasts are provided in terms of sales volume (K Units) and revenue (US$ millions), with 2025 as the base year and historical and forecast data for 2021–2032.
The report segments the global Calcitriol Drug market comprehensively. Regional market sizes by Dosage Form, by Application, by Route of Administration, and by company are also provided. For deeper insight, the report profiles the competitive landscape, key competitors, and their respective market rankings, and discusses technological trends and new product developments.
This report will assist Calcitriol Drug manufacturers, new entrants, and companies across the industry value chain with information on revenues, sales volume, and average prices for the overall market and its sub-segments, by company, by Dosage Form, by Application, and by region.
Market Segmentation

Scope of Calcitriol Drug Market Report

Report Metric Details
Report Name Calcitriol Drug Market
Accounted market size in 2025 US$ 380 million
Forecasted market size in 2032 US$ 485 million
CAGR 3.7%
Base Year 2025
Forecasted years 2026 - 2032
Segment by Dosage Form
  • Capsule
  • Injectable
  • Oral Solution
  • Topical Ointment
  • Others
Segment by Route of Administration
  • Oral
  • Parenteral
  • Topical
  • Others
Segment by Care Setting
  • Hospital Use
  • Retail Pharmacy
  • Specialty Pharmacy
  • Others
by Application
  • Chronic Kidney Disease Mineral Bone Disorder
  • Dialysis Associated Hypocalcemia
  • Hypoparathyroidism and Related Disorders
  • Osteoporosis and Metabolic Bone Disorders
  • Plaque Psoriasis
  • Rickets and Genetic Phosphate Disorders
  • Others
Consumption by Region
  • North America (United States, Canada)
  • Europe (Germany, France, UK, Italy, Russia)
  • Asia-Pacific (China, Japan, South Korea, Taiwan)
  • Southeast Asia (India)
  • Latin America (Mexico, Brazil)
By Company Roche, Teva, Kyowa Kirin, Strides, Sichuan Guowei Pharma, Qingdao Guoxin Pharma, NC FARMA, Henan Taifeng Biotech, Bionpharma, Emcure, Pharmanovia, Pharmaidea, Dermapharm, Hanmi, Mega Lifesciences, Rising Pharma, Abbott, Zydus, Atnahs, Nanjing Hairong Pharma, Rubio, Kalbe, Hikma, Macleods, Fuji Seiyaku Kogyo
Forecast units USD million in value
Report coverage Revenue and volume forecast, company share, competitive landscape, growth factors and trends

Chapter Outline

  • Chapter 1: Defines the scope of the report and presents an executive summary of market segments (by Dosage Form, by Application, by Route of Administration, etc.), including the size of each segment and its future growth potential. It offers a high-level view of the current market and its likely evolution in the short, medium, and long term.
  • Chapter 2: Provides a detailed analysis of the competitive landscape for Calcitriol Drug manufacturers, covering pricing, sales and revenue shares, latest development plans, and mergers and acquisitions.
  • Chapter 3: Examines Calcitriol Drug sales and revenue at the regional and country levels. It quantifies market size and growth potential for each region and its key countries, and outlines market development, outlook, addressable space, and national market size.
  • Chapter 4: Analyzes segments by Dosage Form, detailing the size and growth potential of each segment to help readers identify “blue ocean” opportunities.
  • Chapter 5: Analyzes market segments by Application, covering the size and growth potential of each segment to help readers identify “blue ocean” opportunities in downstream markets.
  • Chapter 6: Profiles key players, presenting core information on leading companies, including product sales, revenue, pricing, gross margin, product portfolio/introductions, and recent developments.
  • Chapter 7: Reviews the industry value chain, including upstream and downstream segments.
  • Chapter 8: Discusses market dynamics and recent developments, including drivers, restraints, challenges and risks for manufacturers, U.S. Tariffs and relevant policy analysis.
  • Chapter 9: Summarizes the key findings and conclusions of the report.

FAQ for this report

How fast is Calcitriol Drug Market growing?

Ans: The Calcitriol Drug Market witnessing a CAGR of 3.7% during the forecast period 2026-2032.

What is the Calcitriol Drug Market size in 2032?

Ans: The Calcitriol Drug Market size in 2032 will be US$ 485 million.

Who are the main players in the Calcitriol Drug Market report?

Ans: The main players in the Calcitriol Drug Market are Roche, Teva, Kyowa Kirin, Strides, Sichuan Guowei Pharma, Qingdao Guoxin Pharma, NC FARMA, Henan Taifeng Biotech, Bionpharma, Emcure, Pharmanovia, Pharmaidea, Dermapharm, Hanmi, Mega Lifesciences, Rising Pharma, Abbott, Zydus, Atnahs, Nanjing Hairong Pharma, Rubio, Kalbe, Hikma, Macleods, Fuji Seiyaku Kogyo

What are the Application segmentation covered in the Calcitriol Drug Market report?

Ans: The Applications covered in the Calcitriol Drug Market report are Chronic Kidney Disease Mineral Bone Disorder, Dialysis Associated Hypocalcemia, Hypoparathyroidism and Related Disorders, Osteoporosis and Metabolic Bone Disorders, Plaque Psoriasis, Rickets and Genetic Phosphate Disorders, Others

1 Calcitriol Drug Market Overview
1.1 Product Definition
1.2 Calcitriol Drug by Dosage Form
1.2.1 Global Calcitriol Drug Market Value by Dosage Form: 2025 vs 2032
1.2.2 Capsule
1.2.3 Injectable
1.2.4 Oral Solution
1.2.5 Topical Ointment
1.2.6 Others
1.3 Calcitriol Drug by Route of Administration
1.3.1 Global Calcitriol Drug Market Value by Route of Administration: 2025 vs 2032
1.3.2 Oral
1.3.3 Parenteral
1.3.4 Topical
1.3.5 Others
1.4 Calcitriol Drug by Care Setting
1.4.1 Global Calcitriol Drug Market Value by Care Setting: 2025 vs 2032
1.4.2 Hospital Use
1.4.3 Retail Pharmacy
1.4.4 Specialty Pharmacy
1.4.5 Others
1.5 Calcitriol Drug by Application
1.5.1 Global Calcitriol Drug Market Value by Application: 2025 vs 2032
1.5.2 Chronic Kidney Disease Mineral Bone Disorder
1.5.3 Dialysis Associated Hypocalcemia
1.5.4 Hypoparathyroidism and Related Disorders
1.5.5 Osteoporosis and Metabolic Bone Disorders
1.5.6 Plaque Psoriasis
1.5.7 Rickets and Genetic Phosphate Disorders
1.5.8 Others
1.6 Global Calcitriol Drug Market Size Estimates and Forecasts
1.6.1 Global Calcitriol Drug Revenue 2021–2032
1.6.2 Global Calcitriol Drug Sales 2021–2032
1.6.3 Global Calcitriol Drug Market Average Price (2021–2032)
1.7 Assumptions and Limitations
2 Calcitriol Drug Market Competition by Manufacturers
2.1 Global Calcitriol Drug Sales Market Share by Manufacturers (2021–2026)
2.2 Global Calcitriol Drug Revenue Market Share by Manufacturers (2021–2026)
2.3 Global Calcitriol Drug Average Price by Manufacturers (2021–2026)
2.4 Global Key Players of Calcitriol Drug, Industry Ranking, 2023 vs 2024 vs 2025
2.5 Global Key Manufacturers of Calcitriol Drug, Manufacturing Sites and Headquarters
2.6 Global Key Manufacturers of Calcitriol Drug, Product Types and Applications
2.7 Global Key Manufacturers of Calcitriol Drug, Date of Entry into the Industry
2.8 Global Calcitriol Drug Market Competitive Situation and Trends
2.8.1 Global Calcitriol Drug Market Concentration Rate
2.8.2 The Top 5 and Top 10 Global Calcitriol Drug Players Market Share by Revenue
2.8.3 Global Calcitriol Drug Market Share by Company Tier (Tier 1, Tier 2, Tier 3)
2.9 Manufacturers Mergers & Acquisitions, Expansion Plans
3 Global Calcitriol Drug Market Scenario by Region
3.1 Global Calcitriol Drug Market Size by Region: 2021 vs 2025 vs 2032
3.2 Global Calcitriol Drug Sales by Region: 2021–2032
3.2.1 Global Calcitriol Drug Sales by Region: 2021–2026
3.2.2 Global Calcitriol Drug Sales by Region: 2027–2032
3.3 Global Calcitriol Drug Revenue by Region: 2021–2032
3.3.1 Global Calcitriol Drug Revenue by Region: 2021–2026
3.3.2 Global Calcitriol Drug Revenue by Region: 2027–2032
3.4 North America Calcitriol Drug Market Facts & Figures by Country
3.4.1 North America Calcitriol Drug Market Size by Country: 2021 vs 2025 vs 2032
3.4.2 North America Calcitriol Drug Sales by Country (2021–2032)
3.4.3 North America Calcitriol Drug Revenue by Country (2021–2032)
3.4.4 United States
3.4.5 Canada
3.5 Europe Calcitriol Drug Market Facts & Figures by Country
3.5.1 Europe Calcitriol Drug Market Size by Country: 2021 vs 2025 vs 2032
3.5.2 Europe Calcitriol Drug Sales by Country (2021–2032)
3.5.3 Europe Calcitriol Drug Revenue by Country (2021–2032)
3.5.4 Germany
3.5.5 France
3.5.6 U.K.
3.5.7 Italy
3.5.8 Russia
3.6 Asia Pacific Calcitriol Drug Market Facts & Figures by Region
3.6.1 Asia Pacific Calcitriol Drug Market Size by Region: 2021 vs 2025 vs 2032
3.6.2 Asia Pacific Calcitriol Drug Sales by Region (2021–2032)
3.6.3 Asia Pacific Calcitriol Drug Revenue by Region (2021–2032)
3.6.4 China
3.6.5 Japan
3.6.6 South Korea
3.6.7 India
3.6.8 Australia
3.6.9 China Taiwan
3.6.10 Indonesia
3.6.11 Thailand
3.6.12 Malaysia
3.7 Latin America Calcitriol Drug Market Facts & Figures by Country
3.7.1 Latin America Calcitriol Drug Market Size by Country: 2021 vs 2025 vs 2032
3.7.2 Latin America Calcitriol Drug Sales by Country (2021–2032)
3.7.3 Latin America Calcitriol Drug Revenue by Country (2021–2032)
3.7.4 Mexico
3.7.5 Brazil
3.7.6 Argentina
3.8 Middle East and Africa Calcitriol Drug Market Facts & Figures by Country
3.8.1 Middle East and Africa Calcitriol Drug Market Size by Country: 2021 vs 2025 vs 2032
3.8.2 Middle East and Africa Calcitriol Drug Sales by Country (2021–2032)
3.8.3 Middle East and Africa Calcitriol Drug Revenue by Country (2021–2032)
3.8.4 Turkey
3.8.5 Saudi Arabia
3.8.6 UAE
4 Segment by Dosage Form
4.1 Global Calcitriol Drug Sales by Dosage Form (2021–2032)
4.1.1 Global Calcitriol Drug Sales by Dosage Form (2021–2026)
4.1.2 Global Calcitriol Drug Sales by Dosage Form (2027–2032)
4.1.3 Global Calcitriol Drug Sales Market Share by Dosage Form (2021–2032)
4.2 Global Calcitriol Drug Revenue by Dosage Form (2021–2032)
4.2.1 Global Calcitriol Drug Revenue by Dosage Form (2021–2026)
4.2.2 Global Calcitriol Drug Revenue by Dosage Form (2027–2032)
4.2.3 Global Calcitriol Drug Revenue Market Share by Dosage Form (2021–2032)
4.3 Global Calcitriol Drug Price by Dosage Form (2021–2032)
5 Segment by Application
5.1 Global Calcitriol Drug Sales by Application (2021–2032)
5.1.1 Global Calcitriol Drug Sales by Application (2021–2026)
5.1.2 Global Calcitriol Drug Sales by Application (2027–2032)
5.1.3 Global Calcitriol Drug Sales Market Share by Application (2021–2032)
5.2 Global Calcitriol Drug Revenue by Application (2021–2032)
5.2.1 Global Calcitriol Drug Revenue by Application (2021–2026)
5.2.2 Global Calcitriol Drug Revenue by Application (2027–2032)
5.2.3 Global Calcitriol Drug Revenue Market Share by Application (2021–2032)
5.3 Global Calcitriol Drug Price by Application (2021–2032)
6 Key Companies Profiled
6.1 Roche
6.1.1 Roche Company Information
6.1.2 Roche Description and Business Overview
6.1.3 Roche Calcitriol Drug Sales, Revenue, and Gross Margin (2021–2026)
6.1.4 Roche Calcitriol Drug Product Portfolio
6.1.5 Roche Recent Developments/Updates
6.2 Teva
6.2.1 Teva Company Information
6.2.2 Teva Description and Business Overview
6.2.3 Teva Calcitriol Drug Sales, Revenue, and Gross Margin (2021–2026)
6.2.4 Teva Calcitriol Drug Product Portfolio
6.2.5 Teva Recent Developments/Updates
6.3 Kyowa Kirin
6.3.1 Kyowa Kirin Company Information
6.3.2 Kyowa Kirin Description and Business Overview
6.3.3 Kyowa Kirin Calcitriol Drug Sales, Revenue, and Gross Margin (2021–2026)
6.3.4 Kyowa Kirin Calcitriol Drug Product Portfolio
6.3.5 Kyowa Kirin Recent Developments/Updates
6.4 Strides
6.4.1 Strides Company Information
6.4.2 Strides Description and Business Overview
6.4.3 Strides Calcitriol Drug Sales, Revenue, and Gross Margin (2021–2026)
6.4.4 Strides Calcitriol Drug Product Portfolio
6.4.5 Strides Recent Developments/Updates
6.5 Sichuan Guowei Pharma
6.5.1 Sichuan Guowei Pharma Company Information
6.5.2 Sichuan Guowei Pharma Description and Business Overview
6.5.3 Sichuan Guowei Pharma Calcitriol Drug Sales, Revenue, and Gross Margin (2021–2026)
6.5.4 Sichuan Guowei Pharma Calcitriol Drug Product Portfolio
6.5.5 Sichuan Guowei Pharma Recent Developments/Updates
6.6 Qingdao Guoxin Pharma
6.6.1 Qingdao Guoxin Pharma Company Information
6.6.2 Qingdao Guoxin Pharma Description and Business Overview
6.6.3 Qingdao Guoxin Pharma Calcitriol Drug Sales, Revenue, and Gross Margin (2021–2026)
6.6.4 Qingdao Guoxin Pharma Calcitriol Drug Product Portfolio
6.6.5 Qingdao Guoxin Pharma Recent Developments/Updates
6.7 NC FARMA
6.7.1 NC FARMA Company Information
6.7.2 NC FARMA Description and Business Overview
6.7.3 NC FARMA Calcitriol Drug Sales, Revenue, and Gross Margin (2021–2026)
6.7.4 NC FARMA Calcitriol Drug Product Portfolio
6.7.5 NC FARMA Recent Developments/Updates
6.8 Henan Taifeng Biotech
6.8.1 Henan Taifeng Biotech Company Information
6.8.2 Henan Taifeng Biotech Description and Business Overview
6.8.3 Henan Taifeng Biotech Calcitriol Drug Sales, Revenue, and Gross Margin (2021–2026)
6.8.4 Henan Taifeng Biotech Calcitriol Drug Product Portfolio
6.8.5 Henan Taifeng Biotech Recent Developments/Updates
6.9 Bionpharma
6.9.1 Bionpharma Company Information
6.9.2 Bionpharma Description and Business Overview
6.9.3 Bionpharma Calcitriol Drug Sales, Revenue, and Gross Margin (2021–2026)
6.9.4 Bionpharma Calcitriol Drug Product Portfolio
6.9.5 Bionpharma Recent Developments/Updates
6.10 Emcure
6.10.1 Emcure Company Information
6.10.2 Emcure Description and Business Overview
6.10.3 Emcure Calcitriol Drug Sales, Revenue, and Gross Margin (2021–2026)
6.10.4 Emcure Calcitriol Drug Product Portfolio
6.10.5 Emcure Recent Developments/Updates
6.11 Pharmanovia
6.11.1 Pharmanovia Company Information
6.11.2 Pharmanovia Description and Business Overview
6.11.3 Pharmanovia Calcitriol Drug Sales, Revenue, and Gross Margin (2021–2026)
6.11.4 Pharmanovia Calcitriol Drug Product Portfolio
6.11.5 Pharmanovia Recent Developments/Updates
6.12 Pharmaidea
6.12.1 Pharmaidea Company Information
6.12.2 Pharmaidea Description and Business Overview
6.12.3 Pharmaidea Calcitriol Drug Sales, Revenue, and Gross Margin (2021–2026)
6.12.4 Pharmaidea Calcitriol Drug Product Portfolio
6.12.5 Pharmaidea Recent Developments/Updates
6.13 Dermapharm
6.13.1 Dermapharm Company Information
6.13.2 Dermapharm Description and Business Overview
6.13.3 Dermapharm Calcitriol Drug Sales, Revenue, and Gross Margin (2021–2026)
6.13.4 Dermapharm Calcitriol Drug Product Portfolio
6.13.5 Dermapharm Recent Developments/Updates
6.14 Hanmi
6.14.1 Hanmi Company Information
6.14.2 Hanmi Description and Business Overview
6.14.3 Hanmi Calcitriol Drug Sales, Revenue, and Gross Margin (2021–2026)
6.14.4 Hanmi Calcitriol Drug Product Portfolio
6.14.5 Hanmi Recent Developments/Updates
6.15 Mega Lifesciences
6.15.1 Mega Lifesciences Company Information
6.15.2 Mega Lifesciences Description and Business Overview
6.15.3 Mega Lifesciences Calcitriol Drug Sales, Revenue, and Gross Margin (2021–2026)
6.15.4 Mega Lifesciences Calcitriol Drug Product Portfolio
6.15.5 Mega Lifesciences Recent Developments/Updates
6.16 Rising Pharma
6.16.1 Rising Pharma Company Information
6.16.2 Rising Pharma Description and Business Overview
6.16.3 Rising Pharma Calcitriol Drug Sales, Revenue, and Gross Margin (2021–2026)
6.16.4 Rising Pharma Calcitriol Drug Product Portfolio
6.16.5 Rising Pharma Recent Developments/Updates
6.17 Abbott
6.17.1 Abbott Company Information
6.17.2 Abbott Description and Business Overview
6.17.3 Abbott Calcitriol Drug Sales, Revenue, and Gross Margin (2021–2026)
6.17.4 Abbott Calcitriol Drug Product Portfolio
6.17.5 Abbott Recent Developments/Updates
6.18 Zydus
6.18.1 Zydus Company Information
6.18.2 Zydus Description and Business Overview
6.18.3 Zydus Calcitriol Drug Sales, Revenue, and Gross Margin (2021–2026)
6.18.4 Zydus Calcitriol Drug Product Portfolio
6.18.5 Zydus Recent Developments/Updates
6.19 Atnahs
6.19.1 Atnahs Company Information
6.19.2 Atnahs Description and Business Overview
6.19.3 Atnahs Calcitriol Drug Sales, Revenue, and Gross Margin (2021–2026)
6.19.4 Atnahs Calcitriol Drug Product Portfolio
6.19.5 Atnahs Recent Developments/Updates
6.20 Nanjing Hairong Pharma
6.20.1 Nanjing Hairong Pharma Company Information
6.20.2 Nanjing Hairong Pharma Description and Business Overview
6.20.3 Nanjing Hairong Pharma Calcitriol Drug Sales, Revenue, and Gross Margin (2021–2026)
6.20.4 Nanjing Hairong Pharma Calcitriol Drug Product Portfolio
6.20.5 Nanjing Hairong Pharma Recent Developments/Updates
6.21 Rubio
6.21.1 Rubio Company Information
6.21.2 Rubio Description and Business Overview
6.21.3 Rubio Calcitriol Drug Sales, Revenue, and Gross Margin (2021–2026)
6.21.4 Rubio Calcitriol Drug Product Portfolio
6.21.5 Rubio Recent Developments/Updates
6.22 Kalbe
6.22.1 Kalbe Company Information
6.22.2 Kalbe Description and Business Overview
6.22.3 Kalbe Calcitriol Drug Sales, Revenue, and Gross Margin (2021–2026)
6.22.4 Kalbe Calcitriol Drug Product Portfolio
6.22.5 Kalbe Recent Developments/Updates
6.23 Hikma
6.23.1 Hikma Company Information
6.23.2 Hikma Description and Business Overview
6.23.3 Hikma Calcitriol Drug Sales, Revenue, and Gross Margin (2021–2026)
6.23.4 Hikma Calcitriol Drug Product Portfolio
6.23.5 Hikma Recent Developments/Updates
6.24 Macleods
6.24.1 Macleods Company Information
6.24.2 Macleods Description and Business Overview
6.24.3 Macleods Calcitriol Drug Sales, Revenue, and Gross Margin (2021–2026)
6.24.4 Macleods Calcitriol Drug Product Portfolio
6.24.5 Macleods Recent Developments/Updates
6.25 Fuji Seiyaku Kogyo
6.25.1 Fuji Seiyaku Kogyo Company Information
6.25.2 Fuji Seiyaku Kogyo Description and Business Overview
6.25.3 Fuji Seiyaku Kogyo Calcitriol Drug Sales, Revenue, and Gross Margin (2021–2026)
6.25.4 Fuji Seiyaku Kogyo Calcitriol Drug Product Portfolio
6.25.5 Fuji Seiyaku Kogyo Recent Developments/Updates
7 Industry Chain and Sales Channels Analysis
7.1 Calcitriol Drug Industry Chain Analysis
7.2 Calcitriol Drug Raw Material Supply Analysis
7.2.1 Key Raw Materials
7.2.2 Raw Materials Key Suppliers
7.3 Calcitriol Drug Production Mode & Process Analysis
7.4 Calcitriol Drug Sales and Marketing
7.4.1 Calcitriol Drug Sales Channels
7.4.2 Calcitriol Drug Distributors
7.5 Calcitriol Drug Customer Analysis
8 Calcitriol Drug Market Dynamics
8.1 Calcitriol Drug Industry Trends
8.2 Calcitriol Drug Market Drivers
8.3 Calcitriol Drug Market Challenges
8.4 Calcitriol Drug Market Restraints
8.5 Impact of U.S. Tariffs
9 Research Findings and Conclusion
10 Methodology and Data Source
10.1 Methodology/Research Approach
10.1.1 Research Programs/Design
10.1.2 Market Size Estimation
10.1.3 Market Breakdown and Data Triangulation
10.2 Data Source
10.2.1 Secondary Sources
10.2.2 Primary Sources
10.3 Author List
10.4 Disclaimer
List of Tables
 Table 1. Global Calcitriol Drug Market Value by Dosage Form (US$ Million), 2025 vs 2032
 Table 2. Global Calcitriol Drug Market Value by Route of Administration (US$ Million), 2025 vs 2032
 Table 3. Global Calcitriol Drug Market Value by Care Setting (US$ Million), 2025 vs 2032
 Table 4. Global Calcitriol Drug Market Value by Application (US$ Million), 2025 vs 2032
 Table 5. Global Calcitriol Drug Market Competitive Situation by Manufacturers in 2025
 Table 6. Global Calcitriol Drug Sales (K Units) of Key Manufacturers (2021–2026)
 Table 7. Global Calcitriol Drug Sales Market Share by Manufacturers (2021–2026)
 Table 8. Global Calcitriol Drug Revenue (US$ Million) by Manufacturers (2021–2026)
 Table 9. Global Calcitriol Drug Revenue Share by Manufacturers (2021–2026)
 Table 10. Global Market Calcitriol Drug Average Price (US$/Unit) of Key Manufacturers (2021–2026)
 Table 11. Global Key Players of Calcitriol Drug, Industry Ranking, 2023 vs 2024 vs 2025
 Table 12. Global Key Manufacturers of Calcitriol Drug, Manufacturing Sites and Headquarters
 Table 13. Global Key Manufacturers of Calcitriol Drug, Product Types and Applications
 Table 14. Global Key Manufacturers of Calcitriol Drug, Date of Entry into the Industry
 Table 15. Global Manufacturers Market Concentration Ratio (CR5 and HHI)
 Table 16. Global Calcitriol Drug Companies by Tier (Tier 1, Tier 2, Tier 3), based on Calcitriol Drug Revenue, 2025
 Table 17. Manufacturers Mergers & Acquisitions, Expansion Plans
 Table 18. Global Calcitriol Drug Market Size by Region (US$ Million): 2021 vs 2025 vs 2032
 Table 19. Global Calcitriol Drug Sales by Region (K Units), 2021–2026
 Table 20. Global Calcitriol Drug Sales Market Share by Region (2021–2026)
 Table 21. Global Calcitriol Drug Sales by Region (K Units), 2027–2032
 Table 22. Global Calcitriol Drug Sales Market Share by Region (2027–2032)
 Table 23. Global Calcitriol Drug Revenue by Region (US$ Million), 2021–2026
 Table 24. Global Calcitriol Drug Revenue Market Share by Region (2021–2026)
 Table 25. Global Calcitriol Drug Revenue by Region (US$ Million), 2027–2032
 Table 26. Global Calcitriol Drug Revenue Market Share by Region (2027–2032)
 Table 27. North America Calcitriol Drug Revenue by Country: 2021 vs 2025 vs 2032 (US$ Million)
 Table 28. North America Calcitriol Drug Sales by Country (K Units), 2021–2026
 Table 29. North America Calcitriol Drug Sales by Country (K Units), 2027–2032
 Table 30. North America Calcitriol Drug Revenue by Country (US$ Million), 2021–2026
 Table 31. North America Calcitriol Drug Revenue by Country (US$ Million), 2027–2032
 Table 32. Europe Calcitriol Drug Revenue by Country: 2021 vs 2025 vs 2032 (US$ Million)
 Table 33. Europe Calcitriol Drug Sales by Country (K Units), 2021–2026
 Table 34. Europe Calcitriol Drug Sales by Country (K Units), 2027–2032
 Table 35. Europe Calcitriol Drug Revenue by Country (US$ Million), 2021–2026
 Table 36. Europe Calcitriol Drug Revenue by Country (US$ Million), 2027–2032
 Table 37. Asia Pacific Calcitriol Drug Revenue by Region: 2021 vs 2025 vs 2032 (US$ Million)
 Table 38. Asia Pacific Calcitriol Drug Sales by Region (K Units), 2021–2026
 Table 39. Asia Pacific Calcitriol Drug Sales by Region (K Units), 2027–2032
 Table 40. Asia Pacific Calcitriol Drug Revenue by Region (US$ Million), 2021–2026
 Table 41. Asia Pacific Calcitriol Drug Revenue by Region (US$ Million), 2027–2032
 Table 42. Latin America Calcitriol Drug Revenue by Country: 2021 vs 2025 vs 2032 (US$ Million)
 Table 43. Latin America Calcitriol Drug Sales by Country (K Units), 2021–2026
 Table 44. Latin America Calcitriol Drug Sales by Country (K Units), 2027–2032
 Table 45. Latin America Calcitriol Drug Revenue by Country (US$ Million), 2021–2026
 Table 46. Latin America Calcitriol Drug Revenue by Country (US$ Million), 2027–2032
 Table 47. Middle East and Africa Calcitriol Drug Revenue by Country: 2021 vs 2025 vs 2032 (US$ Million)
 Table 48. Middle East and Africa Calcitriol Drug Sales by Country (K Units), 2021–2026
 Table 49. Middle East and Africa Calcitriol Drug Sales by Country (K Units), 2027–2032
 Table 50. Middle East and Africa Calcitriol Drug Revenue by Country (US$ Million), 2021–2026
 Table 51. Middle East and Africa Calcitriol Drug Revenue by Country (US$ Million), 2027–2032
 Table 52. Global Calcitriol Drug Sales (K Units) by Dosage Form (2021–2026)
 Table 53. Global Calcitriol Drug Sales (K Units) by Dosage Form (2027–2032)
 Table 54. Global Calcitriol Drug Sales Market Share by Dosage Form (2021–2026)
 Table 55. Global Calcitriol Drug Sales Market Share by Dosage Form (2027–2032)
 Table 56. Global Calcitriol Drug Revenue (US$ Million) by Dosage Form (2021–2026)
 Table 57. Global Calcitriol Drug Revenue (US$ Million) by Dosage Form (2027–2032)
 Table 58. Global Calcitriol Drug Revenue Market Share by Dosage Form (2021–2026)
 Table 59. Global Calcitriol Drug Revenue Market Share by Dosage Form (2027–2032)
 Table 60. Global Calcitriol Drug Price (US$/Unit) by Dosage Form (2021–2026)
 Table 61. Global Calcitriol Drug Price (US$/Unit) by Dosage Form (2027–2032)
 Table 62. Global Calcitriol Drug Sales (K Units) by Application (2021–2026)
 Table 63. Global Calcitriol Drug Sales (K Units) by Application (2027–2032)
 Table 64. Global Calcitriol Drug Sales Market Share by Application (2021–2026)
 Table 65. Global Calcitriol Drug Sales Market Share by Application (2027–2032)
 Table 66. Global Calcitriol Drug Revenue (US$ Million) by Application (2021–2026)
 Table 67. Global Calcitriol Drug Revenue (US$ Million) by Application (2027–2032)
 Table 68. Global Calcitriol Drug Revenue Market Share by Application (2021–2026)
 Table 69. Global Calcitriol Drug Revenue Market Share by Application (2027–2032)
 Table 70. Global Calcitriol Drug Price (US$/Unit) by Application (2021–2026)
 Table 71. Global Calcitriol Drug Price (US$/Unit) by Application (2027–2032)
 Table 72. Roche Company Information
 Table 73. Roche Description and Business Overview
 Table 74. Roche Calcitriol Drug Sales (K Units), Revenue (US$ Million), Price (US$/Unit), and Gross Margin (2021–2026)
 Table 75. Roche Calcitriol Drug Product
 Table 76. Roche Recent Developments/Updates
 Table 77. Teva Company Information
 Table 78. Teva Description and Business Overview
 Table 79. Teva Calcitriol Drug Sales (K Units), Revenue (US$ Million), Price (US$/Unit), and Gross Margin (2021–2026)
 Table 80. Teva Calcitriol Drug Product
 Table 81. Teva Recent Developments/Updates
 Table 82. Kyowa Kirin Company Information
 Table 83. Kyowa Kirin Description and Business Overview
 Table 84. Kyowa Kirin Calcitriol Drug Sales (K Units), Revenue (US$ Million), Price (US$/Unit), and Gross Margin (2021–2026)
 Table 85. Kyowa Kirin Calcitriol Drug Product
 Table 86. Kyowa Kirin Recent Developments/Updates
 Table 87. Strides Company Information
 Table 88. Strides Description and Business Overview
 Table 89. Strides Calcitriol Drug Sales (K Units), Revenue (US$ Million), Price (US$/Unit), and Gross Margin (2021–2026)
 Table 90. Strides Calcitriol Drug Product
 Table 91. Strides Recent Developments/Updates
 Table 92. Sichuan Guowei Pharma Company Information
 Table 93. Sichuan Guowei Pharma Description and Business Overview
 Table 94. Sichuan Guowei Pharma Calcitriol Drug Sales (K Units), Revenue (US$ Million), Price (US$/Unit), and Gross Margin (2021–2026)
 Table 95. Sichuan Guowei Pharma Calcitriol Drug Product
 Table 96. Sichuan Guowei Pharma Recent Developments/Updates
 Table 97. Qingdao Guoxin Pharma Company Information
 Table 98. Qingdao Guoxin Pharma Description and Business Overview
 Table 99. Qingdao Guoxin Pharma Calcitriol Drug Sales (K Units), Revenue (US$ Million), Price (US$/Unit), and Gross Margin (2021–2026)
 Table 100. Qingdao Guoxin Pharma Calcitriol Drug Product
 Table 101. Qingdao Guoxin Pharma Recent Developments/Updates
 Table 102. NC FARMA Company Information
 Table 103. NC FARMA Description and Business Overview
 Table 104. NC FARMA Calcitriol Drug Sales (K Units), Revenue (US$ Million), Price (US$/Unit), and Gross Margin (2021–2026)
 Table 105. NC FARMA Calcitriol Drug Product
 Table 106. NC FARMA Recent Developments/Updates
 Table 107. Henan Taifeng Biotech Company Information
 Table 108. Henan Taifeng Biotech Description and Business Overview
 Table 109. Henan Taifeng Biotech Calcitriol Drug Sales (K Units), Revenue (US$ Million), Price (US$/Unit), and Gross Margin (2021–2026)
 Table 110. Henan Taifeng Biotech Calcitriol Drug Product
 Table 111. Henan Taifeng Biotech Recent Developments/Updates
 Table 112. Bionpharma Company Information
 Table 113. Bionpharma Description and Business Overview
 Table 114. Bionpharma Calcitriol Drug Sales (K Units), Revenue (US$ Million), Price (US$/Unit), and Gross Margin (2021–2026)
 Table 115. Bionpharma Calcitriol Drug Product
 Table 116. Bionpharma Recent Developments/Updates
 Table 117. Emcure Company Information
 Table 118. Emcure Description and Business Overview
 Table 119. Emcure Calcitriol Drug Sales (K Units), Revenue (US$ Million), Price (US$/Unit), and Gross Margin (2021–2026)
 Table 120. Emcure Calcitriol Drug Product
 Table 121. Emcure Recent Developments/Updates
 Table 122. Pharmanovia Company Information
 Table 123. Pharmanovia Description and Business Overview
 Table 124. Pharmanovia Calcitriol Drug Sales (K Units), Revenue (US$ Million), Price (US$/Unit), and Gross Margin (2021–2026)
 Table 125. Pharmanovia Calcitriol Drug Product
 Table 126. Pharmanovia Recent Developments/Updates
 Table 127. Pharmaidea Company Information
 Table 128. Pharmaidea Description and Business Overview
 Table 129. Pharmaidea Calcitriol Drug Sales (K Units), Revenue (US$ Million), Price (US$/Unit), and Gross Margin (2021–2026)
 Table 130. Pharmaidea Calcitriol Drug Product
 Table 131. Pharmaidea Recent Developments/Updates
 Table 132. Dermapharm Company Information
 Table 133. Dermapharm Description and Business Overview
 Table 134. Dermapharm Calcitriol Drug Sales (K Units), Revenue (US$ Million), Price (US$/Unit), and Gross Margin (2021–2026)
 Table 135. Dermapharm Calcitriol Drug Product
 Table 136. Dermapharm Recent Developments/Updates
 Table 137. Hanmi Company Information
 Table 138. Hanmi Description and Business Overview
 Table 139. Hanmi Calcitriol Drug Sales (K Units), Revenue (US$ Million), Price (US$/Unit), and Gross Margin (2021–2026)
 Table 140. Hanmi Calcitriol Drug Product
 Table 141. Hanmi Recent Developments/Updates
 Table 142. Mega Lifesciences Company Information
 Table 143. Mega Lifesciences Description and Business Overview
 Table 144. Mega Lifesciences Calcitriol Drug Sales (K Units), Revenue (US$ Million), Price (US$/Unit), and Gross Margin (2021–2026)
 Table 145. Mega Lifesciences Calcitriol Drug Product
 Table 146. Mega Lifesciences Recent Developments/Updates
 Table 147. Rising Pharma Company Information
 Table 148. Rising Pharma Description and Business Overview
 Table 149. Rising Pharma Calcitriol Drug Sales (K Units), Revenue (US$ Million), Price (US$/Unit), and Gross Margin (2021–2026)
 Table 150. Rising Pharma Calcitriol Drug Product
 Table 151. Rising Pharma Recent Developments/Updates
 Table 152. Abbott Company Information
 Table 153. Abbott Description and Business Overview
 Table 154. Abbott Calcitriol Drug Sales (K Units), Revenue (US$ Million), Price (US$/Unit), and Gross Margin (2021–2026)
 Table 155. Abbott Calcitriol Drug Product
 Table 156. Abbott Recent Developments/Updates
 Table 157. Zydus Company Information
 Table 158. Zydus Description and Business Overview
 Table 159. Zydus Calcitriol Drug Sales (K Units), Revenue (US$ Million), Price (US$/Unit), and Gross Margin (2021–2026)
 Table 160. Zydus Calcitriol Drug Product
 Table 161. Zydus Recent Developments/Updates
 Table 162. Atnahs Company Information
 Table 163. Atnahs Description and Business Overview
 Table 164. Atnahs Calcitriol Drug Sales (K Units), Revenue (US$ Million), Price (US$/Unit), and Gross Margin (2021–2026)
 Table 165. Atnahs Calcitriol Drug Product
 Table 166. Atnahs Recent Developments/Updates
 Table 167. Nanjing Hairong Pharma Company Information
 Table 168. Nanjing Hairong Pharma Description and Business Overview
 Table 169. Nanjing Hairong Pharma Calcitriol Drug Sales (K Units), Revenue (US$ Million), Price (US$/Unit), and Gross Margin (2021–2026)
 Table 170. Nanjing Hairong Pharma Calcitriol Drug Product
 Table 171. Nanjing Hairong Pharma Recent Developments/Updates
 Table 172. Rubio Company Information
 Table 173. Rubio Description and Business Overview
 Table 174. Rubio Calcitriol Drug Sales (K Units), Revenue (US$ Million), Price (US$/Unit), and Gross Margin (2021–2026)
 Table 175. Rubio Calcitriol Drug Product
 Table 176. Rubio Recent Developments/Updates
 Table 177. Kalbe Company Information
 Table 178. Kalbe Description and Business Overview
 Table 179. Kalbe Calcitriol Drug Sales (K Units), Revenue (US$ Million), Price (US$/Unit), and Gross Margin (2021–2026)
 Table 180. Kalbe Calcitriol Drug Product
 Table 181. Kalbe Recent Developments/Updates
 Table 182. Hikma Company Information
 Table 183. Hikma Description and Business Overview
 Table 184. Hikma Calcitriol Drug Sales (K Units), Revenue (US$ Million), Price (US$/Unit), and Gross Margin (2021–2026)
 Table 185. Hikma Calcitriol Drug Product
 Table 186. Hikma Recent Developments/Updates
 Table 187. Macleods Company Information
 Table 188. Macleods Description and Business Overview
 Table 189. Macleods Calcitriol Drug Sales (K Units), Revenue (US$ Million), Price (US$/Unit), and Gross Margin (2021–2026)
 Table 190. Macleods Calcitriol Drug Product
 Table 191. Macleods Recent Developments/Updates
 Table 192. Fuji Seiyaku Kogyo Company Information
 Table 193. Fuji Seiyaku Kogyo Description and Business Overview
 Table 194. Fuji Seiyaku Kogyo Calcitriol Drug Sales (K Units), Revenue (US$ Million), Price (US$/Unit), and Gross Margin (2021–2026)
 Table 195. Fuji Seiyaku Kogyo Calcitriol Drug Product
 Table 196. Fuji Seiyaku Kogyo Recent Developments/Updates
 Table 197. Key Raw Materials Lists
 Table 198. Raw Materials Key Suppliers Lists
 Table 199. Calcitriol Drug Distributors List
 Table 200. Calcitriol Drug Customers List
 Table 201. Calcitriol Drug Market Trends
 Table 202. Calcitriol Drug Market Drivers
 Table 203. Calcitriol Drug Market Challenges
 Table 204. Calcitriol Drug Market Restraints
 Table 205. Research Programs/Design for This Report
 Table 206. Key Data Information from Secondary Sources
 Table 207. Key Data Information from Primary Sources
 Table 208. Authors List of This Report


List of Figures
 Figure 1. Product Picture of Calcitriol Drug
 Figure 2. Global Calcitriol Drug Market Value by Dosage Form (US$ Million), 2021–2032
 Figure 3. Global Calcitriol Drug Market Share by Dosage Form: 2025 & 2032
 Figure 4. Capsule Product Picture
 Figure 5. Injectable Product Picture
 Figure 6. Oral Solution Product Picture
 Figure 7. Topical Ointment Product Picture
 Figure 8. Others Product Picture
 Figure 9. Global Calcitriol Drug Market Value by Route of Administration (US$ Million), 2021–2032
 Figure 10. Global Calcitriol Drug Market Share by Route of Administration: 2025 vs 2032
 Figure 11. Oral Product Picture
 Figure 12. Parenteral Product Picture
 Figure 13. Topical Product Picture
 Figure 14. Others Product Picture
 Figure 15. Global Calcitriol Drug Market Value by Care Setting (US$ Million), 2021–2032
 Figure 16. Global Calcitriol Drug Market Share by Care Setting: 2025 vs 2032
 Figure 17. Hospital Use Product Picture
 Figure 18. Retail Pharmacy Product Picture
 Figure 19. Specialty Pharmacy Product Picture
 Figure 20. Others Product Picture
 Figure 21. Global Calcitriol Drug Market Value by Application (US$ Million), 2021–2032
 Figure 22. Global Calcitriol Drug Market Share by Application: 2025 & 2032
 Figure 23. Chronic Kidney Disease Mineral Bone Disorder
 Figure 24. Dialysis Associated Hypocalcemia
 Figure 25. Hypoparathyroidism and Related Disorders
 Figure 26. Osteoporosis and Metabolic Bone Disorders
 Figure 27. Plaque Psoriasis
 Figure 28. Rickets and Genetic Phosphate Disorders
 Figure 29. Others
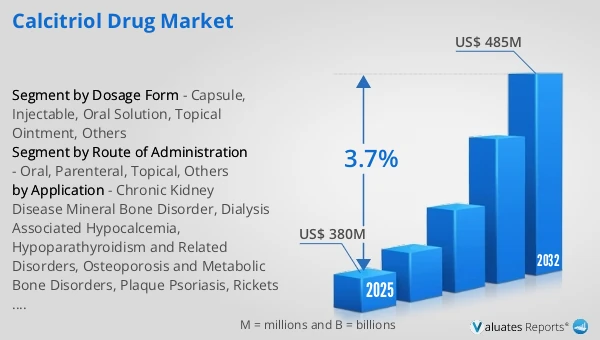
 Figure 30. Global Calcitriol Drug Revenue, (US$ Million), 2021 vs 2025 vs 2032
 Figure 31. Global Calcitriol Drug Market Size (US$ Million), 2021–2032
 Figure 32. Global Calcitriol Drug Sales (K Units), 2021–2032
 Figure 33. Global Calcitriol Drug Average Price (US$/Unit), 2021–2032
 Figure 34. Calcitriol Drug Report Years Considered
 Figure 35. Calcitriol Drug Sales Share by Manufacturers in 2025
 Figure 36. Global Calcitriol Drug Revenue Share by Manufacturers in 2025
 Figure 37. Top 5 and Top 10 Global Calcitriol Drug Players: Market Share by Revenue in Calcitriol Drug in 2025
 Figure 38. Calcitriol Drug Market Share by Company Type (Tier 1, Tier 2, and Tier 3): 2021 vs 2025
 Figure 39. Global Calcitriol Drug Market Size by Region (US$ Million): 2021 vs 2025 vs 2032
 Figure 40. North America Calcitriol Drug Sales Market Share by Country (2021–2032)
 Figure 41. North America Calcitriol Drug Revenue Market Share by Country (2021–2032)
 Figure 42. United States Calcitriol Drug Revenue Growth Rate (US$ Million), 2021–2032
 Figure 43. Canada Calcitriol Drug Revenue Growth Rate (US$ Million), 2021–2032
 Figure 44. Europe Calcitriol Drug Sales Market Share by Country (2021–2032)
 Figure 45. Europe Calcitriol Drug Revenue Market Share by Country (2021–2032)
 Figure 46. Germany Calcitriol Drug Revenue Growth Rate (US$ Million), 2021–2032
 Figure 47. France Calcitriol Drug Revenue Growth Rate (US$ Million), 2021–2032
 Figure 48. U.K. Calcitriol Drug Revenue Growth Rate (US$ Million), 2021–2032
 Figure 49. Italy Calcitriol Drug Revenue Growth Rate (US$ Million), 2021–2032
 Figure 50. Russia Calcitriol Drug Revenue Growth Rate (US$ Million), 2021–2032
 Figure 51. Asia Pacific Calcitriol Drug Sales Market Share by Region (2021–2032)
 Figure 52. Asia Pacific Calcitriol Drug Revenue Market Share by Region (2021–2032)
 Figure 53. China Calcitriol Drug Revenue Growth Rate (US$ Million), 2021–2032
 Figure 54. Japan Calcitriol Drug Revenue Growth Rate (US$ Million), 2021–2032
 Figure 55. South Korea Calcitriol Drug Revenue Growth Rate (US$ Million), 2021–2032
 Figure 56. India Calcitriol Drug Revenue Growth Rate (US$ Million), 2021–2032
 Figure 57. Australia Calcitriol Drug Revenue Growth Rate (US$ Million), 2021–2032
 Figure 58. China Taiwan Calcitriol Drug Revenue Growth Rate (US$ Million), 2021–2032
 Figure 59. Indonesia Calcitriol Drug Revenue Growth Rate (US$ Million), 2021–2032
 Figure 60. Thailand Calcitriol Drug Revenue Growth Rate (US$ Million), 2021–2032
 Figure 61. Malaysia Calcitriol Drug Revenue Growth Rate (US$ Million), 2021–2032
 Figure 62. Latin America Calcitriol Drug Sales Market Share by Country (2021–2032)
 Figure 63. Latin America Calcitriol Drug Revenue Market Share by Country (2021–2032)
 Figure 64. Mexico Calcitriol Drug Revenue Growth Rate (US$ Million), 2021–2032
 Figure 65. Brazil Calcitriol Drug Revenue Growth Rate (US$ Million), 2021–2032
 Figure 66. Argentina Calcitriol Drug Revenue Growth Rate (US$ Million), 2021–2032
 Figure 67. Middle East and Africa Calcitriol Drug Sales Market Share by Country (2021–2032)
 Figure 68. Middle East and Africa Calcitriol Drug Revenue Market Share by Country (2021–2032)
 Figure 69. Turkey Calcitriol Drug Revenue Growth Rate (US$ Million), 2021–2032
 Figure 70. Saudi Arabia Calcitriol Drug Revenue Growth Rate (US$ Million), 2021–2032
 Figure 71. UAE Calcitriol Drug Revenue Growth Rate (US$ Million), 2021–2032
 Figure 72. Global Sales Market Share of Calcitriol Drug by Dosage Form (2021–2032)
 Figure 73. Global Revenue Market Share of Calcitriol Drug by Dosage Form (2021–2032)
 Figure 74. Global Calcitriol Drug Price (US$/Unit) by Dosage Form (2021–2032)
 Figure 75. Global Sales Market Share of Calcitriol Drug by Application (2021–2032)
 Figure 76. Global Revenue Market Share of Calcitriol Drug by Application (2021–2032)
 Figure 77. Global Calcitriol Drug Price (US$/Unit) by Application (2021–2032)
 Figure 78. Calcitriol Drug Value Chain
 Figure 79. Channels of Distribution (Direct Vs Distribution)
 Figure 80. Bottom-up and Top-down Approaches for This Report
 Figure 81. Data Triangulation
 Figure 82. Key Executives Interviewed
SELECT A FORMAT
Added to Cart
Electronic

$2900

Single User License
Electronic

$4350

Multi User License
Electronic

$5800

Enterprise License
Add to Cart
Buy Now (15% Discount)

OUR CUSTOMER

Lukasiewicz Research Network