0
U.S. (TOLL FREE)
+1 (315) 215-3225
Automative

0
U.S. (TOLL FREE)
+1 (315) 215-3225
Global In-House Training Services Market Research Report 2026
Published Date: 2026-02-09
|
Report Code: QYRE-Auto-25O19969
Home | Market Reports | Business & Industrial| Business Operations
Global In House Training Services Market Research Report 2026
BUY CHAPTERS

Global In-House Training Services Market Research Report 2026

Code: QYRE-Auto-25O19969
Report
2026-02-09
Pages:122
QYResearch
Buy Now with 15% Discount
DESCRIPTION
TABLE OF CONTENT
TABLES & FIGURES

In-House Training Services Market Size

The global In-House Training Services market was valued at US$ 1028 million in 2025 and is anticipated to reach US$ 1375 million by 2032, at a CAGR of 4.3% from 2026 to 2032.

In-House Training Services Market

In-House Training Services Market

Internal training services refer to learning and development activities designed, implemented, and managed by enterprises to systematically improve employees' knowledge, skills, and professional qualities in order to achieve organizational strategic goals. It goes far beyond scattered courses; it's a complete closed loop encompassing strategic needs analysis, curriculum design, instructor resource matching, training implementation, and effectiveness evaluation and transformation. This service can be led by the enterprise's internal training department or outsourced to external professional organizations. Its core value lies in accurately translating corporate strategy and business needs into employee capabilities. Its content covers not only professional and general skills but also corporate culture promotion and compliance and safety training. An excellent internal training system is a core talent engine for enterprises to cope with change, maintain competitiveness, and drive innovation, directly related to the continuous building of organizational capabilities and the healthy development of the talent pipeline.
The internal training service market has broad prospects and is currently in a critical stage of accelerated transformation from a "cost center" to a "strategic investment" and "value creation center." The core driving forces are the rigid demand for continuous enterprise change in the VUCA era, the urgency of digital and artificial intelligence technologies reshaping talent skills, and the strategic consensus of regarding "talent development" as a core competency. In the future, this service will exhibit four major development trends: First, deep technological integration, with learning management systems, AI coaches, and virtual reality simulation training becoming standard features, achieving a highly immersive and personalized learning experience; second, agile and scenario-based content, with training becoming more closely aligned with specific business scenarios and immediate problem-solving, and micro-learning and project-based learning becoming mainstream; third, tangible results, with training evaluation shifting from satisfaction to quantitative measurement of business performance, behavioral changes, and ROI; and fourth, a service ecosystem, with one-stop solutions integrating content, technology, data, and consulting becoming more popular. The overall market will continue to grow and evolve towards greater specialization, digitalization, and intelligence.
This report delivers a comprehensive overview of the global In-House Training Services market, with both quantitative and qualitative analyses, to help readers develop growth strategies, assess the competitive landscape, evaluate their position in the current market, and make informed business decisions regarding In-House Training Services. The In-House Training Services market size, estimates, and forecasts are provided in terms of revenue (US$ millions), with 2025 as the base year and historical and forecast data for 2021–2032.
The report segments the global In-House Training Services market comprehensively. Regional market sizes by Core Training Content, by Application, by Service Providers, and by player are also provided. For deeper insight, the report profiles the competitive landscape, key competitors, and their respective market rankings, and discusses technological trends and new product developments.
This report will assist In-House Training Services manufacturers, new entrants, and companies across the industry value chain with information on revenues, sales volume, and average prices for the overall market and its sub-segments, by company, by Core Training Content, by Application, and by region.
Market Segmentation

Scope of In-House Training Services Market Report

Report Metric Details
Report Name In-House Training Services Market
Accounted market size in 2025 US$ 1028 million
Forecasted market size in 2032 US$ 1375 million
CAGR 4.3%
Base Year 2025
Forecasted years 2026 - 2032
Segment by Core Training Content
  • Self-construction and Implementation by Enterprises
  • External Procurement of Courses and Instructors
  • Blended Services Combining Internal and External Resources
  • Corporate University/Academy Model
Segment by Service Providers
  • Self-construction and Implementation by Enterprises
  • External Procurement of Courses and Instructors
  • Blended Services Combining Internal and External Resources
  • Corporate University/Academy Model
Segment by Learning Technology Formats
  • Traditional Face-to-Face Training
  • Digital Online Learning
  • Blended Learning
Segment by Application
  • Manufacturing
  • Industrial
  • Automobile
  • Finance
  • Food
  • Chemicals
  • Others
By Region
  • North America (United States, Canada)
  • Europe (Germany, France, UK, Italy, Russia) Rest of Europe
  • Nordic Countries
  • Asia-Pacific (China, Japan, South Korea)
  • Southeast Asia (India, Australia)
  • Rest of Asia
  • Latin America (Mexico, Brazil)
  • Rest of Latin America
  • Middle East & Africa (Turkey, Saudi Arabia, UAE, Rest of MEA)
By Company ALC Group, The In House Training Company, Questamon, IT Governance USA, Rainmaker, Expressions Partnership, InCorp Services, IATA, Fleming Events, Pixieset, ExperTeach GmbH, Mercia Group, The Training Centre, Kaizen, Food Safety & Quality Services, IPI Academy
Forecast units USD million in value
Report coverage Revenue and volume forecast, company share, competitive landscape, growth factors and trends

Chapter Outline

  • Chapter 1: Defines the scope of the report and presents an executive summary of market segments (by Core Training Content, by Application, by Service Providers, etc.), including the size of each segment and its future growth potential. It offers a high-level view of the current market and its likely evolution in the short, medium, and long term.
  • Chapter 2: Summarizes global and regional market size and outlines market dynamics and recent developments, including key drivers, restraints, challenges and risks for industry participants, and relevant policy analysis.
  • Chapter 3: Provides a detailed view of the competitive landscape for In-House Training Services companies, covering revenue share, development plans, and mergers and acquisitions.
  • Chapter 4: Analyzes segments by Core Training Content, detailing the size and growth potential of each segment to help readers identify blue-ocean opportunities.
  • Chapter 5: Analyzes segments by Application, detailing the size and growth potential of each downstream segment to help readers identify blue-ocean opportunities.
  • Chapter 6–10: Regional deep dives (North America, Europe, Asia Pacific, Latin America, Middle East & Africa) broken down by country. Each chapter quantifies market size and growth potential by region and key countries, and outlines market development, outlook, addressable space, and capacity.
  • Chapter 11: Profiles key players, presenting essential information on leading companies, including product/ service offerings, revenue, gross margin, product introductions/portfolios, recent developments, etc.
  • Chapter 12: Key findings and conclusions of the report.

FAQ for this report

How fast is In-House Training Services Market growing?

Ans: The In-House Training Services Market witnessing a CAGR of 4.3% during the forecast period 2026-2032.

What is the In-House Training Services Market size in 2032?

Ans: The In-House Training Services Market size in 2032 will be US$ 1375 million.

Who are the main players in the In-House Training Services Market report?

Ans: The main players in the In-House Training Services Market are ALC Group, The In House Training Company, Questamon, IT Governance USA, Rainmaker, Expressions Partnership, InCorp Services, IATA, Fleming Events, Pixieset, ExperTeach GmbH, Mercia Group, The Training Centre, Kaizen, Food Safety & Quality Services, IPI Academy

What are the Application segmentation covered in the In-House Training Services Market report?

Ans: The Applications covered in the In-House Training Services Market report are Manufacturing, Industrial, Automobile, Finance, Food, Chemicals, Others

1 Report Overview
1.1 Study Scope
1.2 Market Analysis by Core Training Content
1.2.1 Global In-House Training Services Market Size Growth Rate by Core Training Content: 2021 vs 2025 vs 2032
1.2.2 Self-construction and Implementation by Enterprises
1.2.3 External Procurement of Courses and Instructors
1.2.4 Blended Services Combining Internal and External Resources
1.2.5 Corporate University/Academy Model
1.3 Market by Service Providers
1.3.1 Global In-House Training Services Market Size Growth Rate by Service Providers: 2021 vs 2025 vs 2032
1.3.2 Self-construction and Implementation by Enterprises
1.3.3 External Procurement of Courses and Instructors
1.3.4 Blended Services Combining Internal and External Resources
1.3.5 Corporate University/Academy Model
1.4 Market by Learning Technology Formats
1.4.1 Global In-House Training Services Market Size Growth Rate by Learning Technology Formats: 2021 vs 2025 vs 2032
1.4.2 Traditional Face-to-Face Training
1.4.3 Digital Online Learning
1.4.4 Blended Learning
1.5 Market by Application
1.5.1 Global In-House Training Services Market Growth by Application: 2021 vs 2025 vs 2032
1.5.2 Manufacturing
1.5.3 Industrial
1.5.4 Automobile
1.5.5 Finance
1.5.6 Food
1.5.7 Chemicals
1.5.8 Others
1.6 Assumptions and Limitations
1.7 Study Objectives
1.8 Years Considered
2 Global Growth Trends
2.1 Global In-House Training Services Market Perspective (2021–2032)
2.2 Global In-House Training Services Growth Trends by Region
2.2.1 Global In-House Training Services Market Size by Region: 2021 vs 2025 vs 2032
2.2.2 In-House Training Services Historic Market Size by Region (2021–2026)
2.2.3 In-House Training Services Forecasted Market Size by Region (2027–2032)
2.3 In-House Training Services Market Dynamics
2.3.1 In-House Training Services Industry Trends
2.3.2 In-House Training Services Market Drivers
2.3.3 In-House Training Services Market Challenges
2.3.4 In-House Training Services Market Restraints
3 Competition Landscape by Key Players
3.1 Global Top In-House Training Services Players by Revenue
3.1.1 Global Top In-House Training Services Players by Revenue (2021–2026)
3.1.2 Global In-House Training Services Revenue Market Share by Players (2021–2026)
3.2 Global Top In-House Training Services Players Market Share by Company Tier (Tier 1, Tier 2, Tier 3)
3.3 Global Key Players Ranking by In-House Training Services Revenue
3.4 Global In-House Training Services Market Concentration Ratio
3.4.1 Global In-House Training Services Market Concentration Ratio (CR5 and HHI)
3.4.2 Global Top 10 and Top 5 Companies by In-House Training Services Revenue in 2025
3.5 Global Key Players of In-House Training Services Head Offices and Areas Served
3.6 Global Key Players of In-House Training Services, Products and Applications
3.7 Global Key Players of In-House Training Services, Date of General Availability (GA)
3.8 Mergers and Acquisitions, Expansion Plans
4 In-House Training Services Breakdown Data by Core Training Content
4.1 Global In-House Training Services Historic Market Size by Core Training Content (2021–2026)
4.2 Global In-House Training Services Forecasted Market Size by Core Training Content (2027–2032)
5 In-House Training Services Breakdown Data by Application
5.1 Global In-House Training Services Historic Market Size by Application (2021–2026)
5.2 Global In-House Training Services Forecasted Market Size by Application (2027–2032)
6 North America
6.1 North America In-House Training Services Market Size (2021–2032)
6.2 North America In-House Training Services Market Growth Rate by Country: 2021 vs 2025 vs 2032
6.3 North America In-House Training Services Market Size by Country (2021–2026)
6.4 North America In-House Training Services Market Size by Country (2027–2032)
6.5 United States
6.6 Canada
7 Europe
7.1 Europe In-House Training Services Market Size (2021–2032)
7.2 Europe In-House Training Services Market Growth Rate by Country: 2021 vs 2025 vs 2032
7.3 Europe In-House Training Services Market Size by Country (2021–2026)
7.4 Europe In-House Training Services Market Size by Country (2027–2032)
7.5 Germany
7.6 France
7.7 U.K.
7.8 Italy
7.9 Russia
7.10 Ireland
8 Asia-Pacific
8.1 Asia-Pacific In-House Training Services Market Size (2021–2032)
8.2 Asia-Pacific In-House Training Services Market Growth Rate by Region: 2021 vs 2025 vs 2032
8.3 Asia-Pacific In-House Training Services Market Size by Region (2021–2026)
8.4 Asia-Pacific In-House Training Services Market Size by Region (2027–2032)
8.5 China
8.6 Japan
8.7 South Korea
8.8 Southeast Asia
8.9 India
8.10 Australia & New Zealand
9 Latin America
9.1 Latin America In-House Training Services Market Size (2021–2032)
9.2 Latin America In-House Training Services Market Growth Rate by Country: 2021 vs 2025 vs 2032
9.3 Latin America In-House Training Services Market Size by Country (2021–2026)
9.4 Latin America In-House Training Services Market Size by Country (2027–2032)
9.5 Mexico
9.6 Brazil
10 Middle East & Africa
10.1 Middle East & Africa In-House Training Services Market Size (2021–2032)
10.2 Middle East & Africa In-House Training Services Market Growth Rate by Country: 2021 vs 2025 vs 2032
10.3 Middle East & Africa In-House Training Services Market Size by Country (2021–2026)
10.4 Middle East & Africa In-House Training Services Market Size by Country (2027–2032)
10.5 Israel
10.6 Saudi Arabia
10.7 UAE
11 Key Players Profiles
11.1 ALC Group
11.1.1 ALC Group Company Details
11.1.2 ALC Group Business Overview
11.1.3 ALC Group In-House Training Services Introduction
11.1.4 ALC Group Revenue in In-House Training Services Business (2021–2026)
11.1.5 ALC Group Recent Development
11.2 The In House Training Company
11.2.1 The In House Training Company Company Details
11.2.2 The In House Training Company Business Overview
11.2.3 The In House Training Company In-House Training Services Introduction
11.2.4 The In House Training Company Revenue in In-House Training Services Business (2021–2026)
11.2.5 The In House Training Company Recent Development
11.3 Questamon
11.3.1 Questamon Company Details
11.3.2 Questamon Business Overview
11.3.3 Questamon In-House Training Services Introduction
11.3.4 Questamon Revenue in In-House Training Services Business (2021–2026)
11.3.5 Questamon Recent Development
11.4 IT Governance USA
11.4.1 IT Governance USA Company Details
11.4.2 IT Governance USA Business Overview
11.4.3 IT Governance USA In-House Training Services Introduction
11.4.4 IT Governance USA Revenue in In-House Training Services Business (2021–2026)
11.4.5 IT Governance USA Recent Development
11.5 Rainmaker
11.5.1 Rainmaker Company Details
11.5.2 Rainmaker Business Overview
11.5.3 Rainmaker In-House Training Services Introduction
11.5.4 Rainmaker Revenue in In-House Training Services Business (2021–2026)
11.5.5 Rainmaker Recent Development
11.6 Expressions Partnership
11.6.1 Expressions Partnership Company Details
11.6.2 Expressions Partnership Business Overview
11.6.3 Expressions Partnership In-House Training Services Introduction
11.6.4 Expressions Partnership Revenue in In-House Training Services Business (2021–2026)
11.6.5 Expressions Partnership Recent Development
11.7 InCorp Services
11.7.1 InCorp Services Company Details
11.7.2 InCorp Services Business Overview
11.7.3 InCorp Services In-House Training Services Introduction
11.7.4 InCorp Services Revenue in In-House Training Services Business (2021–2026)
11.7.5 InCorp Services Recent Development
11.8 IATA
11.8.1 IATA Company Details
11.8.2 IATA Business Overview
11.8.3 IATA In-House Training Services Introduction
11.8.4 IATA Revenue in In-House Training Services Business (2021–2026)
11.8.5 IATA Recent Development
11.9 Fleming Events
11.9.1 Fleming Events Company Details
11.9.2 Fleming Events Business Overview
11.9.3 Fleming Events In-House Training Services Introduction
11.9.4 Fleming Events Revenue in In-House Training Services Business (2021–2026)
11.9.5 Fleming Events Recent Development
11.10 Pixieset
11.10.1 Pixieset Company Details
11.10.2 Pixieset Business Overview
11.10.3 Pixieset In-House Training Services Introduction
11.10.4 Pixieset Revenue in In-House Training Services Business (2021–2026)
11.10.5 Pixieset Recent Development
11.11 ExperTeach GmbH
11.11.1 ExperTeach GmbH Company Details
11.11.2 ExperTeach GmbH Business Overview
11.11.3 ExperTeach GmbH In-House Training Services Introduction
11.11.4 ExperTeach GmbH Revenue in In-House Training Services Business (2021–2026)
11.11.5 ExperTeach GmbH Recent Development
11.12 Mercia Group
11.12.1 Mercia Group Company Details
11.12.2 Mercia Group Business Overview
11.12.3 Mercia Group In-House Training Services Introduction
11.12.4 Mercia Group Revenue in In-House Training Services Business (2021–2026)
11.12.5 Mercia Group Recent Development
11.13 The Training Centre
11.13.1 The Training Centre Company Details
11.13.2 The Training Centre Business Overview
11.13.3 The Training Centre In-House Training Services Introduction
11.13.4 The Training Centre Revenue in In-House Training Services Business (2021–2026)
11.13.5 The Training Centre Recent Development
11.14 Kaizen
11.14.1 Kaizen Company Details
11.14.2 Kaizen Business Overview
11.14.3 Kaizen In-House Training Services Introduction
11.14.4 Kaizen Revenue in In-House Training Services Business (2021–2026)
11.14.5 Kaizen Recent Development
11.15 Food Safety & Quality Services
11.15.1 Food Safety & Quality Services Company Details
11.15.2 Food Safety & Quality Services Business Overview
11.15.3 Food Safety & Quality Services In-House Training Services Introduction
11.15.4 Food Safety & Quality Services Revenue in In-House Training Services Business (2021–2026)
11.15.5 Food Safety & Quality Services Recent Development
11.16 IPI Academy
11.16.1 IPI Academy Company Details
11.16.2 IPI Academy Business Overview
11.16.3 IPI Academy In-House Training Services Introduction
11.16.4 IPI Academy Revenue in In-House Training Services Business (2021–2026)
11.16.5 IPI Academy Recent Development
12 Analyst's Viewpoints/Conclusions
13 Appendix
13.1 Research Methodology
13.1.1 Methodology/Research Approach
13.1.1.1 Research Programs/Design
13.1.1.2 Market Size Estimation
13.1.1.3 Market Breakdown and Data Triangulation
13.1.2 Data Source
13.1.2.1 Secondary Sources
13.1.2.2 Primary Sources
13.2 Author Details
13.3 Disclaimer
List of Tables
 Table 1. Global In-House Training Services Market Size Growth Rate by Core Training Content (US$ Million): 2021 vs 2025 vs 2032
 Table 2. Key Players of Self-construction and Implementation by Enterprises
 Table 3. Key Players of External Procurement of Courses and Instructors
 Table 4. Key Players of Blended Services Combining Internal and External Resources
 Table 5. Key Players of Corporate University/Academy Model
 Table 6. Global In-House Training Services Market Size Growth Rate by Service Providers (US$ Million): 2021 vs 2025 vs 2032
 Table 7. Key Players of Self-construction and Implementation by Enterprises
 Table 8. Key Players of External Procurement of Courses and Instructors
 Table 9. Key Players of Blended Services Combining Internal and External Resources
 Table 10. Key Players of Corporate University/Academy Model
 Table 11. Global In-House Training Services Market Size Growth Rate by Learning Technology Formats (US$ Million): 2021 vs 2025 vs 2032
 Table 12. Key Players of Traditional Face-to-Face Training
 Table 13. Key Players of Digital Online Learning
 Table 14. Key Players of Blended Learning
 Table 15. Global In-House Training Services Market Size Growth by Application (US$ Million): 2021 vs 2025 vs 2032
 Table 16. Global In-House Training Services Market Size by Region (US$ Million): 2021 vs 2025 vs 2032
 Table 17. Global In-House Training Services Market Size by Region (US$ Million), 2021–2026
 Table 18. Global In-House Training Services Market Share by Region (2021–2026)
 Table 19. Global In-House Training Services Forecasted Market Size by Region (US$ Million), 2027–2032
 Table 20. Global In-House Training Services Market Share by Region (2027–2032)
 Table 21. In-House Training Services Market Trends
 Table 22. In-House Training Services Market Drivers
 Table 23. In-House Training Services Market Challenges
 Table 24. In-House Training Services Market Restraints
 Table 25. Global In-House Training Services Revenue by Players (US$ Million), 2021–2026
 Table 26. Global In-House Training Services Market Share by Players (2021–2026)
 Table 27. Global Top In-House Training Services Players by Tier (Tier 1, Tier 2, and Tier 3), based on In-House Training Services Revenue, 2025
 Table 28. Ranking of Global Top In-House Training Services Companies by Revenue (US$ Million) in 2025
 Table 29. Global 5 Largest Players Market Share by In-House Training Services Revenue (CR5 and HHI), 2021–2026
 Table 30. Global Key Players of In-House Training Services, Headquarters and Area Served
 Table 31. Global Key Players of In-House Training Services, Products and Applications
 Table 32. Global Key Players of In-House Training Services, Date of General Availability (GA)
 Table 33. Mergers and Acquisitions, Expansion Plans
 Table 34. Global In-House Training Services Market Size by Core Training Content (US$ Million), 2021–2026
 Table 35. Global In-House Training Services Revenue Market Share by Core Training Content (2021–2026)
 Table 36. Global In-House Training Services Forecasted Market Size by Core Training Content (US$ Million), 2027–2032
 Table 37. Global In-House Training Services Revenue Market Share by Core Training Content (2027–2032)
 Table 38. Global In-House Training Services Market Size by Application (US$ Million), 2021–2026
 Table 39. Global In-House Training Services Revenue Market Share by Application (2021–2026)
 Table 40. Global In-House Training Services Forecasted Market Size by Application (US$ Million), 2027–2032
 Table 41. Global In-House Training Services Revenue Market Share by Application (2027–2032)
 Table 42. North America In-House Training Services Market Size Growth Rate by Country (US$ Million): 2021 vs 2025 vs 2032
 Table 43. North America In-House Training Services Market Size by Country (US$ Million), 2021–2026
 Table 44. North America In-House Training Services Market Size by Country (US$ Million), 2027–2032
 Table 45. Europe In-House Training Services Market Size Growth Rate by Country (US$ Million): 2021 vs 2025 vs 2032
 Table 46. Europe In-House Training Services Market Size by Country (US$ Million), 2021–2026
 Table 47. Europe In-House Training Services Market Size by Country (US$ Million), 2027–2032
 Table 48. Asia-Pacific In-House Training Services Market Size Growth Rate by Region (US$ Million): 2021 vs 2025 vs 2032
 Table 49. Asia-Pacific In-House Training Services Market Size by Region (US$ Million), 2021–2026
 Table 50. Asia-Pacific In-House Training Services Market Size by Region (US$ Million), 2027–2032
 Table 51. Latin America In-House Training Services Market Size Growth Rate by Country (US$ Million): 2021 vs 2025 vs 2032
 Table 52. Latin America In-House Training Services Market Size by Country (US$ Million), 2021–2026
 Table 53. Latin America In-House Training Services Market Size by Country (US$ Million), 2027–2032
 Table 54. Middle East & Africa In-House Training Services Market Size Growth Rate by Country (US$ Million): 2021 vs 2025 vs 2032
 Table 55. Middle East & Africa In-House Training Services Market Size by Country (US$ Million), 2021–2026
 Table 56. Middle East & Africa In-House Training Services Market Size by Country (US$ Million), 2027–2032
 Table 57. ALC Group Company Details
 Table 58. ALC Group Business Overview
 Table 59. ALC Group In-House Training Services Product
 Table 60. ALC Group Revenue in In-House Training Services Business (US$ Million), 2021–2026
 Table 61. ALC Group Recent Development
 Table 62. The In House Training Company Company Details
 Table 63. The In House Training Company Business Overview
 Table 64. The In House Training Company In-House Training Services Product
 Table 65. The In House Training Company Revenue in In-House Training Services Business (US$ Million), 2021–2026
 Table 66. The In House Training Company Recent Development
 Table 67. Questamon Company Details
 Table 68. Questamon Business Overview
 Table 69. Questamon In-House Training Services Product
 Table 70. Questamon Revenue in In-House Training Services Business (US$ Million), 2021–2026
 Table 71. Questamon Recent Development
 Table 72. IT Governance USA Company Details
 Table 73. IT Governance USA Business Overview
 Table 74. IT Governance USA In-House Training Services Product
 Table 75. IT Governance USA Revenue in In-House Training Services Business (US$ Million), 2021–2026
 Table 76. IT Governance USA Recent Development
 Table 77. Rainmaker Company Details
 Table 78. Rainmaker Business Overview
 Table 79. Rainmaker In-House Training Services Product
 Table 80. Rainmaker Revenue in In-House Training Services Business (US$ Million), 2021–2026
 Table 81. Rainmaker Recent Development
 Table 82. Expressions Partnership Company Details
 Table 83. Expressions Partnership Business Overview
 Table 84. Expressions Partnership In-House Training Services Product
 Table 85. Expressions Partnership Revenue in In-House Training Services Business (US$ Million), 2021–2026
 Table 86. Expressions Partnership Recent Development
 Table 87. InCorp Services Company Details
 Table 88. InCorp Services Business Overview
 Table 89. InCorp Services In-House Training Services Product
 Table 90. InCorp Services Revenue in In-House Training Services Business (US$ Million), 2021–2026
 Table 91. InCorp Services Recent Development
 Table 92. IATA Company Details
 Table 93. IATA Business Overview
 Table 94. IATA In-House Training Services Product
 Table 95. IATA Revenue in In-House Training Services Business (US$ Million), 2021–2026
 Table 96. IATA Recent Development
 Table 97. Fleming Events Company Details
 Table 98. Fleming Events Business Overview
 Table 99. Fleming Events In-House Training Services Product
 Table 100. Fleming Events Revenue in In-House Training Services Business (US$ Million), 2021–2026
 Table 101. Fleming Events Recent Development
 Table 102. Pixieset Company Details
 Table 103. Pixieset Business Overview
 Table 104. Pixieset In-House Training Services Product
 Table 105. Pixieset Revenue in In-House Training Services Business (US$ Million), 2021–2026
 Table 106. Pixieset Recent Development
 Table 107. ExperTeach GmbH Company Details
 Table 108. ExperTeach GmbH Business Overview
 Table 109. ExperTeach GmbH In-House Training Services Product
 Table 110. ExperTeach GmbH Revenue in In-House Training Services Business (US$ Million), 2021–2026
 Table 111. ExperTeach GmbH Recent Development
 Table 112. Mercia Group Company Details
 Table 113. Mercia Group Business Overview
 Table 114. Mercia Group In-House Training Services Product
 Table 115. Mercia Group Revenue in In-House Training Services Business (US$ Million), 2021–2026
 Table 116. Mercia Group Recent Development
 Table 117. The Training Centre Company Details
 Table 118. The Training Centre Business Overview
 Table 119. The Training Centre In-House Training Services Product
 Table 120. The Training Centre Revenue in In-House Training Services Business (US$ Million), 2021–2026
 Table 121. The Training Centre Recent Development
 Table 122. Kaizen Company Details
 Table 123. Kaizen Business Overview
 Table 124. Kaizen In-House Training Services Product
 Table 125. Kaizen Revenue in In-House Training Services Business (US$ Million), 2021–2026
 Table 126. Kaizen Recent Development
 Table 127. Food Safety & Quality Services Company Details
 Table 128. Food Safety & Quality Services Business Overview
 Table 129. Food Safety & Quality Services In-House Training Services Product
 Table 130. Food Safety & Quality Services Revenue in In-House Training Services Business (US$ Million), 2021–2026
 Table 131. Food Safety & Quality Services Recent Development
 Table 132. IPI Academy Company Details
 Table 133. IPI Academy Business Overview
 Table 134. IPI Academy In-House Training Services Product
 Table 135. IPI Academy Revenue in In-House Training Services Business (US$ Million), 2021–2026
 Table 136. IPI Academy Recent Development
 Table 137. Research Programs/Design for This Report
 Table 138. Key Data Information from Secondary Sources
 Table 139. Key Data Information from Primary Sources
 Table 140. Authors List of This Report


List of Figures
 Figure 1. In-House Training Services Picture
 Figure 2. Global In-House Training Services Market Size Comparison by Core Training Content (US$ Million), 2021–2032
 Figure 3. Global In-House Training Services Market Share by Core Training Content: 2025 vs 2032
 Figure 4. Self-construction and Implementation by Enterprises Features
 Figure 5. External Procurement of Courses and Instructors Features
 Figure 6. Blended Services Combining Internal and External Resources Features
 Figure 7. Corporate University/Academy Model Features
 Figure 8. Global In-House Training Services Market Size Comparison by Service Providers (US$ Million), 2021–2032
 Figure 9. Self-construction and Implementation by Enterprises Features
 Figure 10. External Procurement of Courses and Instructors Features
 Figure 11. Blended Services Combining Internal and External Resources Features
 Figure 12. Corporate University/Academy Model Features
 Figure 13. Global In-House Training Services Market Size Comparison by Learning Technology Formats (US$ Million), 2021–2032
 Figure 14. Traditional Face-to-Face Training Features
 Figure 15. Digital Online Learning Features
 Figure 16. Blended Learning Features
 Figure 17. Global In-House Training Services Market Size by Application (US$ Million), 2021–2032
 Figure 18. Global In-House Training Services Market Share by Application: 2025 vs 2032
 Figure 19. Manufacturing Case Studies
 Figure 20. Industrial Case Studies
 Figure 21. Automobile Case Studies
 Figure 22. Finance Case Studies
 Figure 23. Food Case Studies
 Figure 24. Chemicals Case Studies
 Figure 25. Others Case Studies
 Figure 26. In-House Training Services Report Years Considered
 Figure 27. Global In-House Training Services Market Size (US$ Million), Year-over-Year: 2021–2032
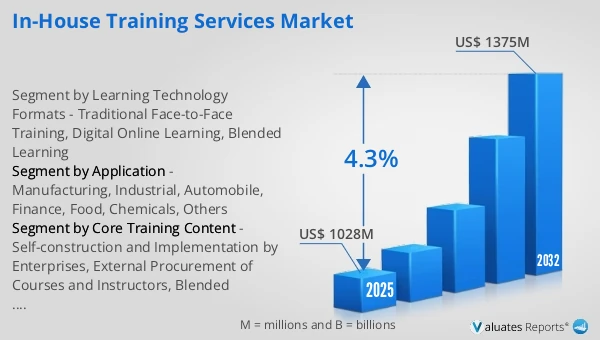
 Figure 28. Global In-House Training Services Market Size, (US$ Million), 2021 vs 2025 vs 2032
 Figure 29. Global In-House Training Services Market Share by Region: 2025 vs 2032
 Figure 30. Global In-House Training Services Market Share by Players in 2025
 Figure 31. Global In-House Training Services Market Share by Company Type (Tier 1, Tier 2, and Tier 3)
 Figure 32. The Top 10 and 5 Players Market Share by In-House Training Services Revenue in 2025
 Figure 33. North America In-House Training Services Market Size YoY Growth (US$ Million), 2021–2032
 Figure 34. North America In-House Training Services Market Share by Country (2021–2032)
 Figure 35. United States In-House Training Services Market Size YoY Growth (US$ Million), 2021–2032
 Figure 36. Canada In-House Training Services Market Size YoY Growth (US$ Million), 2021–2032
 Figure 37. Europe In-House Training Services Market Size YoY Growth (US$ Million), 2021–2032
 Figure 38. Europe In-House Training Services Market Share by Country (2021–2032)
 Figure 39. Germany In-House Training Services Market Size YoY Growth (US$ Million), 2021–2032
 Figure 40. France In-House Training Services Market Size YoY Growth (US$ Million), 2021–2032
 Figure 41. U.K. In-House Training Services Market Size YoY Growth (US$ Million), 2021–2032
 Figure 42. Italy In-House Training Services Market Size YoY Growth (US$ Million), 2021–2032
 Figure 43. Russia In-House Training Services Market Size YoY Growth (US$ Million), 2021–2032
 Figure 44. Ireland In-House Training Services Market Size YoY Growth (US$ Million), 2021–2032
 Figure 45. Asia-Pacific In-House Training Services Market Size YoY Growth (US$ Million), 2021–2032
 Figure 46. Asia-Pacific In-House Training Services Market Share by Region (2021–2032)
 Figure 47. China In-House Training Services Market Size YoY Growth (US$ Million), 2021–2032
 Figure 48. Japan In-House Training Services Market Size YoY Growth (US$ Million), 2021–2032
 Figure 49. South Korea In-House Training Services Market Size YoY Growth (US$ Million), 2021–2032
 Figure 50. Southeast Asia In-House Training Services Market Size YoY Growth (US$ Million), 2021–2032
 Figure 51. India In-House Training Services Market Size YoY Growth (US$ Million), 2021–2032
 Figure 52. Australia & New Zealand In-House Training Services Market Size YoY Growth (US$ Million), 2021–2032
 Figure 53. Latin America In-House Training Services Market Size YoY Growth (US$ Million), 2021–2032
 Figure 54. Latin America In-House Training Services Market Share by Country (2021–2032)
 Figure 55. Mexico In-House Training Services Market Size YoY Growth (US$ Million), 2021–2032
 Figure 56. Brazil In-House Training Services Market Size YoY Growth (US$ Million), 2021–2032
 Figure 57. Middle East & Africa In-House Training Services Market Size YoY Growth (US$ Million), 2021–2032
 Figure 58. Middle East & Africa In-House Training Services Market Share by Country (2021–2032)
 Figure 59. Israel In-House Training Services Market Size YoY Growth (US$ Million), 2021–2032
 Figure 60. Saudi Arabia In-House Training Services Market Size YoY Growth (US$ Million), 2021–2032
 Figure 61. UAE In-House Training Services Market Size YoY Growth (US$ Million), 2021–2032
 Figure 62. ALC Group Revenue Growth Rate in In-House Training Services Business (2021–2026)
 Figure 63. The In House Training Company Revenue Growth Rate in In-House Training Services Business (2021–2026)
 Figure 64. Questamon Revenue Growth Rate in In-House Training Services Business (2021–2026)
 Figure 65. IT Governance USA Revenue Growth Rate in In-House Training Services Business (2021–2026)
 Figure 66. Rainmaker Revenue Growth Rate in In-House Training Services Business (2021–2026)
 Figure 67. Expressions Partnership Revenue Growth Rate in In-House Training Services Business (2021–2026)
 Figure 68. InCorp Services Revenue Growth Rate in In-House Training Services Business (2021–2026)
 Figure 69. IATA Revenue Growth Rate in In-House Training Services Business (2021–2026)
 Figure 70. Fleming Events Revenue Growth Rate in In-House Training Services Business (2021–2026)
 Figure 71. Pixieset Revenue Growth Rate in In-House Training Services Business (2021–2026)
 Figure 72. ExperTeach GmbH Revenue Growth Rate in In-House Training Services Business (2021–2026)
 Figure 73. Mercia Group Revenue Growth Rate in In-House Training Services Business (2021–2026)
 Figure 74. The Training Centre Revenue Growth Rate in In-House Training Services Business (2021–2026)
 Figure 75. Kaizen Revenue Growth Rate in In-House Training Services Business (2021–2026)
 Figure 76. Food Safety & Quality Services Revenue Growth Rate in In-House Training Services Business (2021–2026)
 Figure 77. IPI Academy Revenue Growth Rate in In-House Training Services Business (2021–2026)
 Figure 78. Bottom-up and Top-down Approaches for This Report
 Figure 79. Data Triangulation
 Figure 80. Key Executives Interviewed
SELECT A FORMAT
Added to Cart
Electronic

$2900

Single User License
Electronic

$4350

Multi User License
Electronic

$5800

Enterprise License
Add to Cart
Buy Now (15% Discount)

OUR CUSTOMER

SIS Group of Schools

SIMILAR REPORTS