1 Market Overview
1.1 Automatic Beverage Filling Machine Product Introduction
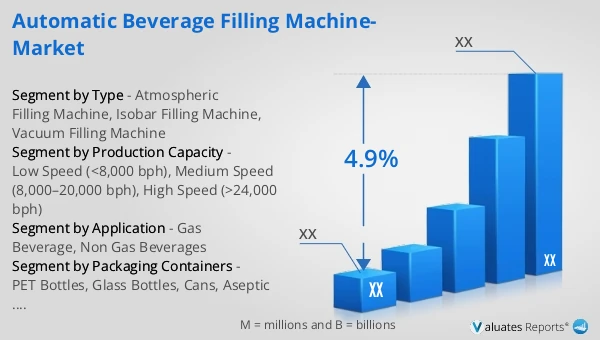
1.2 Global Automatic Beverage Filling Machine Market Size Forecast
1.2.1 Global Automatic Beverage Filling Machine Sales Value (2021–2032)
1.2.2 Global Automatic Beverage Filling Machine Sales Volume (2021–2032)
1.2.3 Global Automatic Beverage Filling Machine Sales Price (2021–2032)
1.3 Automatic Beverage Filling Machine Market Trends & Drivers
1.3.1 Automatic Beverage Filling Machine Industry Trends
1.3.2 Automatic Beverage Filling Machine Market Drivers & Opportunities
1.3.3 Automatic Beverage Filling Machine Market Challenges
1.3.4 Automatic Beverage Filling Machine Market Restraints
1.3.5 Impact of U.S. Tariffs
1.4 Assumptions and Limitations
1.5 Study Objectives
1.6 Years Considered
2 Competitive Analysis by Company
2.1 Global Automatic Beverage Filling Machine Players Revenue Ranking (2025)
2.2 Global Automatic Beverage Filling Machine Revenue by Company (2021–2026)
2.3 Global Automatic Beverage Filling Machine Sales Volume Ranking of Players (2025)
2.4 Global Automatic Beverage Filling Machine Sales Volume by Company (2021–2026)
2.5 Global Automatic Beverage Filling Machine Average Price by Company (2021–2026)
2.6 Key Manufacturers Automatic Beverage Filling Machine Manufacturing Base and Headquarters
2.7 Key Manufacturers Automatic Beverage Filling Machine Product Offerings
2.8 Key Manufacturers Start of Mass Production of Automatic Beverage Filling Machine
2.9 Automatic Beverage Filling Machine Market Competitive Analysis
2.9.1 Automatic Beverage Filling Machine Market Concentration Rate (2021–2026)
2.9.2 Global 5 and 10 Largest Manufacturers by Automatic Beverage Filling Machine Revenue in 2025
2.9.3 Global Companies by Tier (Tier 1, Tier 2, Tier 3), based on Automatic Beverage Filling Machine revenue, 2025
2.10 Mergers & Acquisitions and Expansion
3 Segmentation Automatic Beverage Filling Machine Market Classification
3.1 Introduction by Type
3.1.1 Atmospheric Filling Machine
3.1.2 Isobar Filling Machine
3.1.3 Vacuum Filling Machine
3.1.4 Global Automatic Beverage Filling Machine Sales Value by Type
3.1.4.1 Global Automatic Beverage Filling Machine Sales Value by Type (2021 vs 2025 vs 2032)
3.1.4.2 Global Automatic Beverage Filling Machine Sales Value, by Type (2021–2032)
3.1.4.3 Global Automatic Beverage Filling Machine Sales Value, by Type (%), 2021–2032
3.1.5 Global Automatic Beverage Filling Machine Sales Volume by Type
3.1.5.1 Global Automatic Beverage Filling Machine Sales Volume by Type (2021 vs 2025 vs 2032)
3.1.5.2 Global Automatic Beverage Filling Machine Sales Volume, by Type (2021–2032)
3.1.5.3 Global Automatic Beverage Filling Machine Sales Volume, by Type (%), 2021–2032
3.1.6 Global Automatic Beverage Filling Machine Average Price by Type (2021–2032)
3.2 Introduction by Production Capacity
3.2.1 Low Speed (<8,000 bph)
3.2.2 Medium Speed (8,000–20,000 bph)
3.2.3 High Speed (>24,000 bph)
3.2.4 Global Automatic Beverage Filling Machine Sales Value by Production Capacity
3.2.4.1 Global Automatic Beverage Filling Machine Sales Value by Production Capacity (2021 vs 2025 vs 2032)
3.2.4.2 Global Automatic Beverage Filling Machine Sales Value, by Production Capacity (2021–2032)
3.2.4.3 Global Automatic Beverage Filling Machine Sales Value, by Production Capacity (%), 2021–2032
3.2.5 Global Automatic Beverage Filling Machine Sales Volume by Production Capacity
3.2.5.1 Global Automatic Beverage Filling Machine Sales Volume by Production Capacity (2021 vs 2025 vs 2032)
3.2.5.2 Global Automatic Beverage Filling Machine Sales Volume, by Production Capacity (2021–2032)
3.2.5.3 Global Automatic Beverage Filling Machine Sales Volume, by Production Capacity (%), 2021–2032
3.2.6 Global Automatic Beverage Filling Machine Average Price by Production Capacity (2021–2032)
3.3 Introduction by Packaging Containers
3.3.1 PET Bottles
3.3.2 Glass Bottles
3.3.3 Cans
3.3.4 Aseptic Cartons
3.3.5 Others
3.3.6 Global Automatic Beverage Filling Machine Sales Value by Packaging Containers
3.3.6.1 Global Automatic Beverage Filling Machine Sales Value by Packaging Containers (2021 vs 2025 vs 2032)
3.3.6.2 Global Automatic Beverage Filling Machine Sales Value, by Packaging Containers (2021–2032)
3.3.6.3 Global Automatic Beverage Filling Machine Sales Value, by Packaging Containers (%), 2021–2032
3.3.7 Global Automatic Beverage Filling Machine Sales Volume by Packaging Containers
3.3.7.1 Global Automatic Beverage Filling Machine Sales Volume by Packaging Containers (2021 vs 2025 vs 2032)
3.3.7.2 Global Automatic Beverage Filling Machine Sales Volume, by Packaging Containers (2021–2032)
3.3.7.3 Global Automatic Beverage Filling Machine Sales Volume, by Packaging Containers (%), 2021–2032
3.3.8 Global Automatic Beverage Filling Machine Average Price by Packaging Containers (2021–2032)
4 Segmentation by Application
4.1 Introduction by Application
4.1.1 Gas Beverage
4.1.2 Non Gas Beverages
4.2 Global Automatic Beverage Filling Machine Sales Value by Application
4.2.1 Global Automatic Beverage Filling Machine Sales Value by Application (2021 vs 2025 vs 2032)
4.2.2 Global Automatic Beverage Filling Machine Sales Value, by Application (2021–2032)
4.2.3 Global Automatic Beverage Filling Machine Sales Value, by Application (%), 2021–2032
4.3 Global Automatic Beverage Filling Machine Sales Volume by Application
4.3.1 Global Automatic Beverage Filling Machine Sales Volume by Application (2021 vs 2025 vs 2032)
4.3.2 Global Automatic Beverage Filling Machine Sales Volume, by Application (2021–2032)
4.3.3 Global Automatic Beverage Filling Machine Sales Volume, by Application (%), 2021–2032
4.4 Global Automatic Beverage Filling Machine Average Price by Application (2021–2032)
5 Segmentation by Region
5.1 Global Automatic Beverage Filling Machine Sales Value by Region
5.1.1 Global Automatic Beverage Filling Machine Sales Value by Region: 2021 vs 2025 vs 2032
5.1.2 Global Automatic Beverage Filling Machine Sales Value by Region (2021–2026)
5.1.3 Global Automatic Beverage Filling Machine Sales Value by Region (2027–2032)
5.1.4 Global Automatic Beverage Filling Machine Sales Value by Region (%), 2021–2032
5.2 Global Automatic Beverage Filling Machine Sales Volume by Region
5.2.1 Global Automatic Beverage Filling Machine Sales Volume by Region: 2021 vs 2025 vs 2032
5.2.2 Global Automatic Beverage Filling Machine Sales Volume by Region (2021–2026)
5.2.3 Global Automatic Beverage Filling Machine Sales Volume by Region (2027–2032)
5.2.4 Global Automatic Beverage Filling Machine Sales Volume by Region (%), 2021–2032
5.3 Global Automatic Beverage Filling Machine Average Price by Region (2021–2032)
5.4 North America
5.4.1 North America Automatic Beverage Filling Machine Sales Value, 2021–2032
5.4.2 North America Automatic Beverage Filling Machine Sales Value by Country (%), 2025 vs 2032
5.5 Europe
5.5.1 Europe Automatic Beverage Filling Machine Sales Value, 2021–2032
5.5.2 Europe Automatic Beverage Filling Machine Sales Value by Country (%), 2025 vs 2032
5.6 Asia Pacific
5.6.1 Asia Pacific Automatic Beverage Filling Machine Sales Value, 2021–2032
5.6.2 Asia Pacific Automatic Beverage Filling Machine Sales Value by Region (%), 2025 vs 2032
5.7 South America
5.7.1 South America Automatic Beverage Filling Machine Sales Value, 2021–2032
5.7.2 South America Automatic Beverage Filling Machine Sales Value by Country (%), 2025 vs 2032
5.8 Middle East & Africa
5.8.1 Middle East & Africa Automatic Beverage Filling Machine Sales Value, 2021–2032
5.8.2 Middle East & Africa Automatic Beverage Filling Machine Sales Value by Country (%), 2025 vs 2032
6 Segmentation by Key Countries/Regions
6.1 Key Countries/Regions Automatic Beverage Filling Machine Sales Value Growth Trends, 2021 vs 2025 vs 2032
6.2 Key Countries/Regions Automatic Beverage Filling Machine Sales Value and Sales Volume
6.2.1 Key Countries/Regions Automatic Beverage Filling Machine Sales Value, 2021–2032
6.2.2 Key Countries/Regions Automatic Beverage Filling Machine Sales Volume, 2021–2032
6.3 United States
6.3.1 United States Automatic Beverage Filling Machine Sales Value, 2021–2032
6.3.2 United States Automatic Beverage Filling Machine Sales Value by Type (%), 2025 vs 2032
6.3.3 United States Automatic Beverage Filling Machine Sales Value by Application, 2025 vs 2032
6.4 Europe
6.4.1 Europe Automatic Beverage Filling Machine Sales Value, 2021–2032
6.4.2 Europe Automatic Beverage Filling Machine Sales Value by Type (%), 2025 vs 2032
6.4.3 Europe Automatic Beverage Filling Machine Sales Value by Application, 2025 vs 2032
6.5 China
6.5.1 China Automatic Beverage Filling Machine Sales Value, 2021–2032
6.5.2 China Automatic Beverage Filling Machine Sales Value by Type (%), 2025 vs 2032
6.5.3 China Automatic Beverage Filling Machine Sales Value by Application, 2025 vs 2032
6.6 Japan
6.6.1 Japan Automatic Beverage Filling Machine Sales Value, 2021–2032
6.6.2 Japan Automatic Beverage Filling Machine Sales Value by Type (%), 2025 vs 2032
6.6.3 Japan Automatic Beverage Filling Machine Sales Value by Application, 2025 vs 2032
6.7 South Korea
6.7.1 South Korea Automatic Beverage Filling Machine Sales Value, 2021–2032
6.7.2 South Korea Automatic Beverage Filling Machine Sales Value by Type (%), 2025 vs 2032
6.7.3 South Korea Automatic Beverage Filling Machine Sales Value by Application, 2025 vs 2032
6.8 Southeast Asia
6.8.1 Southeast Asia Automatic Beverage Filling Machine Sales Value, 2021–2032
6.8.2 Southeast Asia Automatic Beverage Filling Machine Sales Value by Type (%), 2025 vs 2032
6.8.3 Southeast Asia Automatic Beverage Filling Machine Sales Value by Application, 2025 vs 2032
6.9 India
6.9.1 India Automatic Beverage Filling Machine Sales Value, 2021–2032
6.9.2 India Automatic Beverage Filling Machine Sales Value by Type (%), 2025 vs 2032
6.9.3 India Automatic Beverage Filling Machine Sales Value by Application, 2025 vs 2032
7 Company Profiles
7.1 GEA Group
7.1.1 GEA Group Company Information
7.1.2 GEA Group Introduction and Business Overview
7.1.3 GEA Group Automatic Beverage Filling Machine Sales, Revenue, Price and Gross Margin (2021–2026)
7.1.4 GEA Group Automatic Beverage Filling Machine Product Offerings
7.1.5 GEA Group Recent Developments
7.2 Tetra Laval
7.2.1 Tetra Laval Company Information
7.2.2 Tetra Laval Introduction and Business Overview
7.2.3 Tetra Laval Automatic Beverage Filling Machine Sales, Revenue, Price and Gross Margin (2021–2026)
7.2.4 Tetra Laval Automatic Beverage Filling Machine Product Offerings
7.2.5 Tetra Laval Recent Developments
7.3 KRONES
7.3.1 KRONES Company Information
7.3.2 KRONES Introduction and Business Overview
7.3.3 KRONES Automatic Beverage Filling Machine Sales, Revenue, Price and Gross Margin (2021–2026)
7.3.4 KRONES Automatic Beverage Filling Machine Product Offerings
7.3.5 KRONES Recent Developments
7.4 KHS GmbH
7.4.1 KHS GmbH Company Information
7.4.2 KHS GmbH Introduction and Business Overview
7.4.3 KHS GmbH Automatic Beverage Filling Machine Sales, Revenue, Price and Gross Margin (2021–2026)
7.4.4 KHS GmbH Automatic Beverage Filling Machine Product Offerings
7.4.5 KHS GmbH Recent Developments
7.5 Accutek Packaging Equipment
7.5.1 Accutek Packaging Equipment Company Information
7.5.2 Accutek Packaging Equipment Introduction and Business Overview
7.5.3 Accutek Packaging Equipment Automatic Beverage Filling Machine Sales, Revenue, Price and Gross Margin (2021–2026)
7.5.4 Accutek Packaging Equipment Automatic Beverage Filling Machine Product Offerings
7.5.5 Accutek Packaging Equipment Recent Developments
7.6 AMS Ferrari
7.6.1 AMS Ferrari Company Information
7.6.2 AMS Ferrari Introduction and Business Overview
7.6.3 AMS Ferrari Automatic Beverage Filling Machine Sales, Revenue, Price and Gross Margin (2021–2026)
7.6.4 AMS Ferrari Automatic Beverage Filling Machine Product Offerings
7.6.5 AMS Ferrari Recent Developments
7.7 Ave Technologies
7.7.1 Ave Technologies Company Information
7.7.2 Ave Technologies Introduction and Business Overview
7.7.3 Ave Technologies Automatic Beverage Filling Machine Sales, Revenue, Price and Gross Margin (2021–2026)
7.7.4 Ave Technologies Automatic Beverage Filling Machine Product Offerings
7.7.5 Ave Technologies Recent Developments
7.8 Filamatic
7.8.1 Filamatic Company Information
7.8.2 Filamatic Introduction and Business Overview
7.8.3 Filamatic Automatic Beverage Filling Machine Sales, Revenue, Price and Gross Margin (2021–2026)
7.8.4 Filamatic Automatic Beverage Filling Machine Product Offerings
7.8.5 Filamatic Recent Developments
7.9 Guangzhou Tech-Long Packaging Machinery
7.9.1 Guangzhou Tech-Long Packaging Machinery Company Information
7.9.2 Guangzhou Tech-Long Packaging Machinery Introduction and Business Overview
7.9.3 Guangzhou Tech-Long Packaging Machinery Automatic Beverage Filling Machine Sales, Revenue, Price and Gross Margin (2021–2026)
7.9.4 Guangzhou Tech-Long Packaging Machinery Automatic Beverage Filling Machine Product Offerings
7.9.5 Guangzhou Tech-Long Packaging Machinery Recent Developments
7.10 IC Filling Systems
7.10.1 IC Filling Systems Company Information
7.10.2 IC Filling Systems Introduction and Business Overview
7.10.3 IC Filling Systems Automatic Beverage Filling Machine Sales, Revenue, Price and Gross Margin (2021–2026)
7.10.4 IC Filling Systems Automatic Beverage Filling Machine Product Offerings
7.10.5 IC Filling Systems Recent Developments
7.11 Marin G. & C.
7.11.1 Marin G. & C. Company Information
7.11.2 Marin G. & C. Introduction and Business Overview
7.11.3 Marin G. & C. Automatic Beverage Filling Machine Sales, Revenue, Price and Gross Margin (2021–2026)
7.11.4 Marin G. & C. Automatic Beverage Filling Machine Product Offerings
7.11.5 Marin G. & C. Recent Developments
7.12 Syntegon
7.12.1 Syntegon Company Information
7.12.2 Syntegon Introduction and Business Overview
7.12.3 Syntegon Automatic Beverage Filling Machine Sales, Revenue, Price and Gross Margin (2021–2026)
7.12.4 Syntegon Automatic Beverage Filling Machine Product Offerings
7.12.5 Syntegon Recent Developments
7.13 JBT Corporation
7.13.1 JBT Corporation Company Information
7.13.2 JBT Corporation Introduction and Business Overview
7.13.3 JBT Corporation Automatic Beverage Filling Machine Sales, Revenue, Price and Gross Margin (2021–2026)
7.13.4 JBT Corporation Automatic Beverage Filling Machine Product Offerings
7.13.5 JBT Corporation Recent Developments
7.14 ACMA
7.14.1 ACMA Company Information
7.14.2 ACMA Introduction and Business Overview
7.14.3 ACMA Automatic Beverage Filling Machine Sales, Revenue, Price and Gross Margin (2021–2026)
7.14.4 ACMA Automatic Beverage Filling Machine Product Offerings
7.14.5 ACMA Recent Developments
7.15 ProMach
7.15.1 ProMach Company Information
7.15.2 ProMach Introduction and Business Overview
7.15.3 ProMach Automatic Beverage Filling Machine Sales, Revenue, Price and Gross Margin (2021–2026)
7.15.4 ProMach Automatic Beverage Filling Machine Product Offerings
7.15.5 ProMach Recent Developments
8 Industry Chain Analysis
8.1 Automatic Beverage Filling Machine Industrial Chain
8.2 Automatic Beverage Filling Machine Upstream Analysis
8.2.1 Key Raw Materials
8.2.2 Key Suppliers of Raw Materials
8.2.3 Manufacturing Cost Structure
8.3 Midstream Analysis
8.4 Downstream Analysis (Customer Analysis)
8.5 Sales Model and Sales Channelss
8.5.1 Automatic Beverage Filling Machine Sales Model
8.5.2 Sales Channels
8.5.3 Automatic Beverage Filling Machine Distributors
9 Research Findings and Conclusion
10 Appendix
10.1 Research Methodology
10.1.1 Methodology/Research Approach
10.1.1.1 Research Programs/Design
10.1.1.2 Market Size Estimation
10.1.1.3 Market Breakdown and Data Triangulation
10.1.2 Data Source
10.1.2.1 Secondary Sources
10.1.2.2 Primary Sources
10.2 Author Details
10.3 Disclaimer