
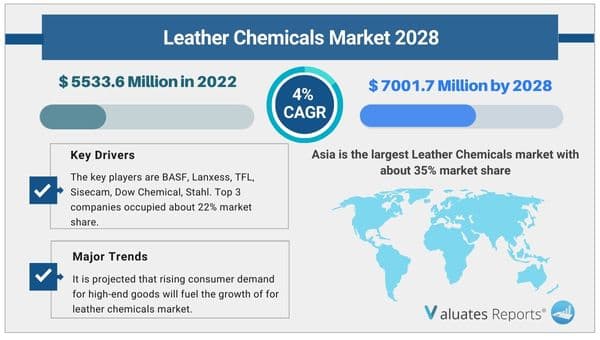
Considering the economic change due to COVID-19 and Russia-Ukraine War Influence, the global Leather Chemicals market is projected to reach USD 7001.7 Million by 2028 from an estimated USD 5533.6 Million in 2022, at a CAGR of 4.0% during 2023 and 2028. According to predictions, the market for leather chemicals will expand as a result of growing customer demand for high-end items. With increased disposable income and population in emerging countries, there is expected to be an increase in demand for consumer goods, which will drive the Leather Chemicals market.
The demand for footwear grows together with the global population and consumer spending power in developing countries. The dynamics of the footwear industry are changing as a result of people's increasing need for a wide range of footwear in a wide range of designs. The market for leather chemicals is anticipated to develop as a result of the growing usage of leather in the footwear sector. Additionally, the use of leather in the textile industry has been rising recently as a result of the younger generation's evolving fashion preferences. This pattern is anticipated to boost the market's expansion for leather chemicals.
Demand for leather has historically been driven mostly by the fast growing upholstery market, which serves the furniture, automotive, and aviation industries. It is often utilized in pricey goods and automobiles. Upholstery is opulent, robust, and easy to care for. It is currently available from reputable manufacturers in small vehicle types. High-performance products are improved by processing the product with the product and additives. The aforementioned factors are predicted to encourage product usage in the automotive sector throughout the course of the forecast period, driving up demand for leather chemicals.
The market for leather chemicals is expected to have considerable growth restraints over the course of the forecast period, including factors like growing operational expenses and stringent environmental control measures.
The Asia Pacific region has the greatest market share for leather chemicals, accounting for 35% of global sales. Europe comes in second with a market share of about 32%. The high concentration of product manufacturers and the accessibility of raw materials are credited with increasing demand. One of the primary forces behind market expansion in Asia and the Pacific is the accessibility of cheap labor. The country imports a lot of luxury goods and footwear, which restricts the product's ability to gain traction on the home market.
The leading manufacturers of leather chemicals include BASF, Lanxess, TFL, Sisecam, Dow Chemical, Stahl, Trumpler, Elementis, DyStar, Schill+Seilacher, Zschimmer & Schwarz, Brother Enterprises, Sichuan Decision Chemical, and Dowell Science&Technology. About 22% of the market for leather chemicals was held by the top 3 players.
|
Report Metric |
Details |
|
Report Name |
Leather Chemicals Market |
|
Market size value in 2022 |
USD 5533.6 Million |
|
Revenue forecast in 2028 |
USD 7001.7 Million |
|
Growth Rate |
CAGR of 4.0% |
|
Base year considered |
2022 |
|
Forecast Period |
2022-2028 |
|
By Propulsion Type |
Syntans, Fatliquors, Finishing Agent |
|
By Application |
Clothing Leather, Automobile Leather, Furniture Leather, Heavy Leather |
|
Report Coverage |
Revenue & volume forecast, company share, competitive landscape, growth factors, and trends |
|
Segments Covered |
By Type, Application, and Region |
|
Geographic Regions Covered |
North America, Europe, Asia Pacific, Latin America, Middle East & Africa |
Ans. Yes, we do provide the option to buy chapters in a report. We also can customize the report based on your specific requirements.
Ans. Considering the economic change due to COVID-19 and Russia-Ukraine War Influence, the global Leather Chemicals market is projected to reach US$ 7001.7 million by 2028 from an estimated US$ 5533.6 million in 2022, at a CAGR of 4.0% during 2023 and 2028.
Ans. Yes, the report includes a COVID-19 impact analysis. Also, it is further extended into every individual segment of the report.
Ans. The key players are BASF, Lanxess, TFL, Sisecam, Dow Chemical, Stahl, Trumpler, Elementis, DyStar, Schill+Seilacher, Zschimmer & Schwarz, Brother Enterprises, Sichuan Decision Chemical, Dowell Science&Technology etc. Top 3 companies occupied about 22% market share.
1 Study Coverage
1.1 Leather Chemicals Product Introduction
1.2 Market by Type
1.2.1 Global Leather Chemicals Market Size Growth Rate by Type (2017 VS 2021 VS 2028)
1.2.2 Syntans
1.2.3 Fatliquors
1.2.4 Finishing Agent
1.2.5 Others
1.3 Market by Application
1.3.1 Global Leather Chemicals Market Size Growth Rate by Application (2017 VS 2021 VS 2028)
1.3.2 Clothing Leather
1.3.3 Automobile Leather
1.3.4 Furniture Leather
1.3.5 Heavy Leather
1.3.6 Others
1.4 Study Objectives
1.5 Years Considered
2 Executive Summary
2.1 Global Leather Chemicals Market Size Estimates and Forecasts
2.1.1 Global Leather Chemicals Revenue 2017-2028
2.1.2 Global Leather Chemicals Sales 2017-2028
2.2 Leather Chemicals Market Size by Region: 2022 Versus 2028
2.3 Leather Chemicals Sales by Region (2017-2028)
2.3.1 Global Leather Chemicals Sales by Region: 2017-2022
2.3.2 Global Leather Chemicals Sales Forecast by Region (2023-2028)
2.3.3 Global Leather Chemicals Sales Market Share by Region (2017-2028)
2.4 Leather Chemicals Market Estimates and Projections by Region (2023-2028)
2.4.1 Global Leather Chemicals Revenue by Region: 2017-2022
2.4.2 Global Leather Chemicals Revenue Forecast by Region (2023-2028)
2.4.3 Global Leather Chemicals Revenue Market Share by Region (2017-2028)
3 Global Leather Chemicals by Manufacturers
3.1 Global Top Leather Chemicals Manufacturers by Sales
3.1.1 Global Leather Chemicals Sales by Manufacturer (2017-2022)
3.1.2 Global Leather Chemicals Sales Market Share by Manufacturer (2017-2022)
3.2 Global Top Leather Chemicals Manufacturers by Revenue
3.2.1 Global Leather Chemicals Revenue by Manufacturer (2017-2022)
3.2.2 Global Leather Chemicals Revenue Share by Manufacturer (2017-2022)
3.3 Global Leather Chemicals Price by Manufacturer (2017-2022)
3.4 Competitive Landscape
3.4.1 Key Leather Chemicals Manufacturers Covered: Ranking by Revenue
3.4.2 Global Leather Chemicals Market Concentration Ratio (CR5 and HHI) & (2017-2022)
3.4.3 Global Leather Chemicals Market Share by Company Type (Tier 1, Tier 2 and Tier 3)
3.5 Global Leather Chemicals Manufacturing Base Distribution, Product Type
3.5.1 Leather Chemicals Manufacturers Manufacturing Base Distribution, Headquarters
3.5.2 Manufacturers Leather Chemicals Product Type
3.5.3 Date of International Manufacturers Enter into Leather Chemicals Market
3.6 Manufacturers Mergers & Acquisitions, Expansion Plans
4 Company Profiles
4.1 BASF
4.1.1 BASF Corporation Information
4.1.2 BASF Description, Business Overview
4.1.3 BASF Leather Chemicals Products Offered
4.1.4 BASF Leather Chemicals Sales, Revenue and Gross Margin (2017-2022)
4.1.5 BASF Leather Chemicals Sales by Product in 2021
4.1.6 BASF Leather Chemicals Sales by Application in 2021
4.1.7 BASF Leather Chemicals Sales by Geographic Area in 2021
4.1.8 BASF Recent Developments
4.2 Lanxess
4.2.1 Lanxess Corporation Information
4.2.2 Lanxess Description, Business Overview
4.2.3 Lanxess Leather Chemicals Products Offered
4.2.4 Lanxess Leather Chemicals Sales, Revenue and Gross Margin (2017-2022)
4.2.5 Lanxess Leather Chemicals Sales by Product in 2021
4.2.6 Lanxess Leather Chemicals Sales by Application in 2021
4.2.7 Lanxess Leather Chemicals Sales by Geographic Area in 2021
4.2.8 Lanxess Recent Developments
4.3 TFL
4.3.1 TFL Corporation Information
4.3.2 TFL Description, Business Overview
4.3.3 TFL Leather Chemicals Products Offered
4.3.4 TFL Leather Chemicals Sales, Revenue and Gross Margin (2017-2022)
4.3.5 TFL Leather Chemicals Sales by Product in 2021
4.3.6 TFL Leather Chemicals Sales by Application in 2021
4.3.7 TFL Leather Chemicals Sales by Geographic Area in 2021
4.3.8 TFL Recent Developments
4.4 Sisecam
4.4.1 Sisecam Corporation Information
4.4.2 Sisecam Description, Business Overview
4.4.3 Sisecam Leather Chemicals Products Offered
4.4.4 Sisecam Leather Chemicals Sales, Revenue and Gross Margin (2017-2022)
4.4.5 Sisecam Leather Chemicals Sales by Product in 2021
4.4.6 Sisecam Leather Chemicals Sales by Application in 2021
4.4.7 Sisecam Leather Chemicals Sales by Geographic Area in 2021
4.4.8 Sisecam Recent Developments
4.5 Dow Chemical
4.5.1 Dow Chemical Corporation Information
4.5.2 Dow Chemical Description, Business Overview
4.5.3 Dow Chemical Leather Chemicals Products Offered
4.5.4 Dow Chemical Leather Chemicals Sales, Revenue and Gross Margin (2017-2022)
4.5.5 Dow Chemical Leather Chemicals Sales by Product in 2021
4.5.6 Dow Chemical Leather Chemicals Sales by Application in 2021
4.5.7 Dow Chemical Leather Chemicals Sales by Geographic Area in 2021
4.5.8 Dow Chemical Recent Developments
4.6 Stahl
4.6.1 Stahl Corporation Information
4.6.2 Stahl Description, Business Overview
4.6.3 Stahl Leather Chemicals Products Offered
4.6.4 Stahl Leather Chemicals Sales, Revenue and Gross Margin (2017-2022)
4.6.5 Stahl Leather Chemicals Sales by Product in 2021
4.6.6 Stahl Leather Chemicals Sales by Application in 2021
4.6.7 Stahl Leather Chemicals Sales by Geographic Area in 2021
4.6.8 Stahl Recent Development
4.7 Trumpler
4.7.1 Trumpler Corporation Information
4.7.2 Trumpler Description, Business Overview
4.7.3 Trumpler Leather Chemicals Products Offered
4.7.4 Trumpler Leather Chemicals Sales, Revenue and Gross Margin (2017-2022)
4.7.5 Trumpler Leather Chemicals Sales by Product in 2021
4.7.6 Trumpler Leather Chemicals Sales by Application in 2021
4.7.7 Trumpler Leather Chemicals Sales by Geographic Area in 2021
4.7.8 Trumpler Recent Development
4.8 Elementis
4.8.1 Elementis Corporation Information
4.8.2 Elementis Description, Business Overview
4.8.3 Elementis Leather Chemicals Products Offered
4.8.4 Elementis Leather Chemicals Sales, Revenue and Gross Margin (2017-2022)
4.8.5 Elementis Leather Chemicals Sales by Product in 2021
4.8.6 Elementis Leather Chemicals Sales by Application in 2021
4.8.7 Elementis Leather Chemicals Sales by Geographic Area in 2021
4.8.8 Elementis Recent Development
4.9 DyStar
4.9.1 DyStar Corporation Information
4.9.2 DyStar Description, Business Overview
4.9.3 DyStar Leather Chemicals Products Offered
4.9.4 DyStar Leather Chemicals Sales, Revenue and Gross Margin (2017-2022)
4.9.5 DyStar Leather Chemicals Sales by Product in 2021
4.9.6 DyStar Leather Chemicals Sales by Application in 2021
4.9.7 DyStar Leather Chemicals Sales by Geographic Area in 2021
4.9.8 DyStar Recent Development
4.10 Schill+Seilacher
4.10.1 Schill+Seilacher Corporation Information
4.10.2 Schill+Seilacher Description, Business Overview
4.10.3 Schill+Seilacher Leather Chemicals Products Offered
4.10.4 Schill+Seilacher Leather Chemicals Sales, Revenue and Gross Margin (2017-2022)
4.10.5 Schill+Seilacher Leather Chemicals Sales by Product in 2021
4.10.6 Schill+Seilacher Leather Chemicals Sales by Application in 2021
4.10.7 Schill+Seilacher Leather Chemicals Sales by Geographic Area in 2021
4.10.8 Schill+Seilacher Recent Development
4.11 Zschimmer & Schwarz
4.11.1 Zschimmer & Schwarz Corporation Information
4.11.2 Zschimmer & Schwarz Description, Business Overview
4.11.3 Zschimmer & Schwarz Leather Chemicals Products Offered
4.11.4 Zschimmer & Schwarz Leather Chemicals Sales, Revenue and Gross Margin (2017-2022)
4.11.5 Zschimmer & Schwarz Leather Chemicals Sales by Product in 2021
4.11.6 Zschimmer & Schwarz Leather Chemicals Sales by Application in 2021
4.11.7 Zschimmer & Schwarz Leather Chemicals Sales by Geographic Area in 2021
4.11.8 Zschimmer & Schwarz Recent Development
4.12 Brother Enterprises
4.12.1 Brother Enterprises Corporation Information
4.12.2 Brother Enterprises Description, Business Overview
4.12.3 Brother Enterprises Leather Chemicals Products Offered
4.12.4 Brother Enterprises Leather Chemicals Sales, Revenue and Gross Margin (2017-2022)
4.12.5 Brother Enterprises Leather Chemicals Sales by Product in 2021
4.12.6 Brother Enterprises Leather Chemicals Sales by Application in 2021
4.12.7 Brother Enterprises Leather Chemicals Sales by Geographic Area in 2021
4.12.8 Brother Enterprises Recent Development
4.13 Sichuan Decision Chemical
4.13.1 Sichuan Decision Chemical Corporation Information
4.13.2 Sichuan Decision Chemical Description, Business Overview
4.13.3 Sichuan Decision Chemical Leather Chemicals Products Offered
4.13.4 Sichuan Decision Chemical Leather Chemicals Sales, Revenue and Gross Margin (2017-2022)
4.13.5 Sichuan Decision Chemical Leather Chemicals Sales by Product in 2021
4.13.6 Sichuan Decision Chemical Leather Chemicals Sales by Application in 2021
4.13.7 Sichuan Decision Chemical Leather Chemicals Sales by Geographic Area in 2021
4.13.8 Sichuan Decision Chemical Recent Development
4.14 Dowell Science&Technology
4.14.1 Dowell Science&Technology Corporation Information
4.14.2 Dowell Science&Technology Description, Business Overview
4.14.3 Dowell Science&Technology Leather Chemicals Products Offered
4.14.4 Dowell Science&Technology Leather Chemicals Sales, Revenue and Gross Margin (2017-2022)
4.14.5 Dowell Science&Technology Leather Chemicals Sales by Product in 2021
4.14.6 Dowell Science&Technology Leather Chemicals Sales by Application in 2021
4.14.7 Dowell Science&Technology Leather Chemicals Sales by Geographic Area in 2021
4.14.8 Dowell Science&Technology Recent Development
5 Breakdown Data by Type
5.1 Global Leather Chemicals Sales by Type (2017-2028)
5.1.1 Global Leather Chemicals Sales by Type (2017-2022)
5.1.2 Global Leather Chemicals Sales Forecast by Type (2023-2028)
5.1.3 Global Leather Chemicals Sales Market Share by Type (2017-2028)
5.2 Global Leather Chemicals Revenue Forecast by Type (2017-2028)
5.2.1 Global Leather Chemicals Revenue by Type (2017-2022)
5.2.2 Global Leather Chemicals Revenue Forecast by Type (2023-2028)
5.2.3 Global Leather Chemicals Revenue Market Share by Type (2017-2028)
5.3 Leather Chemicals Average Selling Price (ASP) by Type (2017-2028)
6 Breakdown Data by Application
6.1 Global Leather Chemicals Sales by Application (2017-2028)
6.1.1 Global Leather Chemicals Sales by Application (2017-2022)
6.1.2 Global Leather Chemicals Sales Forecast by Application (2023-2028)
6.1.3 Global Leather Chemicals Sales Market Share by Application (2017-2028)
6.2 Global Leather Chemicals Revenue Forecast by Application (2017-2028)
6.2.1 Global Leather Chemicals Revenue by Application (2017-2022)
6.2.2 Global Leather Chemicals Revenue Forecast by Application (2023-2028)
6.2.3 Global Leather Chemicals Revenue Market Share by Application (2017-2028)
6.3 Leather Chemicals Average Selling Price (ASP) by Application (2017-2028)
7 North America
7.1 North America Leather Chemicals Market Size YoY Growth 2017-2028
7.2 North America Leather Chemicals Market Facts & Figures by Country
7.2.1 North America Leather Chemicals Sales by Country (2017-2028)
7.2.2 North America Leather Chemicals Revenue by Country (2017-2028)
7.3 North America Leather Chemicals Sales by Type
7.4 North America Leather Chemicals Sales by Application
8 Asia-Pacific
8.1 Asia-Pacific Leather Chemicals Market Size YoY Growth 2017-2028
8.2 Asia-Pacific Leather Chemicals Market Facts & Figures by Region
8.2.1 Asia-Pacific Leather Chemicals Sales by Region (2017-2028)
8.2.2 Asia-Pacific Leather Chemicals Revenue by Region (2017-2028)
8.3 Asia-Pacific Leather Chemicals Sales by Type
8.4 Asia-Pacific Leather Chemicals Sales by Application
9 Europe
9.1 Europe Leather Chemicals Market Size YoY Growth 2017-2028
9.2 Europe Leather Chemicals Market Facts & Figures by Country
9.2.1 Europe Leather Chemicals Sales by Country (2017-2028)
9.2.2 Europe Leather Chemicals Revenue by Country (2017-2028)
9.3 Europe Leather Chemicals Sales by Type
9.4 Europe Leather Chemicals Sales by Application
10 Latin America
10.1 Latin America Leather Chemicals Market Size YoY Growth 2017-2028
10.2 Latin America Leather Chemicals Market Facts & Figures by Country
10.2.1 Latin America Leather Chemicals Sales by Country (2017-2028)
10.2.2 Latin America Leather Chemicals Revenue by Country (2017-2028)
10.3 Latin America Leather Chemicals Sales by Type
10.4 Latin America Leather Chemicals Sales by Application
11 Middle East and Africa
11.1 Middle East and Africa Leather Chemicals Market Size YoY Growth 2017-2028
11.2 Middle East and Africa Leather Chemicals Market Facts & Figures by Country
11.2.1 Middle East and Africa Leather Chemicals Sales by Country (2017-2028)
11.2.2 Middle East and Africa Leather Chemicals Revenue by Country (2017-2028)
11.3 Middle East and Africa Leather Chemicals Sales by Type
11.4 Middle East and Africa Leather Chemicals Sales by Application
12 Supply Chain and Sales Channel Analysis
12.1 Leather Chemicals Supply Chain Analysis
12.2 Leather Chemicals Key Raw Materials and Upstream Suppliers
12.3 Leather Chemicals Clients Analysis
12.4 Leather Chemicals Sales Channel and Sales Model Analysis
12.4.1 Leather Chemicals Distribution Channel Analysis: Indirect Sales VS Direct Sales
12.4.2 Leather Chemicals Distribution Channel Analysis: Online Sales VS Offline Sales
12.4.3 Leather Chemicals Distributors
13 Market Dynamics
13.1 Leather Chemicals Industry Trends
13.2 Leather Chemicals Market Drivers
13.3 Leather Chemicals Market Challenges
13.4 Leather Chemicals Market Restraints
13.5 Porter’s Five Forces Analysis
14 Research Findings and Conclusion
15 Appendix
15.1 Research Methodology
15.1.1 Methodology/Research Approach
15.1.2 Data Source
15.2 Author Details
15.3 Disclaimer
List of Tables
Table 1. Global Leather Chemicals Market Size Growth Rate by Type (US$ Million): 2017 VS 2021 VS 2028
Table 2. Major Manufacturers of Syntans
Table 3. Major Manufacturers of Fatliquors
Table 4. Major Manufacturers of Finishing Agent
Table 5. Major Manufacturers of Others
Table 6. Global Leather Chemicals Market Size Growth by Application (US$ Million): 2017 VS 2021 VS 2028
Table 7. Global Leather Chemicals Market Size by Region (US$ Million): 2021 VS 2022 VS 2028
Table 8. Global Leather Chemicals Sales by Region (2017-2022) & (K MT)
Table 9. Global Leather Chemicals Sales Forecast by Region (2023-2028) & (K MT)
Table 10. Global Leather Chemicals Revenue by Region (2017-2022) & (US$ Million)
Table 11. Global Leather Chemicals Revenue Forecast by Region (2023-2028) & (US$ Million)
Table 12. Global Leather Chemicals Sales by Manufacturer (2017-2022) & (K MT)
Table 13. Global Leather Chemicals Sales Share by Manufacturer (2017-2022)
Table 14. Leather Chemicals Revenue by Manufacturer (2017-2022) & (US$ Million)
Table 15. Leather Chemicals Revenue Share by Manufacturer (2017-2022)
Table 16. Key Manufacturers Leather Chemicals Price (2017-2022) & (USD/MT)
Table 17. Ranking of Global Top Leather Chemicals Manufacturers by Revenue (US$ Million) in 2021
Table 18. Global Leather Chemicals Manufacturers Market Concentration Ratio (CR5 and HHI) & (2017-2022)
Table 19. Global Leather Chemicals by Company Type (Tier 1, Tier 2 and Tier 3) & (based on the Revenue in Leather Chemicals as of 2021)
Table 20. Leather Chemicals Manufacturers Manufacturing Base Distribution and Headquarters
Table 21. Manufacturers Leather Chemicals Product Type
Table 22. Date of International Manufacturers Enter into Leather Chemicals Market
Table 23. Manufacturers Mergers & Acquisitions, Expansion Plans
Table 24. BASF Corporation Information
Table 25. BASF Description and Business Overview
Table 26. BASF Leather Chemicals Sales (K MT), Revenue (US$ Million), Price (USD/MT) and Gross Margin (2017-2022)
Table 27. BASF Leather Chemicals Product
Table 28. BASF Leather Chemicals Sales Proportion of Leather Chemicals by Product in 2021
Table 29. BASF Leather Chemicals Sales Proportion of Leather Chemicals by Application in 2021
Table 30. BASF Leather Chemicals Sales Proportion of Leather Chemicals by Geographic Area in 2021
Table 31. BASF Recent Development
Table 32. Lanxess Corporation Information
Table 33. Lanxess Description and Business Overview
Table 34. Lanxess Leather Chemicals Sales (K MT), Revenue (US$ Million), Price (USD/MT) and Gross Margin (2017-2022)
Table 35. Lanxess Leather Chemicals Product
Table 36. Lanxess Leather Chemicals Sales Proportion of Leather Chemicals by Product in 2021
Table 37. Lanxess Leather Chemicals Sales Proportion of Leather Chemicals by Application in 2021
Table 38. Lanxess Leather Chemicals Sales Proportion of Leather Chemicals by Geographic Area in 2021
Table 39. Lanxess Recent Development
Table 40. TFL Corporation Information
Table 41. TFL Description and Business Overview
Table 42. TFL Leather Chemicals Sales (K MT), Revenue (US$ Million), Price (USD/MT) and Gross Margin (2017-2022)
Table 43. TFL Leather Chemicals Product
Table 44. TFL Leather Chemicals Sales Proportion of Leather Chemicals by Product in 2021
Table 45. TFL Leather Chemicals Sales Proportion of Leather Chemicals by Application in 2021
Table 46. TFL Leather Chemicals Sales Proportion of Leather Chemicals by Geographic Area in 2021
Table 47. TFL Recent Development
Table 48. Sisecam Corporation Information
Table 49. Sisecam Description and Business Overview
Table 50. Sisecam Leather Chemicals Sales (K MT), Revenue (US$ Million), Price (USD/MT) and Gross Margin (2017-2022)
Table 51. Sisecam Leather Chemicals Product
Table 52. Sisecam Leather Chemicals Sales Proportion of Leather Chemicals by Product in 2021
Table 53. Sisecam Leather Chemicals Sales Proportion of Leather Chemicals by Application in 2021
Table 54. Sisecam Leather Chemicals Sales Proportion of Leather Chemicals by Geographic Area in 2021
Table 55. Sisecam Recent Development
Table 56. Dow Chemical Corporation Information
Table 57. Dow Chemical Description and Business Overview
Table 58. Dow Chemical Leather Chemicals Sales (K MT), Revenue (US$ Million), Price (USD/MT) and Gross Margin (2017-2022)
Table 59. Dow Chemical Leather Chemicals Product
Table 60. Dow Chemical Leather Chemicals Sales Proportion of Leather Chemicals by Product in 2021
Table 61. Dow Chemical Leather Chemicals Sales Proportion of Leather Chemicals by Application in 2021
Table 62. Dow Chemical Leather Chemicals Sales Proportion of Leather Chemicals by Geographic Area in 2021
Table 63. Dow Chemical Recent Development
Table 64. Stahl Corporation Information
Table 65. Stahl Description and Business Overview
Table 66. Stahl Leather Chemicals Sales (K MT), Revenue (US$ Million), Price (USD/MT) and Gross Margin (2017-2022)
Table 67. Stahl Leather Chemicals Product
Table 68. Stahl Leather Chemicals Sales Proportion of Leather Chemicals by Product in 2021
Table 69. Stahl Leather Chemicals Sales Proportion of Leather Chemicals by Application in 2021
Table 70. Stahl Leather Chemicals Sales Proportion of Leather Chemicals by Geographic Area in 2021
Table 71. Trumpler Corporation Information
Table 72. Trumpler Description and Business Overview
Table 73. Trumpler Leather Chemicals Sales (K MT), Revenue (US$ Million), Price (USD/MT) and Gross Margin (2017-2022)
Table 74. Trumpler Leather Chemicals Product
Table 75. Trumpler Leather Chemicals Sales Proportion of Leather Chemicals by Product in 2021
Table 76. Trumpler Leather Chemicals Sales Proportion of Leather Chemicals by Application in 2021
Table 77. Trumpler Leather Chemicals Sales Proportion of Leather Chemicals by Geographic Area in 2021
Table 78. Elementis Corporation Information
Table 79. Elementis Description and Business Overview
Table 80. Elementis Leather Chemicals Sales (K MT), Revenue (US$ Million), Price (USD/MT) and Gross Margin (2017-2022)
Table 81. Elementis Leather Chemicals Product
Table 82. Elementis Leather Chemicals Sales Proportion of Leather Chemicals by Product in 2021
Table 83. Elementis Leather Chemicals Sales Proportion of Leather Chemicals by Application in 2021
Table 84. Elementis Leather Chemicals Sales Proportion of Leather Chemicals by Geographic Area in 2021
Table 85. DyStar Corporation Information
Table 86. DyStar Description and Business Overview
Table 87. DyStar Leather Chemicals Sales (K MT), Revenue (US$ Million), Price (USD/MT) and Gross Margin (2017-2022)
Table 88. DyStar Leather Chemicals Product
Table 89. DyStar Leather Chemicals Sales Proportion of Leather Chemicals by Product in 2021
Table 90. DyStar Leather Chemicals Sales Proportion of Leather Chemicals by Application in 2021
Table 91. DyStar Leather Chemicals Sales Proportion of Leather Chemicals by Geographic Area in 2021
Table 92. Schill+Seilacher Corporation Information
Table 93. Schill+Seilacher Description and Business Overview
Table 94. Schill+Seilacher Leather Chemicals Sales (K MT), Revenue (US$ Million), Price (USD/MT) and Gross Margin (2017-2022)
Table 95. Schill+Seilacher Leather Chemicals Product
Table 96. Schill+Seilacher Leather Chemicals Sales Proportion of Leather Chemicals by Product in 2021
Table 97. Schill+Seilacher Leather Chemicals Sales Proportion of Leather Chemicals by Application in 2021
Table 98. Schill+Seilacher Leather Chemicals Sales Proportion of Leather Chemicals by Geographic Area in 2021
Table 99. Zschimmer & Schwarz Corporation Information
Table 100. Zschimmer & Schwarz Description and Business Overview
Table 101. Zschimmer & Schwarz Leather Chemicals Sales (K MT), Revenue (US$ Million), Price (USD/MT) and Gross Margin (2017-2022)
Table 102. Zschimmer & Schwarz Leather Chemicals Product
Table 103. Zschimmer & Schwarz Leather Chemicals Sales Proportion of Leather Chemicals by Product in 2021
Table 104. Zschimmer & Schwarz Leather Chemicals Sales Proportion of Leather Chemicals by Application in 2021
Table 105. Zschimmer & Schwarz Leather Chemicals Sales Proportion of Leather Chemicals by Geographic Area in 2021
Table 106. Brother Enterprises Corporation Information
Table 107. Brother Enterprises Description and Business Overview
Table 108. Brother Enterprises Leather Chemicals Sales (K MT), Revenue (US$ Million), Price (USD/MT) and Gross Margin (2017-2022)
Table 109. Brother Enterprises Leather Chemicals Product
Table 110. Brother Enterprises Leather Chemicals Sales Proportion of Leather Chemicals by Product in 2021
Table 111. Brother Enterprises Leather Chemicals Sales Proportion of Leather Chemicals by Application in 2021
Table 112. Brother Enterprises Leather Chemicals Sales Proportion of Leather Chemicals by Geographic Area in 2021
Table 113. Sichuan Decision Chemical Corporation Information
Table 114. Sichuan Decision Chemical Description and Business Overview
Table 115. Sichuan Decision Chemical Leather Chemicals Sales (K MT), Revenue (US$ Million), Price (USD/MT) and Gross Margin (2017-2022)
Table 116. Sichuan Decision Chemical Leather Chemicals Product
Table 117. Sichuan Decision Chemical Leather Chemicals Sales Proportion of Leather Chemicals by Product in 2021
Table 118. Sichuan Decision Chemical Leather Chemicals Sales Proportion of Leather Chemicals by Application in 2021
Table 119. Sichuan Decision Chemical Leather Chemicals Sales Proportion of Leather Chemicals by Geographic Area in 2021
Table 120. Dowell Science&Technology Corporation Information
Table 121. Dowell Science&Technology Description and Business Overview
Table 122. Dowell Science&Technology Leather Chemicals Sales (K MT), Revenue (US$ Million), Price (USD/MT) and Gross Margin (2017-2022)
Table 123. Dowell Science&Technology Leather Chemicals Product
Table 124. Dowell Science&Technology Leather Chemicals Sales Proportion of Leather Chemicals by Product in 2021
Table 125. Dowell Science&Technology Leather Chemicals Sales Proportion of Leather Chemicals by Application in 2021
Table 126. Dowell Science&Technology Leather Chemicals Sales Proportion of Leather Chemicals by Geographic Area in 2021
Table 127. Global Leather Chemicals Sales by Type (2017-2022) & (K MT)
Table 128. Global Leather Chemicals Sales Forecast by Type (2023-2028) & (K MT)
Table 129. Global Leather Chemicals Revenue by Type (2017-2022) & (US$ Million)
Table 130. Global Leather Chemicals Revenue Forecast by Type (2023-2028) & (US$ Million)
Table 131. Global Leather Chemicals Sales by Application (2017-2022) & (K MT)
Table 132. Global Leather Chemicals Sales Forecast by Application (2023-2028) & (K MT)
Table 133. Global Leather Chemicals Revenue by Application (2017-2022) & (US$ Million)
Table 134. Global Leather Chemicals Revenue Forecast by Application (2023-2028) & (US$ Million)
Table 135. North America Leather Chemicals Sales by Country (2017-2022) & (K MT)
Table 136. North America Leather Chemicals Sales by Country (2023-2028) & (K MT)
Table 137. North America Leather Chemicals Revenue by Country (2017-2022) & (US$ Million)
Table 138. North America Leather Chemicals Revenue by Country (2023-2028) & (US$ Million)
Table 139. North America Leather Chemicals Sales by Type (2017-2022) & (K MT)
Table 140. North America Leather Chemicals Sales by Application (2017-2022) & (K MT)
Table 141. Asia-Pacific Leather Chemicals Sales by Region (2017-2022) & (K MT)
Table 142. Asia-Pacific Leather Chemicals Sales by Region (2023-2028) & (K MT)
Table 143. Asia-Pacific Leather Chemicals Revenue by Region (2017-2028) & (US$ Million)
Table 144. Asia-Pacific Leather Chemicals Revenue by Region (2023-2028) & (US$ Million)
Table 145. Asia-Pacific Leather Chemicals Sales by Type (2017-2022) & (K MT)
Table 146. Asia-Pacific Leather Chemicals Sales by Application (2017-2022) & (K MT)
Table 147. Europe Leather Chemicals Sales by Country (2017-2022) & (K MT)
Table 148. Europe Leather Chemicals Sales by Country (2023-2028) & (K MT)
Table 149. Europe Leather Chemicals Revenue by Country (2017-2022) & (US$ Million)
Table 150. Europe Leather Chemicals Revenue by Country (2023-2028) & (US$ Million)
Table 151. Europe Leather Chemicals Sales by Type (2017-2022) & (K MT)
Table 152. Europe Leather Chemicals Sales by Application (2017-2022) & (K MT)
Table 153. Latin America Leather Chemicals Sales by Country (2017-2022) & (K MT)
Table 154. Latin America Leather Chemicals Sales by Country (2023-2028) & (K MT)
Table 155. Latin America Leather Chemicals Revenue by Country (2017-2022) & (US$ Million)
Table 156. Latin America Leather Chemicals Revenue by Country (2023-2028) & (US$ Million)
Table 157. Latin America Leather Chemicals Sales by Type (2017-2022) & (K MT)
Table 158. Latin America Leather Chemicals Sales by Application (2017-2022) & (K MT)
Table 159. Middle East and Africa Leather Chemicals Sales by Country (2017-2022) & (K MT)
Table 160. Middle East and Africa Leather Chemicals Sales by Country (2023-2028) & (K MT)
Table 161. Middle East and Africa Leather Chemicals Revenue by Country (2017-2022) & (US$ Million)
Table 162. Middle East and Africa Leather Chemicals Revenue by Country (2023-2028) & (US$ Million)
Table 163. Middle East and Africa Leather Chemicals Sales by Type (2017-2022) & (K MT)
Table 164. Middle East and Africa Leather Chemicals Sales by Application (2017-2022) & (K MT)
Table 165. Leather Chemicals Key Raw Materials, Industry Status and Trend
Table 166. Leather Chemicals Key Raw Materials and Upstream Suppliers
Table 167. Leather Chemicals Clients Status and Trend
Table 168. Leather Chemicals Typical Clients
Table 169. Leather Chemicals Distributors
Table 170. Leather Chemicals Market Trends
Table 171. Leather Chemicals Market Drivers
Table 172. Leather Chemicals Market Challenges
Table 173. Leather Chemicals Market Restraints
Table 174. Research Programs/Design for This Report
Table 175. Key Data Information from Secondary Sources
Table 176. Key Data Information from Primary Sources
List of Figures
Figure 1. Leather Chemicals Product Picture
Figure 2. Global Leather Chemicals Sales Market Share by Type in 2021 & 2028
Figure 3. Syntans Product Picture
Figure 4. Fatliquors Product Picture
Figure 5. Finishing Agent Product Picture
Figure 6. Others Product Picture
Figure 7. Global Leather Chemicals Sales Market Share by Application in 2021 & 2028
Figure 8. Clothing Leather Examples
Figure 9. Automobile Leather Examples
Figure 10. Furniture Leather Examples
Figure 11. Heavy Leather Examples
Figure 12. Others Examples
Figure 13. Leather Chemicals Report Years Considered
Figure 14. Global Leather Chemicals Market Size, (US$ Million), 2017 VS 2021 VS 2028
Figure 15. Global Leather Chemicals Market Size 2017-2028 (US$ Million)
Figure 16. Global Leather Chemicals Sales 2017-2028 (K MT)
Figure 17. Global Leather Chemicals Market Size Market Share by Region: 2022 Versus 2028
Figure 18. Global Leather Chemicals Sales Market Share Forecast by Region (2017-2028)
Figure 19. Global Leather Chemicals Revenue Market Share by Region (2017-2028)
Figure 20. Global Leather Chemicals Sales Share by Manufacturer in 2021
Figure 21. Leather Chemicals Market Share by Company Type (Tier 1, Tier 2 and Tier 3): 2017 VS 2021
Figure 22. Global Leather Chemicals Sales Market Share Forecast by Type (2017-2028)
Figure 23. Global Leather Chemicals Revenue Market Share Forecast by Type (2017-2028)
Figure 24. Leather Chemicals Average Selling Price (ASP) by Type (2017-2022) & (USD/MT)
Figure 25. Global Leather Chemicals Sales Market Share Forecast by Application (2017-2028)
Figure 26. Global Leather Chemicals Revenue Market Share Forecast by Application (2017-2028)
Figure 27. Leather Chemicals Average Selling Price (ASP) by Application (2017-2022) & (USD/MT)
Figure 28. North America Leather Chemicals Revenue 2017-2028 (US$ Million)
Figure 29. North America Leather Chemicals Sales Market Share by Type (2017-2022)
Figure 30. North America Leather Chemicals Sales Market Share by Application (2017-2022)
Figure 31. Asia-Pacific Leather Chemicals Revenue 2017-2028 (US$ Million)
Figure 32. Asia-Pacific Leather Chemicals Sales Market Share by Region (2017-2028)
Figure 33. Asia-Pacific Leather Chemicals Revenue Market Share by Region (2017-2028)
Figure 34. Asia-Pacific Leather Chemicals Sales Market Share by Type (2017-2022)
Figure 35. Asia-Pacific Leather Chemicals Sales Market Share by Application (2017-2022)
Figure 36. Europe Leather Chemicals Revenue Growth Rate 2017-2028 (US$ Million)
Figure 37. Europe Leather Chemicals Sales Market Share by Country (2017-2028)
Figure 38. Europe Leather Chemicals Revenue Market Share by Country (2017-2028)
Figure 39. Europe Leather Chemicals Sales Market Share by Type (2017-2022)
Figure 40. Europe Leather Chemicals Sales Market Share by Application (2017-2022)
Figure 41. Latin America Leather Chemicals Revenue Growth Rate 2017-2028 (US$ Million)
Figure 42. Latin America Leather Chemicals Sales Market Share by Country (2017-2028)
Figure 43. Latin America Leather Chemicals Revenue Market Share by Country (2017-2022)
Figure 44. Latin America Leather Chemicals Sales Market Share by Type (2017-2022)
Figure 45. Latin America Leather Chemicals Sales Market Share by Application (2017-2022)
Figure 46. Middle East and Africa Leather Chemicals Revenue Growth Rate 2017-2028 (US$ Million)
Figure 47. Middle East and Africa Leather Chemicals Sales Market Share by Country (2017-2028)
Figure 48. Middle East and Africa Leather Chemicals Revenue Market Share by Country (2017-2028)
Figure 49. Middle East and Africa Leather Chemicals Sales Market Share by Type (2017-2022)
Figure 50. Middle East and Africa Leather Chemicals Sales Market Share by Application (2017-2022)
Figure 51. Leather Chemicals Supply Chain (Upstream and Downstream Market)
Figure 52. Global Production Market Share of Leather Chemicals Raw Materials by Region in 2021
Figure 53. Leather Chemicals Distribution Channels
Figure 54. Global Leather Chemicals Percentage 2017-2028: Indirect Sales VS Direct Sales
Figure 55. Global Leather Chemicals Percentage 2017-2028: Online Sales VS Offline Sales
Figure 56. Bottom-up and Top-down Approaches for This Report
Figure 57. Data Triangulation
$5900
$11800
HAVE A QUERY?
OUR CUSTOMER
