List of Tables
Table 1. Lip Balm CAGR in Value, India VS Global, 2018 VS 2022 VS 2029
Table 2. Lip Balm Market Trends
Table 3. Lip Balm Market Drivers
Table 4. Lip Balm Market Challenges
Table 5. Lip Balm Market Restraints
Table 6. Global Lip Balm Sales Growth Rate (CAGR) by Type: 2018 VS 2022 VS 2029 (US$ Million)
Table 7. India Lip Balm Sales Growth Rate (CAGR) by Type: 2018 VS 2022 VS 2029 (US$ Million)
Table 8. Global Lip Balm Sales Growth Rate (CAGR) by Application: 2018 VS 2022 VS 2029 (US$ Million)
Table 9. India Lip Balm Sales Growth Rate (CAGR) by Application: 2018 VS 2022 VS 2029 (US$ Million)
Table 10. Global Key Manufacturers of Lip Balm, Ranked by Revenue (2022) & (US$ Million)
Table 11. Global Lip Balm Revenue by Manufacturer, (US$ Million), 2018-2023
Table 12. Global Lip Balm Revenue Share by Manufacturer, 2018-2023
Table 13. Global Lip Balm Sales by Manufacturer, (K Units), 2018-2023
Table 14. Global Lip Balm Sales Share by Manufacturer, 2018-2023
Table 15. Global Lip Balm Price by Manufacturer (2018-2023) & (USD/Unit)
Table 16. Global Lip Balm Manufacturers Market Concentration Ratio (CR5 and HHI)
Table 17. Global Lip Balm by Company Type (Tier 1, Tier 2, and Tier 3) & (based on the Revenue in Lip Balm as of 2022)
Table 18. Global Key Manufacturers of Lip Balm, Manufacturing Base Distribution and Headquarters
Table 19. Global Key Manufacturers of Lip Balm, Product Offered and Application
Table 20. Global Key Manufacturers of Lip Balm, Date of Enter into This Industry
Table 21. Manufacturers Mergers & Acquisitions, Expansion Plans
Table 22. Key Players of Lip Balm in India, Ranked by Revenue (2022) & (US$ million)
Table 23. India Lip Balm Revenue by Players, (US$ Million), (2018-2023)
Table 24. India Lip Balm Revenue Share by Players, (2018-2023)
Table 25. India Lip Balm Sales by Players, (K Units), (2018-2023)
Table 26. India Lip Balm Sales Share by Players, (2018-2023)
Table 27. Global Lip Balm Market Size Growth Rate (CAGR) by Region (US$ Million): 2018 VS 2022 VS 2029
Table 28. Global Lip Balm Sales in Volume by Region (2018-2023) & (K Units)
Table 29. Global Lip Balm Sales in Volume Forecast by Region (2024-2029) & (K Units)
Table 30. Global Lip Balm Sales in Value by Region (2018-2023) & (US$ Million)
Table 31. Global Lip Balm Sales in Value Forecast by Region (2024-2029) & (US$ Million)
Table 32. Americas Lip Balm Market Size Growth Rate (CAGR) by Country (US$ Million): 2018 VS 2022 VS 2029
Table 33. Americas Lip Balm Sales in Value by Country (2018-2023) & (US$ Million)
Table 34. Americas Lip Balm Sales in Value by Country (2024-2029) & (US$ Million)
Table 35. Americas Lip Balm Sales in Volume by Country (2018-2023) & (K Units)
Table 36. Americas Lip Balm Sales in Volume by Country (2024-2029) & (K Units)
Table 37. EMEA Lip Balm Market Size Growth Rate (CAGR) by Country (US$ Million): 2018 VS 2022 VS 2029
Table 38. EMEA Lip Balm Sales in Value by Country (2018-2023) & (US$ Million)
Table 39. EMEA Lip Balm Sales in Value by Country (2024-2029) & (US$ Million)
Table 40. EMEA Lip Balm Sales in Volume by Country (2018-2023) & (K Units)
Table 41. EMEA Lip Balm Sales in Volume by Country (2024-2029) & (K Units)
Table 42. APAC Lip Balm Market Size Growth Rate (CAGR) by Country (US$ Million): 2018 VS 2022 VS 2029
Table 43. APAC Lip Balm Sales in Value by Country (2018-2023) & (US$ Million)
Table 44. APAC Lip Balm Sales in Value by Country (2024-2029) & (US$ Million)
Table 45. APAC Lip Balm Sales in Volume by Country (2018-2023) & (K Units)
Table 46. APAC Lip Balm Sales in Volume by Country (2024-2029) & (K Units)
Table 47. Mentholatum Company Information
Table 48. Mentholatum Description and Business Overview
Table 49. Mentholatum Lip Balm Sales (K Units), Revenue (US$ Million), Price (USD/Unit) and Gross Margin (2018-2023)
Table 50. Mentholatum Lip Balm Product
Table 51. Mentholatum Recent Development
Table 52. Maybelline Company Information
Table 53. Maybelline Description and Business Overview
Table 54. Maybelline Lip Balm Sales (K Units), Revenue (US$ Million), Price (USD/Unit) and Gross Margin (2018-2023)
Table 55. Maybelline Lip Balm Product
Table 56. Maybelline Recent Development
Table 57. Nivea Company Information
Table 58. Nivea Description and Business Overview
Table 59. Nivea Lip Balm Sales (K Units), Revenue (US$ Million), Price (USD/Unit) and Gross Margin (2018-2023)
Table 60. Nivea Lip Balm Product
Table 61. Nivea Recent Development
Table 62. Kiehl Company Information
Table 63. Kiehl Description and Business Overview
Table 64. Kiehl Lip Balm Sales (K Units), Revenue (US$ Million), Price (USD/Unit) and Gross Margin (2018-2023)
Table 65. Kiehl Lip Balm Product
Table 66. Kiehl Recent Development
Table 67. MAC Company Information
Table 68. MAC Description and Business Overview
Table 69. MAC Lip Balm Sales (K Units), Revenue (US$ Million), Price (USD/Unit) and Gross Margin (2018-2023)
Table 70. MAC Lip Balm Product
Table 71. MAC Recent Development
Table 72. DHC Company Information
Table 73. DHC Description and Business Overview
Table 74. DHC Lip Balm Sales (K Units), Revenue (US$ Million), Price (USD/Unit) and Gross Margin (2018-2023)
Table 75. DHC Lip Balm Product
Table 76. DHC Recent Development
Table 77. SHISEIDO Company Information
Table 78. SHISEIDO Description and Business Overview
Table 79. SHISEIDO Lip Balm Sales (K Units), Revenue (US$ Million), Price (USD/Unit) and Gross Margin (2018-2023)
Table 80. SHISEIDO Lip Balm Product
Table 81. SHISEIDO Recent Development
Table 82. Lancome Company Information
Table 83. Lancome Description and Business Overview
Table 84. Lancome Lip Balm Sales (K Units), Revenue (US$ Million), Price (USD/Unit) and Gross Margin (2018-2023)
Table 85. Lancome Lip Balm Product
Table 86. Lancome Recent Development
Table 87. Neutrogena Company Information
Table 88. Neutrogena Description and Business Overview
Table 89. Neutrogena Lip Balm Sales (K Units), Revenue (US$ Million), Price (USD/Unit) and Gross Margin (2018-2023)
Table 90. Neutrogena Lip Balm Product
Table 91. Neutrogena Recent Development
Table 92. CHANEL Company Information
Table 93. CHANEL Description and Business Overview
Table 94. CHANEL Lip Balm Sales (K Units), Revenue (US$ Million), Price (USD/Unit) and Gross Margin (2018-2023)
Table 95. CHANEL Lip Balm Product
Table 96. CHANEL Recent Development
Table 97. Yue sai Company Information
Table 98. Yue sai Description and Business Overview
Table 99. Yue sai Lip Balm Sales (K Units), Revenue (US$ Million), Price (USD/Unit) and Gross Margin (2018-2023)
Table 100. Yue sai Lip Balm Product
Table 101. Yue sai Recent Development
Table 102. Max Factor Company Information
Table 103. Max Factor Description and Business Overview
Table 104. Max Factor Lip Balm Sales (K Units), Revenue (US$ Million), Price (USD/Unit) and Gross Margin (2018-2023)
Table 105. Max Factor Lip Balm Product
Table 106. Max Factor Recent Development
Table 107. Elizabeth Arden Company Information
Table 108. Elizabeth Arden Description and Business Overview
Table 109. Elizabeth Arden Lip Balm Sales (K Units), Revenue (US$ Million), Price (USD/Unit) and Gross Margin (2018-2023)
Table 110. Elizabeth Arden Lip Balm Product
Table 111. Elizabeth Arden Recent Development
Table 112. Clinique Company Information
Table 113. Clinique Description and Business Overview
Table 114. Clinique Lip Balm Sales (K Units), Revenue (US$ Million), Price (USD/Unit) and Gross Margin (2018-2023)
Table 115. Clinique Lip Balm Product
Table 116. Clinique Recent Development
Table 117. MARY KAY Company Information
Table 118. MARY KAY Description and Business Overview
Table 119. MARY KAY Lip Balm Sales (K Units), Revenue (US$ Million), Price (USD/Unit) and Gross Margin (2018-2023)
Table 120. MARY KAY Lip Balm Product
Table 121. MARY KAY Recent Development
Table 122. L'Oreal Company Information
Table 123. L'Oreal Description and Business Overview
Table 124. L'Oreal Lip Balm Sales (K Units), Revenue (US$ Million), Price (USD/Unit) and Gross Margin (2018-2023)
Table 125. L'Oreal Lip Balm Product
Table 126. L'Oreal Recent Development
Table 127. NUXE Company Information
Table 128. NUXE Description and Business Overview
Table 129. NUXE Lip Balm Sales (K Units), Revenue (US$ Million), Price (USD/Unit) and Gross Margin (2018-2023)
Table 130. NUXE Lip Balm Product
Table 131. NUXE Recent Development
Table 132. Revlon Company Information
Table 133. Revlon Description and Business Overview
Table 134. Revlon Lip Balm Sales (K Units), Revenue (US$ Million), Price (USD/Unit) and Gross Margin (2018-2023)
Table 135. Revlon Lip Balm Product
Table 136. Revlon Recent Development
Table 137. Burt's Bees Company Information
Table 138. Burt's Bees Description and Business Overview
Table 139. Burt's Bees Lip Balm Sales (K Units), Revenue (US$ Million), Price (USD/Unit) and Gross Margin (2018-2023)
Table 140. Burt's Bees Lip Balm Product
Table 141. Burt's Bees Recent Development
Table 142. Blistex Company Information
Table 143. Blistex Description and Business Overview
Table 144. Blistex Lip Balm Sales (K Units), Revenue (US$ Million), Price (USD/Unit) and Gross Margin (2018-2023)
Table 145. Blistex Lip Balm Product
Table 146. Blistex Recent Development
Table 147. Vaseline Company Information
Table 148. Vaseline Description and Business Overview
Table 149. Vaseline Lip Balm Sales (K Units), Revenue (US$ Million), Price (USD/Unit) and Gross Margin (2018-2023)
Table 150. Vaseline Lip Balm Product
Table 151. Vaseline Recent Development
Table 152. EOS Company Information
Table 153. EOS Description and Business Overview
Table 154. EOS Lip Balm Sales (K Units), Revenue (US$ Million), Price (USD/Unit) and Gross Margin (2018-2023)
Table 155. EOS Lip Balm Product
Table 156. EOS Recent Development
Table 157. Carmex Company Information
Table 158. Carmex Description and Business Overview
Table 159. Carmex Lip Balm Sales (K Units), Revenue (US$ Million), Price (USD/Unit) and Gross Margin (2018-2023)
Table 160. Carmex Lip Balm Product
Table 161. Carmex Recent Development
Table 162. Labello Company Information
Table 163. Labello Description and Business Overview
Table 164. Labello Lip Balm Sales (K Units), Revenue (US$ Million), Price (USD/Unit) and Gross Margin (2018-2023)
Table 165. Labello Lip Balm Product
Table 166. Labello Recent Development
Table 167. ChapStick Company Information
Table 168. ChapStick Description and Business Overview
Table 169. ChapStick Lip Balm Sales (K Units), Revenue (US$ Million), Price (USD/Unit) and Gross Margin (2018-2023)
Table 170. ChapStick Lip Balm Product
Table 171. ChapStick Recent Development
Table 172. Lip Smacker Company Information
Table 173. Lip Smacker Description and Business Overview
Table 174. Lip Smacker Lip Balm Sales (K Units), Revenue (US$ Million), Price (USD/Unit) and Gross Margin (2018-2023)
Table 175. Lip Smacker Lip Balm Product
Table 176. Lip Smacker Recent Development
Table 177. AVON Company Information
Table 178. AVON Description and Business Overview
Table 179. AVON Lip Balm Sales (K Units), Revenue (US$ Million), Price (USD/Unit) and Gross Margin (2018-2023)
Table 180. AVON Lip Balm Product
Table 181. AVON Recent Development
Table 182. Lypsyl Company Information
Table 183. Lypsyl Description and Business Overview
Table 184. Lypsyl Lip Balm Sales (K Units), Revenue (US$ Million), Price (USD/Unit) and Gross Margin (2018-2023)
Table 185. Lypsyl Lip Balm Product
Table 186. Lypsyl Recent Development
Table 187. CARSLAN Company Information
Table 188. CARSLAN Description and Business Overview
Table 189. CARSLAN Lip Balm Sales (K Units), Revenue (US$ Million), Price (USD/Unit) and Gross Margin (2018-2023)
Table 190. CARSLAN Lip Balm Product
Table 191. CARSLAN Recent Development
Table 192. Ainuo Company Information
Table 193. Ainuo Description and Business Overview
Table 194. Ainuo Lip Balm Sales (K Units), Revenue (US$ Million), Price (USD/Unit) and Gross Margin (2018-2023)
Table 195. Ainuo Lip Balm Product
Table 196. Ainuo Recent Development
Table 197. Key Raw Materials Lists
Table 198. Raw Materials Key Suppliers Lists
Table 199. Lip Balm Customers List
Table 200. Lip Balm Distributors List
Table 201. Research Programs/Design for This Report
Table 202. Key Data Information from Secondary Sources
Table 203. Key Data Information from Primary Sources
List of Figures
Figure 1. Lip Balm Product Picture
Figure 2. Global Lip Balm Revenue, (US$ Million), 2018 VS 2022 VS 2029
Figure 3. Global Lip Balm Market Size 2018-2029 (US$ Million)
Figure 4. Global Lip Balm Sales 2018-2029 (K Units)
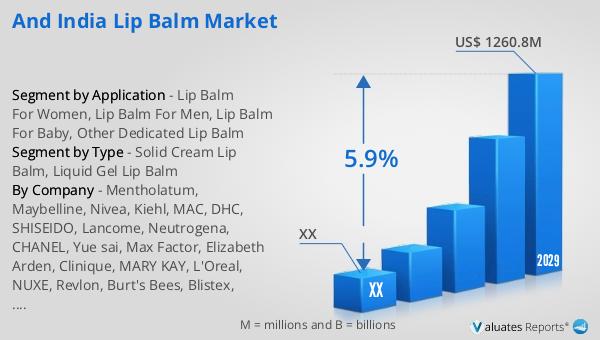
Figure 5. India Lip Balm Revenue, (US$ Million), 2018 VS 2022 VS 2029
Figure 6. India Lip Balm Market Size 2018-2029 (US$ Million)
Figure 7. India Lip Balm Sales 2018-2029 (K Units)
Figure 8. India Lip Balm Market Share in Global, in Value (US$ Million) 2018-2029
Figure 9. India Lip Balm Market Share in Global, in Volume (K Units) 2018-2029
Figure 10. Lip Balm Report Years Considered
Figure 11. Product Picture of Solid Cream Lip Balm
Figure 12. Product Picture of Liquid Gel Lip Balm
Figure 13. Global Lip Balm Market Share by Type in 2022 & 2029
Figure 14. Global Lip Balm Sales in Value by Type (2018-2029) & (US$ Million)
Figure 15. Global Lip Balm Sales Market Share in Value by Type (2018-2029)
Figure 16. Global Lip Balm Sales by Type (2018-2029) & (K Units)
Figure 17. Global Lip Balm Sales Market Share in Volume by Type (2018-2029)
Figure 18. Global Lip Balm Price by Type (2018-2029) & (USD/Unit)
Figure 19. India Lip Balm Market Share by Type in 2022 & 2029
Figure 20. India Lip Balm Sales in Value by Type (2018-2029) & (US$ Million)
Figure 21. India Lip Balm Sales Market Share in Value by Type (2018-2029)
Figure 22. India Lip Balm Sales by Type (2018-2029) & (K Units)
Figure 23. India Lip Balm Sales Market Share in Volume by Type (2018-2029)
Figure 24. India Lip Balm Price by Type (2018-2029) & (USD/Unit)
Figure 25. Product Picture of Lip Balm For Women
Figure 26. Product Picture of Lip Balm For Men
Figure 27. Product Picture of Lip Balm For Baby
Figure 28. Product Picture of Other Dedicated Lip Balm
Figure 29. Global Lip Balm Market Share by Application in 2022 & 2029
Figure 30. Global Lip Balm Sales in Value by Application (2018-2029) & (US$ Million)
Figure 31. Global Lip Balm Sales Market Share in Value by Application (2018-2029)
Figure 32. Global Lip Balm Sales by Application (2018-2029) & (K Units)
Figure 33. Global Lip Balm Sales Market Share in Volume by Application (2018-2029)
Figure 34. Global Lip Balm Price by Application (2018-2029) & (USD/Unit)
Figure 35. India Lip Balm Market Share by Application in 2022 & 2029
Figure 36. India Lip Balm Sales in Value by Application (2018-2029) & (US$ Million)
Figure 37. India Lip Balm Sales Market Share in Value by Application (2018-2029)
Figure 38. India Lip Balm Sales by Application (2018-2029) & (K Units)
Figure 39. India Lip Balm Sales Market Share in Volume by Application (2018-2029)
Figure 40. India Lip Balm Price by Application (2018-2029) & (USD/Unit)
Figure 41. Americas Lip Balm Sales in Volume Growth Rate 2018-2029 (K Units)
Figure 42. Americas Lip Balm Sales in Value Growth Rate 2018-2029 (US$ Million)
Figure 43. Americas Lip Balm Sales by Type (2018-2029) & (K Units)
Figure 44. Americas Lip Balm Sales Market Share in Volume by Type (2018-2029)
Figure 45. Americas Lip Balm Sales by Application (2018-2029) & (K Units)
Figure 46. Americas Lip Balm Sales Market Share in Volume by Application (2018-2029)
Figure 47. United States Lip Balm Sales in Value Growth Rate (2018-2029) & (US$ Million)
Figure 48. Canada Lip Balm Sales in Value Growth Rate (2018-2029) & (US$ Million)
Figure 49. Mexico Lip Balm Sales in Value Growth Rate (2018-2029) & (US$ Million)
Figure 50. Brazil Lip Balm Sales in Value Growth Rate (2018-2029) & (US$ Million)
Figure 51. EMEA Lip Balm Sales in Volume Growth Rate 2018-2029 (K Units)
Figure 52. EMEA Lip Balm Sales in Value Growth Rate 2018-2029 (US$ Million)
Figure 53. EMEA Lip Balm Sales by Type (2018-2029) & (K Units)
Figure 54. EMEA Lip Balm Sales Market Share in Volume by Type (2018-2029)
Figure 55. EMEA Lip Balm Sales by Application (2018-2029) & (K Units)
Figure 56. EMEA Lip Balm Sales Market Share in Volume by Application (2018-2029)
Figure 57. Europe Lip Balm Sales in Value Growth Rate (2018-2029) & (US$ Million)
Figure 58. Middle East Lip Balm Sales in Value Growth Rate (2018-2029) & (US$ Million)
Figure 59. Africa Lip Balm Sales in Value Growth Rate (2018-2029) & (US$ Million)
Figure 60. China Lip Balm Sales in Volume Growth Rate 2018-2029 (K Units)
Figure 61. China Lip Balm Sales in Value Growth Rate 2018-2029 (US$ Million)
Figure 62. China Lip Balm Sales by Type (2018-2029) & (K Units)
Figure 63. China Lip Balm Sales Market Share in Volume by Type (2018-2029)
Figure 64. China Lip Balm Sales by Application (2018-2029) & (K Units)
Figure 65. China Lip Balm Sales Market Share in Volume by Application (2018-2029)
Figure 66. APAC Lip Balm Sales in Volume Growth Rate 2018-2029 (K Units)
Figure 67. APAC Lip Balm Sales in Value Growth Rate 2018-2029 (US$ Million)
Figure 68. APAC Lip Balm Sales by Type (2018-2029) & (K Units)
Figure 69. APAC Lip Balm Sales Market Share in Volume by Type (2018-2029)
Figure 70. APAC Lip Balm Sales by Application (2018-2029) & (K Units)
Figure 71. APAC Lip Balm Sales Market Share in Volume by Application (2018-2029)
Figure 72. Japan Lip Balm Sales in Value Growth Rate (2018-2029) & (US$ Million)
Figure 73. South Korea Lip Balm Sales in Value Growth Rate (2018-2029) & (US$ Million)
Figure 74. China Taiwan Lip Balm Sales in Value Growth Rate (2018-2029) & (US$ Million)
Figure 75. Southeast Asia Lip Balm Sales in Value Growth Rate (2018-2029) & (US$ Million)
Figure 76. India Lip Balm Sales in Value Growth Rate (2018-2029) & (US$ Million)
Figure 77. Lip Balm Value Chain
Figure 78. Lip Balm Production Process
Figure 79. Channels of Distribution
Figure 80. Distributors Profiles
Figure 81. Bottom-up and Top-down Approaches for This Report
Figure 82. Data Triangulation
Figure 83. Key Executives Interviewed