1 Market Overview
1.1 PIM Testing System Product Introduction
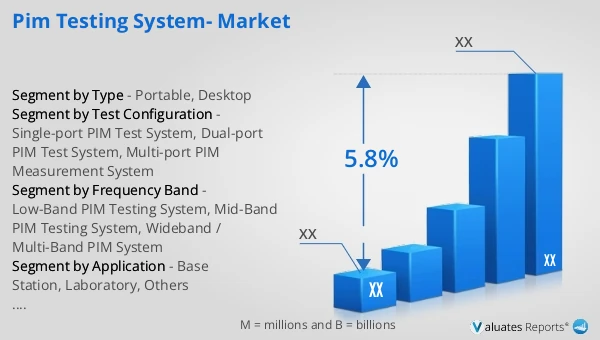
1.2 Global PIM Testing System Market Size Forecast
1.2.1 Global PIM Testing System Sales Value (2021–2032)
1.2.2 Global PIM Testing System Sales Volume (2021–2032)
1.2.3 Global PIM Testing System Sales Price (2021–2032)
1.3 PIM Testing System Market Trends & Drivers
1.3.1 PIM Testing System Industry Trends
1.3.2 PIM Testing System Market Drivers & Opportunities
1.3.3 PIM Testing System Market Challenges
1.3.4 PIM Testing System Market Restraints
1.3.5 Impact of U.S. Tariffs
1.4 Assumptions and Limitations
1.5 Study Objectives
1.6 Years Considered
2 Competitive Analysis by Company
2.1 Global PIM Testing System Players Revenue Ranking (2025)
2.2 Global PIM Testing System Revenue by Company (2021–2026)
2.3 Global PIM Testing System Sales Volume Ranking of Players (2025)
2.4 Global PIM Testing System Sales Volume by Company (2021–2026)
2.5 Global PIM Testing System Average Price by Company (2021–2026)
2.6 Key Manufacturers PIM Testing System Manufacturing Base and Headquarters
2.7 Key Manufacturers PIM Testing System Product Offerings
2.8 Key Manufacturers Start of Mass Production of PIM Testing System
2.9 PIM Testing System Market Competitive Analysis
2.9.1 PIM Testing System Market Concentration Rate (2021–2026)
2.9.2 Global 5 and 10 Largest Manufacturers by PIM Testing System Revenue in 2025
2.9.3 Global Companies by Tier (Tier 1, Tier 2, Tier 3), based on PIM Testing System revenue, 2025
2.10 Mergers & Acquisitions and Expansion
3 Segmentation PIM Testing System Market Classification
3.1 Introduction by Type
3.1.1 Portable
3.1.2 Desktop
3.1.3 Global PIM Testing System Sales Value by Type
3.1.3.1 Global PIM Testing System Sales Value by Type (2021 vs 2025 vs 2032)
3.1.3.2 Global PIM Testing System Sales Value, by Type (2021–2032)
3.1.3.3 Global PIM Testing System Sales Value, by Type (%), 2021–2032
3.1.4 Global PIM Testing System Sales Volume by Type
3.1.4.1 Global PIM Testing System Sales Volume by Type (2021 vs 2025 vs 2032)
3.1.4.2 Global PIM Testing System Sales Volume, by Type (2021–2032)
3.1.4.3 Global PIM Testing System Sales Volume, by Type (%), 2021–2032
3.1.5 Global PIM Testing System Average Price by Type (2021–2032)
3.2 Introduction by Frequency Band
3.2.1 Low-Band PIM Testing System
3.2.2 Mid-Band PIM Testing System
3.2.3 Wideband / Multi-Band PIM System
3.2.4 Global PIM Testing System Sales Value by Frequency Band
3.2.4.1 Global PIM Testing System Sales Value by Frequency Band (2021 vs 2025 vs 2032)
3.2.4.2 Global PIM Testing System Sales Value, by Frequency Band (2021–2032)
3.2.4.3 Global PIM Testing System Sales Value, by Frequency Band (%), 2021–2032
3.2.5 Global PIM Testing System Sales Volume by Frequency Band
3.2.5.1 Global PIM Testing System Sales Volume by Frequency Band (2021 vs 2025 vs 2032)
3.2.5.2 Global PIM Testing System Sales Volume, by Frequency Band (2021–2032)
3.2.5.3 Global PIM Testing System Sales Volume, by Frequency Band (%), 2021–2032
3.2.6 Global PIM Testing System Average Price by Frequency Band (2021–2032)
3.3 Introduction by Test Configuration
3.3.1 Single-port PIM Test System
3.3.2 Dual-port PIM Test System
3.3.3 Multi-port PIM Measurement System
3.3.4 Global PIM Testing System Sales Value by Test Configuration
3.3.4.1 Global PIM Testing System Sales Value by Test Configuration (2021 vs 2025 vs 2032)
3.3.4.2 Global PIM Testing System Sales Value, by Test Configuration (2021–2032)
3.3.4.3 Global PIM Testing System Sales Value, by Test Configuration (%), 2021–2032
3.3.5 Global PIM Testing System Sales Volume by Test Configuration
3.3.5.1 Global PIM Testing System Sales Volume by Test Configuration (2021 vs 2025 vs 2032)
3.3.5.2 Global PIM Testing System Sales Volume, by Test Configuration (2021–2032)
3.3.5.3 Global PIM Testing System Sales Volume, by Test Configuration (%), 2021–2032
3.3.6 Global PIM Testing System Average Price by Test Configuration (2021–2032)
4 Segmentation by Application
4.1 Introduction by Application
4.1.1 Base Station
4.1.2 Laboratory
4.1.3 Others
4.2 Global PIM Testing System Sales Value by Application
4.2.1 Global PIM Testing System Sales Value by Application (2021 vs 2025 vs 2032)
4.2.2 Global PIM Testing System Sales Value, by Application (2021–2032)
4.2.3 Global PIM Testing System Sales Value, by Application (%), 2021–2032
4.3 Global PIM Testing System Sales Volume by Application
4.3.1 Global PIM Testing System Sales Volume by Application (2021 vs 2025 vs 2032)
4.3.2 Global PIM Testing System Sales Volume, by Application (2021–2032)
4.3.3 Global PIM Testing System Sales Volume, by Application (%), 2021–2032
4.4 Global PIM Testing System Average Price by Application (2021–2032)
5 Segmentation by Region
5.1 Global PIM Testing System Sales Value by Region
5.1.1 Global PIM Testing System Sales Value by Region: 2021 vs 2025 vs 2032
5.1.2 Global PIM Testing System Sales Value by Region (2021–2026)
5.1.3 Global PIM Testing System Sales Value by Region (2027–2032)
5.1.4 Global PIM Testing System Sales Value by Region (%), 2021–2032
5.2 Global PIM Testing System Sales Volume by Region
5.2.1 Global PIM Testing System Sales Volume by Region: 2021 vs 2025 vs 2032
5.2.2 Global PIM Testing System Sales Volume by Region (2021–2026)
5.2.3 Global PIM Testing System Sales Volume by Region (2027–2032)
5.2.4 Global PIM Testing System Sales Volume by Region (%), 2021–2032
5.3 Global PIM Testing System Average Price by Region (2021–2032)
5.4 North America
5.4.1 North America PIM Testing System Sales Value, 2021–2032
5.4.2 North America PIM Testing System Sales Value by Country (%), 2025 vs 2032
5.5 Europe
5.5.1 Europe PIM Testing System Sales Value, 2021–2032
5.5.2 Europe PIM Testing System Sales Value by Country (%), 2025 vs 2032
5.6 Asia Pacific
5.6.1 Asia Pacific PIM Testing System Sales Value, 2021–2032
5.6.2 Asia Pacific PIM Testing System Sales Value by Region (%), 2025 vs 2032
5.7 South America
5.7.1 South America PIM Testing System Sales Value, 2021–2032
5.7.2 South America PIM Testing System Sales Value by Country (%), 2025 vs 2032
5.8 Middle East & Africa
5.8.1 Middle East & Africa PIM Testing System Sales Value, 2021–2032
5.8.2 Middle East & Africa PIM Testing System Sales Value by Country (%), 2025 vs 2032
6 Segmentation by Key Countries/Regions
6.1 Key Countries/Regions PIM Testing System Sales Value Growth Trends, 2021 vs 2025 vs 2032
6.2 Key Countries/Regions PIM Testing System Sales Value and Sales Volume
6.2.1 Key Countries/Regions PIM Testing System Sales Value, 2021–2032
6.2.2 Key Countries/Regions PIM Testing System Sales Volume, 2021–2032
6.3 United States
6.3.1 United States PIM Testing System Sales Value, 2021–2032
6.3.2 United States PIM Testing System Sales Value by Type (%), 2025 vs 2032
6.3.3 United States PIM Testing System Sales Value by Application, 2025 vs 2032
6.4 Europe
6.4.1 Europe PIM Testing System Sales Value, 2021–2032
6.4.2 Europe PIM Testing System Sales Value by Type (%), 2025 vs 2032
6.4.3 Europe PIM Testing System Sales Value by Application, 2025 vs 2032
6.5 China
6.5.1 China PIM Testing System Sales Value, 2021–2032
6.5.2 China PIM Testing System Sales Value by Type (%), 2025 vs 2032
6.5.3 China PIM Testing System Sales Value by Application, 2025 vs 2032
6.6 Japan
6.6.1 Japan PIM Testing System Sales Value, 2021–2032
6.6.2 Japan PIM Testing System Sales Value by Type (%), 2025 vs 2032
6.6.3 Japan PIM Testing System Sales Value by Application, 2025 vs 2032
6.7 South Korea
6.7.1 South Korea PIM Testing System Sales Value, 2021–2032
6.7.2 South Korea PIM Testing System Sales Value by Type (%), 2025 vs 2032
6.7.3 South Korea PIM Testing System Sales Value by Application, 2025 vs 2032
6.8 Southeast Asia
6.8.1 Southeast Asia PIM Testing System Sales Value, 2021–2032
6.8.2 Southeast Asia PIM Testing System Sales Value by Type (%), 2025 vs 2032
6.8.3 Southeast Asia PIM Testing System Sales Value by Application, 2025 vs 2032
6.9 India
6.9.1 India PIM Testing System Sales Value, 2021–2032
6.9.2 India PIM Testing System Sales Value by Type (%), 2025 vs 2032
6.9.3 India PIM Testing System Sales Value by Application, 2025 vs 2032
7 Company Profiles
7.1 Anritsu
7.1.1 Anritsu Company Information
7.1.2 Anritsu Introduction and Business Overview
7.1.3 Anritsu PIM Testing System Sales, Revenue, Price and Gross Margin (2021–2026)
7.1.4 Anritsu PIM Testing System Product Offerings
7.1.5 Anritsu Recent Developments
7.2 CommScope
7.2.1 CommScope Company Information
7.2.2 CommScope Introduction and Business Overview
7.2.3 CommScope PIM Testing System Sales, Revenue, Price and Gross Margin (2021–2026)
7.2.4 CommScope PIM Testing System Product Offerings
7.2.5 CommScope Recent Developments
7.3 Kaelus
7.3.1 Kaelus Company Information
7.3.2 Kaelus Introduction and Business Overview
7.3.3 Kaelus PIM Testing System Sales, Revenue, Price and Gross Margin (2021–2026)
7.3.4 Kaelus PIM Testing System Product Offerings
7.3.5 Kaelus Recent Developments
7.4 Rosenberger
7.4.1 Rosenberger Company Information
7.4.2 Rosenberger Introduction and Business Overview
7.4.3 Rosenberger PIM Testing System Sales, Revenue, Price and Gross Margin (2021–2026)
7.4.4 Rosenberger PIM Testing System Product Offerings
7.4.5 Rosenberger Recent Developments
7.5 Rohde & Schwarz
7.5.1 Rohde & Schwarz Company Information
7.5.2 Rohde & Schwarz Introduction and Business Overview
7.5.3 Rohde & Schwarz PIM Testing System Sales, Revenue, Price and Gross Margin (2021–2026)
7.5.4 Rohde & Schwarz PIM Testing System Product Offerings
7.5.5 Rohde & Schwarz Recent Developments
7.6 AWT Global
7.6.1 AWT Global Company Information
7.6.2 AWT Global Introduction and Business Overview
7.6.3 AWT Global PIM Testing System Sales, Revenue, Price and Gross Margin (2021–2026)
7.6.4 AWT Global PIM Testing System Product Offerings
7.6.5 AWT Global Recent Developments
7.7 RF Industries
7.7.1 RF Industries Company Information
7.7.2 RF Industries Introduction and Business Overview
7.7.3 RF Industries PIM Testing System Sales, Revenue, Price and Gross Margin (2021–2026)
7.7.4 RF Industries PIM Testing System Product Offerings
7.7.5 RF Industries Recent Developments
7.8 SPINNER Group
7.8.1 SPINNER Group Company Information
7.8.2 SPINNER Group Introduction and Business Overview
7.8.3 SPINNER Group PIM Testing System Sales, Revenue, Price and Gross Margin (2021–2026)
7.8.4 SPINNER Group PIM Testing System Product Offerings
7.8.5 SPINNER Group Recent Developments
7.9 Keysight
7.9.1 Keysight Company Information
7.9.2 Keysight Introduction and Business Overview
7.9.3 Keysight PIM Testing System Sales, Revenue, Price and Gross Margin (2021–2026)
7.9.4 Keysight PIM Testing System Product Offerings
7.9.5 Keysight Recent Developments
7.10 Nanjing Rflight Communication Electronics
7.10.1 Nanjing Rflight Communication Electronics Company Information
7.10.2 Nanjing Rflight Communication Electronics Introduction and Business Overview
7.10.3 Nanjing Rflight Communication Electronics PIM Testing System Sales, Revenue, Price and Gross Margin (2021–2026)
7.10.4 Nanjing Rflight Communication Electronics PIM Testing System Product Offerings
7.10.5 Nanjing Rflight Communication Electronics Recent Developments
7.11 Test Teknik
7.11.1 Test Teknik Company Information
7.11.2 Test Teknik Introduction and Business Overview
7.11.3 Test Teknik PIM Testing System Sales, Revenue, Price and Gross Margin (2021–2026)
7.11.4 Test Teknik PIM Testing System Product Offerings
7.11.5 Test Teknik Recent Developments
7.12 PIMTEK Instrument
7.12.1 PIMTEK Instrument Company Information
7.12.2 PIMTEK Instrument Introduction and Business Overview
7.12.3 PIMTEK Instrument PIM Testing System Sales, Revenue, Price and Gross Margin (2021–2026)
7.12.4 PIMTEK Instrument PIM Testing System Product Offerings
7.12.5 PIMTEK Instrument Recent Developments
7.13 Jagat RF Solutions
7.13.1 Jagat RF Solutions Company Information
7.13.2 Jagat RF Solutions Introduction and Business Overview
7.13.3 Jagat RF Solutions PIM Testing System Sales, Revenue, Price and Gross Margin (2021–2026)
7.13.4 Jagat RF Solutions PIM Testing System Product Offerings
7.13.5 Jagat RF Solutions Recent Developments
7.14 AceAxis Limited
7.14.1 AceAxis Limited Company Information
7.14.2 AceAxis Limited Introduction and Business Overview
7.14.3 AceAxis Limited PIM Testing System Sales, Revenue, Price and Gross Margin (2021–2026)
7.14.4 AceAxis Limited PIM Testing System Product Offerings
7.14.5 AceAxis Limited Recent Developments
7.15 Phase2 Microwave
7.15.1 Phase2 Microwave Company Information
7.15.2 Phase2 Microwave Introduction and Business Overview
7.15.3 Phase2 Microwave PIM Testing System Sales, Revenue, Price and Gross Margin (2021–2026)
7.15.4 Phase2 Microwave PIM Testing System Product Offerings
7.15.5 Phase2 Microwave Recent Developments
7.16 Comba Telecom
7.16.1 Comba Telecom Company Information
7.16.2 Comba Telecom Introduction and Business Overview
7.16.3 Comba Telecom PIM Testing System Sales, Revenue, Price and Gross Margin (2021–2026)
7.16.4 Comba Telecom PIM Testing System Product Offerings
7.16.5 Comba Telecom Recent Developments
7.17 Signal Solutions
7.17.1 Signal Solutions Company Information
7.17.2 Signal Solutions Introduction and Business Overview
7.17.3 Signal Solutions PIM Testing System Sales, Revenue, Price and Gross Margin (2021–2026)
7.17.4 Signal Solutions PIM Testing System Product Offerings
7.17.5 Signal Solutions Recent Developments
8 Industry Chain Analysis
8.1 PIM Testing System Industrial Chain
8.2 PIM Testing System Upstream Analysis
8.2.1 Key Raw Materials
8.2.2 Key Suppliers of Raw Materials
8.2.3 Manufacturing Cost Structure
8.3 Midstream Analysis
8.4 Downstream Analysis (Customer Analysis)
8.5 Sales Model and Sales Channelss
8.5.1 PIM Testing System Sales Model
8.5.2 Sales Channels
8.5.3 PIM Testing System Distributors
9 Research Findings and Conclusion
10 Appendix
10.1 Research Methodology
10.1.1 Methodology/Research Approach
10.1.1.1 Research Programs/Design
10.1.1.2 Market Size Estimation
10.1.1.3 Market Breakdown and Data Triangulation
10.1.2 Data Source
10.1.2.1 Secondary Sources
10.1.2.2 Primary Sources
10.2 Author Details
10.3 Disclaimer