List of Tables
Table 1. Global Perovskite Photovoltaic Cell Market Value by Type, (US$ Million) & (2024 VS 2031)
Table 2. Global Perovskite Photovoltaic Cell Market Value by Technology, (US$ Million) & (2024 VS 2031)
Table 3. Global Perovskite Photovoltaic Cell Market Value by Structure, (US$ Million) & (2024 VS 2031)
Table 4. Global Perovskite Photovoltaic Cell Market Value by Application, (US$ Million) & (2024 VS 2031)
Table 5. Global Perovskite Photovoltaic Cell Production Capacity (MW) by Manufacturers in 2024
Table 6. Global Perovskite Photovoltaic Cell Production by Manufacturers (2020-2025) & (MW)
Table 7. Global Perovskite Photovoltaic Cell Production Market Share by Manufacturers (2020-2025)
Table 8. Global Perovskite Photovoltaic Cell Production Value by Manufacturers (2020-2025) & (US$ Million)
Table 9. Global Perovskite Photovoltaic Cell Production Value Share by Manufacturers (2020-2025)
Table 10. Global Key Players of Perovskite Photovoltaic Cell, Industry Ranking, 2023 VS 2024
Table 11. Company Type (Tier 1, Tier 2, and Tier 3) & (based on the Production Value in Perovskite Photovoltaic Cell as of 2024)
Table 12. Global Market Perovskite Photovoltaic Cell Average Price by Manufacturers (US$/W) & (2020-2025)
Table 13. Global Key Manufacturers of Perovskite Photovoltaic Cell, Manufacturing Base Distribution and Headquarters
Table 14. Global Key Manufacturers of Perovskite Photovoltaic Cell, Product Offered and Application
Table 15. Global Key Manufacturers of Perovskite Photovoltaic Cell, Date of Enter into This Industry
Table 16. Global Perovskite Photovoltaic Cell Manufacturers Market Concentration Ratio (CR5 and HHI)
Table 17. Mergers & Acquisitions, Expansion Plans
Table 18. Global Perovskite Photovoltaic Cell Production Value by Region: 2020 VS 2024 VS 2031 (US$ Million)
Table 19. Global Perovskite Photovoltaic Cell Production Value (US$ Million) by Region (2020-2025)
Table 20. Global Perovskite Photovoltaic Cell Production Value Market Share by Region (2020-2025)
Table 21. Global Perovskite Photovoltaic Cell Production Value (US$ Million) Forecast by Region (2026-2031)
Table 22. Global Perovskite Photovoltaic Cell Production Value Market Share Forecast by Region (2026-2031)
Table 23. Global Perovskite Photovoltaic Cell Production Comparison by Region: 2020 VS 2024 VS 2031 (MW)
Table 24. Global Perovskite Photovoltaic Cell Production (MW) by Region (2020-2025)
Table 25. Global Perovskite Photovoltaic Cell Production Market Share by Region (2020-2025)
Table 26. Global Perovskite Photovoltaic Cell Production (MW) Forecast by Region (2026-2031)
Table 27. Global Perovskite Photovoltaic Cell Production Market Share Forecast by Region (2026-2031)
Table 28. Global Perovskite Photovoltaic Cell Market Average Price (US$/W) by Region (2020-2025)
Table 29. Global Perovskite Photovoltaic Cell Market Average Price (US$/W) by Region (2026-2031)
Table 30. Global Perovskite Photovoltaic Cell Consumption Growth Rate by Region: 2020 VS 2024 VS 2031 (MW)
Table 31. Global Perovskite Photovoltaic Cell Consumption by Region (2020-2025) & (MW)
Table 32. Global Perovskite Photovoltaic Cell Consumption Market Share by Region (2020-2025)
Table 33. Global Perovskite Photovoltaic Cell Forecasted Consumption by Region (2026-2031) & (MW)
Table 34. Global Perovskite Photovoltaic Cell Forecasted Consumption Market Share by Region (2026-2031)
Table 35. North America Perovskite Photovoltaic Cell Consumption Growth Rate by Country: 2020 VS 2024 VS 2031 (MW)
Table 36. North America Perovskite Photovoltaic Cell Consumption by Country (2020-2025) & (MW)
Table 37. North America Perovskite Photovoltaic Cell Consumption by Country (2026-2031) & (MW)
Table 38. Europe Perovskite Photovoltaic Cell Consumption Growth Rate by Country: 2020 VS 2024 VS 2031 (MW)
Table 39. Europe Perovskite Photovoltaic Cell Consumption by Country (2020-2025) & (MW)
Table 40. Europe Perovskite Photovoltaic Cell Consumption by Country (2026-2031) & (MW)
Table 41. Asia Pacific Perovskite Photovoltaic Cell Consumption Growth Rate by Region: 2020 VS 2024 VS 2031 (MW)
Table 42. Asia Pacific Perovskite Photovoltaic Cell Consumption by Region (2020-2025) & (MW)
Table 43. Asia Pacific Perovskite Photovoltaic Cell Consumption by Region (2026-2031) & (MW)
Table 44. Latin America, Middle East & Africa Perovskite Photovoltaic Cell Consumption Growth Rate by Country: 2020 VS 2024 VS 2031 (MW)
Table 45. Latin America, Middle East & Africa Perovskite Photovoltaic Cell Consumption by Country (2020-2025) & (MW)
Table 46. Latin America, Middle East & Africa Perovskite Photovoltaic Cell Consumption by Country (2026-2031) & (MW)
Table 47. Global Perovskite Photovoltaic Cell Production (MW) by Type (2020-2025)
Table 48. Global Perovskite Photovoltaic Cell Production (MW) by Type (2026-2031)
Table 49. Global Perovskite Photovoltaic Cell Production Market Share by Type (2020-2025)
Table 50. Global Perovskite Photovoltaic Cell Production Market Share by Type (2026-2031)
Table 51. Global Perovskite Photovoltaic Cell Production Value (US$ Million) by Type (2020-2025)
Table 52. Global Perovskite Photovoltaic Cell Production Value (US$ Million) by Type (2026-2031)
Table 53. Global Perovskite Photovoltaic Cell Production Value Market Share by Type (2020-2025)
Table 54. Global Perovskite Photovoltaic Cell Production Value Market Share by Type (2026-2031)
Table 55. Global Perovskite Photovoltaic Cell Price (US$/W) by Type (2020-2025)
Table 56. Global Perovskite Photovoltaic Cell Price (US$/W) by Type (2026-2031)
Table 57. Global Perovskite Photovoltaic Cell Production (MW) by Application (2020-2025)
Table 58. Global Perovskite Photovoltaic Cell Production (MW) by Application (2026-2031)
Table 59. Global Perovskite Photovoltaic Cell Production Market Share by Application (2020-2025)
Table 60. Global Perovskite Photovoltaic Cell Production Market Share by Application (2026-2031)
Table 61. Global Perovskite Photovoltaic Cell Production Value (US$ Million) by Application (2020-2025)
Table 62. Global Perovskite Photovoltaic Cell Production Value (US$ Million) by Application (2026-2031)
Table 63. Global Perovskite Photovoltaic Cell Production Value Market Share by Application (2020-2025)
Table 64. Global Perovskite Photovoltaic Cell Production Value Market Share by Application (2026-2031)
Table 65. Global Perovskite Photovoltaic Cell Price (US$/W) by Application (2020-2025)
Table 66. Global Perovskite Photovoltaic Cell Price (US$/W) by Application (2026-2031)
Table 67. Oxford PV Perovskite Photovoltaic Cell Company Information
Table 68. Oxford PV Perovskite Photovoltaic Cell Specification and Application
Table 69. Oxford PV Perovskite Photovoltaic Cell Production (MW), Value (US$ Million), Price (US$/W) and Gross Margin (2020-2025)
Table 70. Oxford PV Main Business and Markets Served
Table 71. Oxford PV Recent Developments/Updates
Table 72. Swift Solar Perovskite Photovoltaic Cell Company Information
Table 73. Swift Solar Perovskite Photovoltaic Cell Specification and Application
Table 74. Swift Solar Perovskite Photovoltaic Cell Production (MW), Value (US$ Million), Price (US$/W) and Gross Margin (2020-2025)
Table 75. Swift Solar Main Business and Markets Served
Table 76. Swift Solar Recent Developments/Updates
Table 77. Cubic PV (formerly Hunt Energy) Perovskite Photovoltaic Cell Company Information
Table 78. Cubic PV (formerly Hunt Energy) Perovskite Photovoltaic Cell Specification and Application
Table 79. Cubic PV (formerly Hunt Energy) Perovskite Photovoltaic Cell Production (MW), Value (US$ Million), Price (US$/W) and Gross Margin (2020-2025)
Table 80. Cubic PV (formerly Hunt Energy) Main Business and Markets Served
Table 81. Cubic PV (formerly Hunt Energy) Recent Developments/Updates
Table 82. Hanwha Qcells Perovskite Photovoltaic Cell Company Information
Table 83. Hanwha Qcells Perovskite Photovoltaic Cell Specification and Application
Table 84. Hanwha Qcells Perovskite Photovoltaic Cell Production (MW), Value (US$ Million), Price (US$/W) and Gross Margin (2020-2025)
Table 85. Hanwha Qcells Main Business and Markets Served
Table 86. Hanwha Qcells Recent Developments/Updates
Table 87. Saule Technologies Perovskite Photovoltaic Cell Company Information
Table 88. Saule Technologies Perovskite Photovoltaic Cell Specification and Application
Table 89. Saule Technologies Perovskite Photovoltaic Cell Production (MW), Value (US$ Million), Price (US$/W) and Gross Margin (2020-2025)
Table 90. Saule Technologies Main Business and Markets Served
Table 91. Saule Technologies Recent Developments/Updates
Table 92. Enecoat Technologies Co., Ltd. Perovskite Photovoltaic Cell Company Information
Table 93. Enecoat Technologies Co., Ltd. Perovskite Photovoltaic Cell Specification and Application
Table 94. Enecoat Technologies Co., Ltd. Perovskite Photovoltaic Cell Production (MW), Value (US$ Million), Price (US$/W) and Gross Margin (2020-2025)
Table 95. Enecoat Technologies Co., Ltd. Main Business and Markets Served
Table 96. Enecoat Technologies Co., Ltd. Recent Developments/Updates
Table 97. Active Surfaces Perovskite Photovoltaic Cell Company Information
Table 98. Active Surfaces Perovskite Photovoltaic Cell Specification and Application
Table 99. Active Surfaces Perovskite Photovoltaic Cell Production (MW), Value (US$ Million), Price (US$/W) and Gross Margin (2020-2025)
Table 100. Active Surfaces Main Business and Markets Served
Table 101. Active Surfaces Recent Developments/Updates
Table 102. First Solar (Evolar AB) Perovskite Photovoltaic Cell Company Information
Table 103. First Solar (Evolar AB) Perovskite Photovoltaic Cell Specification and Application
Table 104. First Solar (Evolar AB) Perovskite Photovoltaic Cell Production (MW), Value (US$ Million), Price (US$/W) and Gross Margin (2020-2025)
Table 105. First Solar (Evolar AB) Main Business and Markets Served
Table 106. First Solar (Evolar AB) Recent Developments/Updates
Table 107. Taiwan Perovskite Solar Corp. Perovskite Photovoltaic Cell Company Information
Table 108. Taiwan Perovskite Solar Corp. Perovskite Photovoltaic Cell Specification and Application
Table 109. Taiwan Perovskite Solar Corp. Perovskite Photovoltaic Cell Production (MW), Value (US$ Million), Price (US$/W) and Gross Margin (2020-2025)
Table 110. Taiwan Perovskite Solar Corp. Main Business and Markets Served
Table 111. Taiwan Perovskite Solar Corp. Recent Developments/Updates
Table 112. Caelux Perovskite Photovoltaic Cell Company Information
Table 113. Caelux Perovskite Photovoltaic Cell Specification and Application
Table 114. Caelux Perovskite Photovoltaic Cell Production (MW), Value (US$ Million), Price (US$/W) and Gross Margin (2020-2025)
Table 115. Caelux Main Business and Markets Served
Table 116. Caelux Recent Developments/Updates
Table 117. Kunshan GCL Perovskite Photovoltaic Cell Company Information
Table 118. Kunshan GCL Perovskite Photovoltaic Cell Specification and Application
Table 119. Kunshan GCL Perovskite Photovoltaic Cell Production (MW), Value (US$ Million), Price (US$/W) and Gross Margin (2020-2025)
Table 120. Kunshan GCL Main Business and Markets Served
Table 121. Kunshan GCL Recent Developments/Updates
Table 122. Wondersolar Perovskite Photovoltaic Cell Company Information
Table 123. Wondersolar Perovskite Photovoltaic Cell Specification and Application
Table 124. Wondersolar Perovskite Photovoltaic Cell Production (MW), Value (US$ Million), Price (US$/W) and Gross Margin (2020-2025)
Table 125. Wondersolar Main Business and Markets Served
Table 126. Wondersolar Recent Developments/Updates
Table 127. Hangzhou MicroQuanta Semiconductor Co., Ltd. Perovskite Photovoltaic Cell Company Information
Table 128. Hangzhou MicroQuanta Semiconductor Co., Ltd. Perovskite Photovoltaic Cell Specification and Application
Table 129. Hangzhou MicroQuanta Semiconductor Co., Ltd. Perovskite Photovoltaic Cell Production (MW), Value (US$ Million), Price (US$/W) and Gross Margin (2020-2025)
Table 130. Hangzhou MicroQuanta Semiconductor Co., Ltd. Main Business and Markets Served
Table 131. Hangzhou MicroQuanta Semiconductor Co., Ltd. Recent Developments/Updates
Table 132. HIKING PV Perovskite Photovoltaic Cell Company Information
Table 133. HIKING PV Perovskite Photovoltaic Cell Specification and Application
Table 134. HIKING PV Perovskite Photovoltaic Cell Production (MW), Value (US$ Million), Price (US$/W) and Gross Margin (2020-2025)
Table 135. HIKING PV Main Business and Markets Served
Table 136. HIKING PV Recent Developments/Updates
Table 137. Liyuan New Energy Technology (Wuxi) Co., Ltd. Perovskite Photovoltaic Cell Company Information
Table 138. Liyuan New Energy Technology (Wuxi) Co., Ltd. Perovskite Photovoltaic Cell Specification and Application
Table 139. Liyuan New Energy Technology (Wuxi) Co., Ltd. Perovskite Photovoltaic Cell Production (MW), Value (US$ Million), Price (US$/W) and Gross Margin (2020-2025)
Table 140. Liyuan New Energy Technology (Wuxi) Co., Ltd. Main Business and Markets Served
Table 141. Liyuan New Energy Technology (Wuxi) Co., Ltd. Recent Developments/Updates
Table 142. UtmoLight Technology Co., Ltd. Perovskite Photovoltaic Cell Company Information
Table 143. UtmoLight Technology Co., Ltd. Perovskite Photovoltaic Cell Specification and Application
Table 144. UtmoLight Technology Co., Ltd. Perovskite Photovoltaic Cell Production (MW), Value (US$ Million), Price (US$/W) and Gross Margin (2020-2025)
Table 145. UtmoLight Technology Co., Ltd. Main Business and Markets Served
Table 146. UtmoLight Technology Co., Ltd. Recent Developments/Updates
Table 147. Dazheng (Jiangsu) Micro Nano Technology Co., Ltd. Perovskite Photovoltaic Cell Company Information
Table 148. Dazheng (Jiangsu) Micro Nano Technology Co., Ltd. Perovskite Photovoltaic Cell Specification and Application
Table 149. Dazheng (Jiangsu) Micro Nano Technology Co., Ltd. Perovskite Photovoltaic Cell Production (MW), Value (US$ Million), Price (US$/W) and Gross Margin (2020-2025)
Table 150. Dazheng (Jiangsu) Micro Nano Technology Co., Ltd. Main Business and Markets Served
Table 151. Dazheng (Jiangsu) Micro Nano Technology Co., Ltd. Recent Developments/Updates
Table 152. LONGi Green Energy Technology Co.,Ltd. Perovskite Photovoltaic Cell Company Information
Table 153. LONGi Green Energy Technology Co.,Ltd. Perovskite Photovoltaic Cell Specification and Application
Table 154. LONGi Green Energy Technology Co.,Ltd. Perovskite Photovoltaic Cell Production (MW), Value (US$ Million), Price (US$/W) and Gross Margin (2020-2025)
Table 155. LONGi Green Energy Technology Co.,Ltd. Main Business and Markets Served
Table 156. LONGi Green Energy Technology Co.,Ltd. Recent Developments/Updates
Table 157. Jinkosolar Holding Co., Ltd. Perovskite Photovoltaic Cell Company Information
Table 158. Jinkosolar Holding Co., Ltd. Perovskite Photovoltaic Cell Specification and Application
Table 159. Jinkosolar Holding Co., Ltd. Perovskite Photovoltaic Cell Production (MW), Value (US$ Million), Price (US$/W) and Gross Margin (2020-2025)
Table 160. Jinkosolar Holding Co., Ltd. Main Business and Markets Served
Table 161. Jinkosolar Holding Co., Ltd. Recent Developments/Updates
Table 162. Renshine Solar Perovskite Photovoltaic Cell Company Information
Table 163. Renshine Solar Perovskite Photovoltaic Cell Specification and Application
Table 164. Renshine Solar Perovskite Photovoltaic Cell Production (MW), Value (US$ Million), Price (US$/W) and Gross Margin (2020-2025)
Table 165. Renshine Solar Main Business and Markets Served
Table 166. Renshine Solar Recent Developments/Updates
Table 167. Anhui Huasun Energy Co.,Ltd. Perovskite Photovoltaic Cell Company Information
Table 168. Anhui Huasun Energy Co.,Ltd. Perovskite Photovoltaic Cell Specification and Application
Table 169. Anhui Huasun Energy Co.,Ltd. Perovskite Photovoltaic Cell Production (MW), Value (US$ Million), Price (US$/W) and Gross Margin (2020-2025)
Table 170. Anhui Huasun Energy Co.,Ltd. Main Business and Markets Served
Table 171. Anhui Huasun Energy Co.,Ltd. Recent Developments/Updates
Table 172. Tongwei Co., Ltd. Perovskite Photovoltaic Cell Company Information
Table 173. Tongwei Co., Ltd. Perovskite Photovoltaic Cell Specification and Application
Table 174. Tongwei Co., Ltd. Perovskite Photovoltaic Cell Production (MW), Value (US$ Million), Price (US$/W) and Gross Margin (2020-2025)
Table 175. Tongwei Co., Ltd. Main Business and Markets Served
Table 176. Tongwei Co., Ltd. Recent Developments/Updates
Table 177. Beijing Yaoneng Photoelectric Technology Co., Ltd. Perovskite Photovoltaic Cell Company Information
Table 178. Beijing Yaoneng Photoelectric Technology Co., Ltd. Perovskite Photovoltaic Cell Specification and Application
Table 179. Beijing Yaoneng Photoelectric Technology Co., Ltd. Perovskite Photovoltaic Cell Production (MW), Value (US$ Million), Price (US$/W) and Gross Margin (2020-2025)
Table 180. Beijing Yaoneng Photoelectric Technology Co., Ltd. Main Business and Markets Served
Table 181. Beijing Yaoneng Photoelectric Technology Co., Ltd. Recent Developments/Updates
Table 182. CATL Perovskite Photovoltaic Cell Company Information
Table 183. CATL Perovskite Photovoltaic Cell Specification and Application
Table 184. CATL Perovskite Photovoltaic Cell Production (MW), Value (US$ Million), Price (US$/W) and Gross Margin (2020-2025)
Table 185. CATL Main Business and Markets Served
Table 186. CATL Recent Developments/Updates
Table 187. HANGXIAO STEEL STRUCTURE CO., LTD. Perovskite Photovoltaic Cell Company Information
Table 188. HANGXIAO STEEL STRUCTURE CO., LTD. Perovskite Photovoltaic Cell Specification and Application
Table 189. HANGXIAO STEEL STRUCTURE CO., LTD. Perovskite Photovoltaic Cell Production (MW), Value (US$ Million), Price (US$/W) and Gross Margin (2020-2025)
Table 190. HANGXIAO STEEL STRUCTURE CO., LTD. Main Business and Markets Served
Table 191. HANGXIAO STEEL STRUCTURE CO., LTD. Recent Developments/Updates
Table 192. Wuhan Jiuyao Photoelectric Technology Co., Ltd. Perovskite Photovoltaic Cell Company Information
Table 193. Wuhan Jiuyao Photoelectric Technology Co., Ltd. Perovskite Photovoltaic Cell Specification and Application
Table 194. Wuhan Jiuyao Photoelectric Technology Co., Ltd. Perovskite Photovoltaic Cell Production (MW), Value (US$ Million), Price (US$/W) and Gross Margin (2020-2025)
Table 195. Wuhan Jiuyao Photoelectric Technology Co., Ltd. Main Business and Markets Served
Table 196. Wuhan Jiuyao Photoelectric Technology Co., Ltd. Recent Developments/Updates
Table 197. China Huaneng Perovskite Photovoltaic Cell Company Information
Table 198. China Huaneng Perovskite Photovoltaic Cell Specification and Application
Table 199. China Huaneng Perovskite Photovoltaic Cell Production (MW), Value (US$ Million), Price (US$/W) and Gross Margin (2020-2025)
Table 200. China Huaneng Main Business and Markets Served
Table 201. China Huaneng Recent Developments/Updates
Table 202. YanheSolar Perovskite Photovoltaic Cell Company Information
Table 203. YanheSolar Perovskite Photovoltaic Cell Specification and Application
Table 204. YanheSolar Perovskite Photovoltaic Cell Production (MW), Value (US$ Million), Price (US$/W) and Gross Margin (2020-2025)
Table 205. YanheSolar Main Business and Markets Served
Table 206. YanheSolar Recent Developments/Updates
Table 207. BYD Perovskite Photovoltaic Cell Company Information
Table 208. BYD Perovskite Photovoltaic Cell Specification and Application
Table 209. BYD Perovskite Photovoltaic Cell Production (MW), Value (US$ Million), Price (US$/W) and Gross Margin (2020-2025)
Table 210. BYD Main Business and Markets Served
Table 211. BYD Recent Developments/Updates
Table 212. CNNC Optoelectronics Technology (Shanghai) Co., Ltd. Perovskite Photovoltaic Cell Company Information
Table 213. CNNC Optoelectronics Technology (Shanghai) Co., Ltd. Perovskite Photovoltaic Cell Specification and Application
Table 214. CNNC Optoelectronics Technology (Shanghai) Co., Ltd. Perovskite Photovoltaic Cell Production (MW), Value (US$ Million), Price (US$/W) and Gross Margin (2020-2025)
Table 215. CNNC Optoelectronics Technology (Shanghai) Co., Ltd. Main Business and Markets Served
Table 216. CNNC Optoelectronics Technology (Shanghai) Co., Ltd. Recent Developments/Updates
Table 217. BOE Perovskite Photovoltaic Cell Company Information
Table 218. BOE Perovskite Photovoltaic Cell Specification and Application
Table 219. BOE Perovskite Photovoltaic Cell Production (MW), Value (US$ Million), Price (US$/W) and Gross Margin (2020-2025)
Table 220. BOE Main Business and Markets Served
Table 221. BOE Recent Developments/Updates
Table 222. Hangzhou Colin Electric Co., Ltd. Perovskite Photovoltaic Cell Company Information
Table 223. Hangzhou Colin Electric Co., Ltd. Perovskite Photovoltaic Cell Specification and Application
Table 224. Hangzhou Colin Electric Co., Ltd. Perovskite Photovoltaic Cell Production (MW), Value (US$ Million), Price (US$/W) and Gross Margin (2020-2025)
Table 225. Hangzhou Colin Electric Co., Ltd. Main Business and Markets Served
Table 226. Hangzhou Colin Electric Co., Ltd. Recent Developments/Updates
Table 227. Ming Yang Smart Energy Group Limited Perovskite Photovoltaic Cell Company Information
Table 228. Ming Yang Smart Energy Group Limited Perovskite Photovoltaic Cell Specification and Application
Table 229. Ming Yang Smart Energy Group Limited Perovskite Photovoltaic Cell Production (MW), Value (US$ Million), Price (US$/W) and Gross Margin (2020-2025)
Table 230. Ming Yang Smart Energy Group Limited Main Business and Markets Served
Table 231. Ming Yang Smart Energy Group Limited Recent Developments/Updates
Table 232. Chint Group Corporation Perovskite Photovoltaic Cell Company Information
Table 233. Chint Group Corporation Perovskite Photovoltaic Cell Specification and Application
Table 234. Chint Group Corporation Perovskite Photovoltaic Cell Production (MW), Value (US$ Million), Price (US$/W) and Gross Margin (2020-2025)
Table 235. Chint Group Corporation Main Business and Markets Served
Table 236. Chint Group Corporation Recent Developments/Updates
Table 237. Key Raw Materials Lists
Table 238. Raw Materials Key Suppliers Lists
Table 239. Perovskite Photovoltaic Cell Distributors List
Table 240. Perovskite Photovoltaic Cell Customers List
Table 241. Perovskite Photovoltaic Cell Market Trends
Table 242. Perovskite Photovoltaic Cell Market Drivers
Table 243. Perovskite Photovoltaic Cell Market Challenges
Table 244. Perovskite Photovoltaic Cell Market Restraints
Table 245. Research Programs/Design for This Report
Table 246. Key Data Information from Secondary Sources
Table 247. Key Data Information from Primary Sources
Table 248. Authors List of This Report
List of Figures
Figure 1. Product Picture of Perovskite Photovoltaic Cell
Figure 2. Global Perovskite Photovoltaic Cell Market Value by Type, (US$ Million) & (2020-2031)
Figure 3. Global Perovskite Photovoltaic Cell Market Share by Type: 2024 VS 2031
Figure 4. Perovskite Single-junction Modules Product Picture
Figure 5. Perovskite Tandem Modules (Perovskite/Crystalline Silicon; All-perovskite Tandem) Product Picture
Figure 6. Others Product Picture
Figure 7. Global Perovskite Photovoltaic Cell Market Value by Technology, (US$ Million) & (2020-2031)
Figure 8. Global Perovskite Photovoltaic Cell Market Share by Technology: 2024 VS 2031
Figure 9. 2-terminal Tandem Cell Product Picture
Figure 10. 4-terminal Tandem Cell Product Picture
Figure 11. Others Product Picture
Figure 12. Global Perovskite Photovoltaic Cell Market Value by Structure, (US$ Million) & (2020-2031)
Figure 13. Global Perovskite Photovoltaic Cell Market Share by Structure: 2024 VS 2031
Figure 14. Rigid Module Product Picture
Figure 15. Flexible Module Product Picture
Figure 16. Global Perovskite Photovoltaic Cell Market Value by Application, (US$ Million) & (2020-2031)
Figure 17. Global Perovskite Photovoltaic Cell Market Share by Application: 2024 VS 2031
Figure 18. BIPV
Figure 19. Power Station
Figure 20. Transportation & Mobility
Figure 21. Consumer Electronics
Figure 22. Others
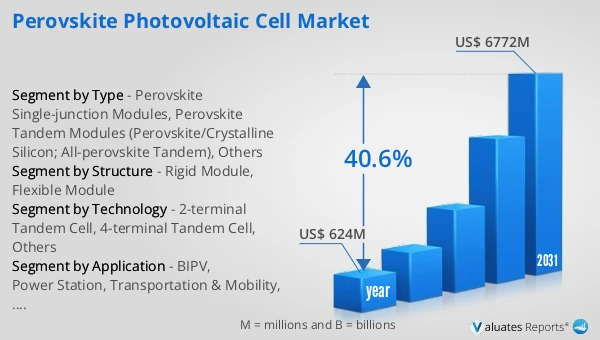
Figure 23. Global Perovskite Photovoltaic Cell Production Value (US$ Million), 2020 VS 2024 VS 2031
Figure 24. Global Perovskite Photovoltaic Cell Production Value (US$ Million) & (2020-2031)
Figure 25. Global Perovskite Photovoltaic Cell Production Capacity (MW) & (2020-2031)
Figure 26. Global Perovskite Photovoltaic Cell Production (MW) & (2020-2031)
Figure 27. Global Perovskite Photovoltaic Cell Average Price (US$/W) & (2020-2031)
Figure 28. Perovskite Photovoltaic Cell Report Years Considered
Figure 29. Perovskite Photovoltaic Cell Production Share by Manufacturers in 2024
Figure 30. Global Perovskite Photovoltaic Cell Production Value Share by Manufacturers (2024)
Figure 31. Perovskite Photovoltaic Cell Market Share by Company Type (Tier 1, Tier 2, and Tier 3): 2020 VS 2024
Figure 32. The Global 5 and 10 Largest Players: Market Share by Perovskite Photovoltaic Cell Revenue in 2024
Figure 33. Global Perovskite Photovoltaic Cell Production Value by Region: 2020 VS 2024 VS 2031 (US$ Million)
Figure 34. Global Perovskite Photovoltaic Cell Production Value Market Share by Region: 2020 VS 2024 VS 2031
Figure 35. Global Perovskite Photovoltaic Cell Production Comparison by Region: 2020 VS 2024 VS 2031 (MW)
Figure 36. Global Perovskite Photovoltaic Cell Production Market Share by Region: 2020 VS 2024 VS 2031
Figure 37. North America Perovskite Photovoltaic Cell Production Value (US$ Million) Growth Rate (2020-2031)
Figure 38. Europe Perovskite Photovoltaic Cell Production Value (US$ Million) Growth Rate (2020-2031)
Figure 39. China Perovskite Photovoltaic Cell Production Value (US$ Million) Growth Rate (2020-2031)
Figure 40. Japan Perovskite Photovoltaic Cell Production Value (US$ Million) Growth Rate (2020-2031)
Figure 41. Global Perovskite Photovoltaic Cell Consumption by Region: 2020 VS 2024 VS 2031 (MW)
Figure 42. Global Perovskite Photovoltaic Cell Consumption Market Share by Region: 2020 VS 2024 VS 2031
Figure 43. North America Perovskite Photovoltaic Cell Consumption and Growth Rate (2020-2031) & (MW)
Figure 44. North America Perovskite Photovoltaic Cell Consumption Market Share by Country (2020-2031)
Figure 45. U.S. Perovskite Photovoltaic Cell Consumption and Growth Rate (2020-2031) & (MW)
Figure 46. Canada Perovskite Photovoltaic Cell Consumption and Growth Rate (2020-2031) & (MW)
Figure 47. Europe Perovskite Photovoltaic Cell Consumption and Growth Rate (2020-2031) & (MW)
Figure 48. Europe Perovskite Photovoltaic Cell Consumption Market Share by Country (2020-2031)
Figure 49. Germany Perovskite Photovoltaic Cell Consumption and Growth Rate (2020-2031) & (MW)
Figure 50. France Perovskite Photovoltaic Cell Consumption and Growth Rate (2020-2031) & (MW)
Figure 51. U.K. Perovskite Photovoltaic Cell Consumption and Growth Rate (2020-2031) & (MW)
Figure 52. Italy Perovskite Photovoltaic Cell Consumption and Growth Rate (2020-2031) & (MW)
Figure 53. Netherlands Perovskite Photovoltaic Cell Consumption and Growth Rate (2020-2031) & (MW)
Figure 54. Asia Pacific Perovskite Photovoltaic Cell Consumption and Growth Rate (2020-2031) & (MW)
Figure 55. Asia Pacific Perovskite Photovoltaic Cell Consumption Market Share by Region (2020-2031)
Figure 56. China Perovskite Photovoltaic Cell Consumption and Growth Rate (2020-2031) & (MW)
Figure 57. Japan Perovskite Photovoltaic Cell Consumption and Growth Rate (2020-2031) & (MW)
Figure 58. South Korea Perovskite Photovoltaic Cell Consumption and Growth Rate (2020-2031) & (MW)
Figure 59. China Taiwan Perovskite Photovoltaic Cell Consumption and Growth Rate (2020-2031) & (MW)
Figure 60. Southeast Asia Perovskite Photovoltaic Cell Consumption and Growth Rate (2020-2031) & (MW)
Figure 61. India Perovskite Photovoltaic Cell Consumption and Growth Rate (2020-2031) & (MW)
Figure 62. Latin America, Middle East & Africa Perovskite Photovoltaic Cell Consumption and Growth Rate (2020-2031) & (MW)
Figure 63. Latin America, Middle East & Africa Perovskite Photovoltaic Cell Consumption Market Share by Country (2020-2031)
Figure 64. Mexico Perovskite Photovoltaic Cell Consumption and Growth Rate (2020-2031) & (MW)
Figure 65. Brazil Perovskite Photovoltaic Cell Consumption and Growth Rate (2020-2031) & (MW)
Figure 66. Turkey Perovskite Photovoltaic Cell Consumption and Growth Rate (2020-2031) & (MW)
Figure 67. GCC Countries Perovskite Photovoltaic Cell Consumption and Growth Rate (2020-2031) & (MW)
Figure 68. Global Production Market Share of Perovskite Photovoltaic Cell by Type (2020-2031)
Figure 69. Global Production Value Market Share of Perovskite Photovoltaic Cell by Type (2020-2031)
Figure 70. Global Perovskite Photovoltaic Cell Price (US$/W) by Type (2020-2031)
Figure 71. Global Production Market Share of Perovskite Photovoltaic Cell by Application (2020-2031)
Figure 72. Global Production Value Market Share of Perovskite Photovoltaic Cell by Application (2020-2031)
Figure 73. Global Perovskite Photovoltaic Cell Price (US$/W) by Application (2020-2031)
Figure 74. Perovskite Photovoltaic Cell Value Chain
Figure 75. Channels of Distribution (Direct Vs Distribution)
Figure 76. Bottom-up and Top-down Approaches for This Report
Figure 77. Data Triangulation