List of Tables
Table 1. Global WEEE (Waste Electrical and Electronic Equipment) Recycling Market Size Growth Rate by Type (US$ Million): 2021 vs 2025 vs 2032
Table 2. Key Players of Heat Exchangers (Refrigerator, Freezer, Air Conditioner, Dehumidifier, Heat Pump, etc.)
Table 3. Key Players of Display Devices for Use In Private Households (Monitors, TVs, LCD Screens, Notebook Computers, etc.)
Table 4. Key Players of Lamps/Glow-Discharge Lamps (Fluorescent Lamps, Compact Fluorescent Lamps, Discharge Lamps, LED Lamps, etc.)
Table 5. Key Players of Large Electronic Devices (Household Appliances, Electric Heaters, Stoves, Ventilators)
Table 6. Key Players of Small Electrical and Electronic Devices (Small Household Appliances, Consumer Electronics, Flashlights, Small Fans, etc.)
Table 7. Key Players of Small IT and Telecommunication Devices (Mobile Phones, GPS Navigation Devices, Calculators, etc.)
Table 8. Global WEEE (Waste Electrical and Electronic Equipment) Recycling Market Size Growth by Application (US$ Million): 2021 vs 2025 vs 2032
Table 9. Global WEEE (Waste Electrical and Electronic Equipment) Recycling Market Size by Region (US$ Million): 2021 vs 2025 vs 2032
Table 10. Global WEEE (Waste Electrical and Electronic Equipment) Recycling Market Size by Region (US$ Million), 2021–2026
Table 11. Global WEEE (Waste Electrical and Electronic Equipment) Recycling Market Share by Region (2021–2026)
Table 12. Global WEEE (Waste Electrical and Electronic Equipment) Recycling Forecasted Market Size by Region (US$ Million), 2027–2032
Table 13. Global WEEE (Waste Electrical and Electronic Equipment) Recycling Market Share by Region (2027–2032)
Table 14. WEEE (Waste Electrical and Electronic Equipment) Recycling Market Trends
Table 15. WEEE (Waste Electrical and Electronic Equipment) Recycling Market Drivers
Table 16. WEEE (Waste Electrical and Electronic Equipment) Recycling Market Challenges
Table 17. WEEE (Waste Electrical and Electronic Equipment) Recycling Market Restraints
Table 18. Global WEEE (Waste Electrical and Electronic Equipment) Recycling Revenue by Players (US$ Million), 2021–2026
Table 19. Global WEEE (Waste Electrical and Electronic Equipment) Recycling Market Share by Players (2021–2026)
Table 20. Global Top WEEE (Waste Electrical and Electronic Equipment) Recycling Players by Tier (Tier 1, Tier 2, and Tier 3), based on WEEE (Waste Electrical and Electronic Equipment) Recycling Revenue, 2025
Table 21. Ranking of Global Top WEEE (Waste Electrical and Electronic Equipment) Recycling Companies by Revenue (US$ Million) in 2025
Table 22. Global 5 Largest Players Market Share by WEEE (Waste Electrical and Electronic Equipment) Recycling Revenue (CR5 and HHI), 2021–2026
Table 23. Global Key Players of WEEE (Waste Electrical and Electronic Equipment) Recycling, Headquarters and Area Served
Table 24. Global Key Players of WEEE (Waste Electrical and Electronic Equipment) Recycling, Products and Applications
Table 25. Global Key Players of WEEE (Waste Electrical and Electronic Equipment) Recycling, Date of General Availability (GA)
Table 26. Mergers and Acquisitions, Expansion Plans
Table 27. Global WEEE (Waste Electrical and Electronic Equipment) Recycling Market Size by Type (US$ Million), 2021–2026
Table 28. Global WEEE (Waste Electrical and Electronic Equipment) Recycling Revenue Market Share by Type (2021–2026)
Table 29. Global WEEE (Waste Electrical and Electronic Equipment) Recycling Forecasted Market Size by Type (US$ Million), 2027–2032
Table 30. Global WEEE (Waste Electrical and Electronic Equipment) Recycling Revenue Market Share by Type (2027–2032)
Table 31. Global WEEE (Waste Electrical and Electronic Equipment) Recycling Market Size by Application (US$ Million), 2021–2026
Table 32. Global WEEE (Waste Electrical and Electronic Equipment) Recycling Revenue Market Share by Application (2021–2026)
Table 33. Global WEEE (Waste Electrical and Electronic Equipment) Recycling Forecasted Market Size by Application (US$ Million), 2027–2032
Table 34. Global WEEE (Waste Electrical and Electronic Equipment) Recycling Revenue Market Share by Application (2027–2032)
Table 35. North America WEEE (Waste Electrical and Electronic Equipment) Recycling Market Size Growth Rate by Country (US$ Million): 2021 vs 2025 vs 2032
Table 36. North America WEEE (Waste Electrical and Electronic Equipment) Recycling Market Size by Country (US$ Million), 2021–2026
Table 37. North America WEEE (Waste Electrical and Electronic Equipment) Recycling Market Size by Country (US$ Million), 2027–2032
Table 38. Europe WEEE (Waste Electrical and Electronic Equipment) Recycling Market Size Growth Rate by Country (US$ Million): 2021 vs 2025 vs 2032
Table 39. Europe WEEE (Waste Electrical and Electronic Equipment) Recycling Market Size by Country (US$ Million), 2021–2026
Table 40. Europe WEEE (Waste Electrical and Electronic Equipment) Recycling Market Size by Country (US$ Million), 2027–2032
Table 41. Asia-Pacific WEEE (Waste Electrical and Electronic Equipment) Recycling Market Size Growth Rate by Region (US$ Million): 2021 vs 2025 vs 2032
Table 42. Asia-Pacific WEEE (Waste Electrical and Electronic Equipment) Recycling Market Size by Region (US$ Million), 2021–2026
Table 43. Asia-Pacific WEEE (Waste Electrical and Electronic Equipment) Recycling Market Size by Region (US$ Million), 2027–2032
Table 44. Latin America WEEE (Waste Electrical and Electronic Equipment) Recycling Market Size Growth Rate by Country (US$ Million): 2021 vs 2025 vs 2032
Table 45. Latin America WEEE (Waste Electrical and Electronic Equipment) Recycling Market Size by Country (US$ Million), 2021–2026
Table 46. Latin America WEEE (Waste Electrical and Electronic Equipment) Recycling Market Size by Country (US$ Million), 2027–2032
Table 47. Middle East & Africa WEEE (Waste Electrical and Electronic Equipment) Recycling Market Size Growth Rate by Country (US$ Million): 2021 vs 2025 vs 2032
Table 48. Middle East & Africa WEEE (Waste Electrical and Electronic Equipment) Recycling Market Size by Country (US$ Million), 2021–2026
Table 49. Middle East & Africa WEEE (Waste Electrical and Electronic Equipment) Recycling Market Size by Country (US$ Million), 2027–2032
Table 50. China Resources and Environment Company Details
Table 51. China Resources and Environment Business Overview
Table 52. China Resources and Environment WEEE (Waste Electrical and Electronic Equipment) Recycling Product
Table 53. China Resources and Environment Revenue in WEEE (Waste Electrical and Electronic Equipment) Recycling Business (US$ Million), 2021–2026
Table 54. China Resources and Environment Recent Development
Table 55. Boliden AB Company Details
Table 56. Boliden AB Business Overview
Table 57. Boliden AB WEEE (Waste Electrical and Electronic Equipment) Recycling Product
Table 58. Boliden AB Revenue in WEEE (Waste Electrical and Electronic Equipment) Recycling Business (US$ Million), 2021–2026
Table 59. Boliden AB Recent Development
Table 60. Veolia Company Details
Table 61. Veolia Business Overview
Table 62. Veolia WEEE (Waste Electrical and Electronic Equipment) Recycling Product
Table 63. Veolia Revenue in WEEE (Waste Electrical and Electronic Equipment) Recycling Business (US$ Million), 2021–2026
Table 64. Veolia Recent Development
Table 65. GEM Company Details
Table 66. GEM Business Overview
Table 67. GEM WEEE (Waste Electrical and Electronic Equipment) Recycling Product
Table 68. GEM Revenue in WEEE (Waste Electrical and Electronic Equipment) Recycling Business (US$ Million), 2021–2026
Table 69. GEM Recent Development
Table 70. Umicore Company Details
Table 71. Umicore Business Overview
Table 72. Umicore WEEE (Waste Electrical and Electronic Equipment) Recycling Product
Table 73. Umicore Revenue in WEEE (Waste Electrical and Electronic Equipment) Recycling Business (US$ Million), 2021–2026
Table 74. Umicore Recent Development
Table 75. Stena Metall Company Details
Table 76. Stena Metall Business Overview
Table 77. Stena Metall WEEE (Waste Electrical and Electronic Equipment) Recycling Product
Table 78. Stena Metall Revenue in WEEE (Waste Electrical and Electronic Equipment) Recycling Business (US$ Million), 2021–2026
Table 79. Stena Metall Recent Development
Table 80. Gree Electric Company Details
Table 81. Gree Electric Business Overview
Table 82. Gree Electric WEEE (Waste Electrical and Electronic Equipment) Recycling Product
Table 83. Gree Electric Revenue in WEEE (Waste Electrical and Electronic Equipment) Recycling Business (US$ Million), 2021–2026
Table 84. Gree Electric Recent Development
Table 85. Sound Environmental Resour Company Details
Table 86. Sound Environmental Resour Business Overview
Table 87. Sound Environmental Resour WEEE (Waste Electrical and Electronic Equipment) Recycling Product
Table 88. Sound Environmental Resour Revenue in WEEE (Waste Electrical and Electronic Equipment) Recycling Business (US$ Million), 2021–2026
Table 89. Sound Environmental Resour Recent Development
Table 90. Galloo N.V. Company Details
Table 91. Galloo N.V. Business Overview
Table 92. Galloo N.V. WEEE (Waste Electrical and Electronic Equipment) Recycling Product
Table 93. Galloo N.V. Revenue in WEEE (Waste Electrical and Electronic Equipment) Recycling Business (US$ Million), 2021–2026
Table 94. Galloo N.V. Recent Development
Table 95. SIMS Metals Company Details
Table 96. SIMS Metals Business Overview
Table 97. SIMS Metals WEEE (Waste Electrical and Electronic Equipment) Recycling Product
Table 98. SIMS Metals Revenue in WEEE (Waste Electrical and Electronic Equipment) Recycling Business (US$ Million), 2021–2026
Table 99. SIMS Metals Recent Development
Table 100. TCL Company Details
Table 101. TCL Business Overview
Table 102. TCL WEEE (Waste Electrical and Electronic Equipment) Recycling Product
Table 103. TCL Revenue in WEEE (Waste Electrical and Electronic Equipment) Recycling Business (US$ Million), 2021–2026
Table 104. TCL Recent Development
Table 105. Electronic Recyclers International (ERI) Company Details
Table 106. Electronic Recyclers International (ERI) Business Overview
Table 107. Electronic Recyclers International (ERI) WEEE (Waste Electrical and Electronic Equipment) Recycling Product
Table 108. Electronic Recyclers International (ERI) Revenue in WEEE (Waste Electrical and Electronic Equipment) Recycling Business (US$ Million), 2021–2026
Table 109. Electronic Recyclers International (ERI) Recent Development
Table 110. Capital Environment Holdings Company Details
Table 111. Capital Environment Holdings Business Overview
Table 112. Capital Environment Holdings WEEE (Waste Electrical and Electronic Equipment) Recycling Product
Table 113. Capital Environment Holdings Revenue in WEEE (Waste Electrical and Electronic Equipment) Recycling Business (US$ Million), 2021–2026
Table 114. Capital Environment Holdings Recent Development
Table 115. Alba AG Company Details
Table 116. Alba AG Business Overview
Table 117. Alba AG WEEE (Waste Electrical and Electronic Equipment) Recycling Product
Table 118. Alba AG Revenue in WEEE (Waste Electrical and Electronic Equipment) Recycling Business (US$ Million), 2021–2026
Table 119. Alba AG Recent Development
Table 120. Aurubis Company Details
Table 121. Aurubis Business Overview
Table 122. Aurubis WEEE (Waste Electrical and Electronic Equipment) Recycling Product
Table 123. Aurubis Revenue in WEEE (Waste Electrical and Electronic Equipment) Recycling Business (US$ Million), 2021–2026
Table 124. Aurubis Recent Development
Table 125. Coolrec B.V. Company Details
Table 126. Coolrec B.V. Business Overview
Table 127. Coolrec B.V. WEEE (Waste Electrical and Electronic Equipment) Recycling Product
Table 128. Coolrec B.V. Revenue in WEEE (Waste Electrical and Electronic Equipment) Recycling Business (US$ Million), 2021–2026
Table 129. Coolrec B.V. Recent Development
Table 130. Environnement Recycling Company Details
Table 131. Environnement Recycling Business Overview
Table 132. Environnement Recycling WEEE (Waste Electrical and Electronic Equipment) Recycling Product
Table 133. Environnement Recycling Revenue in WEEE (Waste Electrical and Electronic Equipment) Recycling Business (US$ Million), 2021–2026
Table 134. Environnement Recycling Recent Development
Table 135. Ecoreset Company Details
Table 136. Ecoreset Business Overview
Table 137. Ecoreset WEEE (Waste Electrical and Electronic Equipment) Recycling Product
Table 138. Ecoreset Revenue in WEEE (Waste Electrical and Electronic Equipment) Recycling Business (US$ Million), 2021–2026
Table 139. Ecoreset Recent Development
Table 140. Hwaxin Environmental Company Details
Table 141. Hwaxin Environmental Business Overview
Table 142. Hwaxin Environmental WEEE (Waste Electrical and Electronic Equipment) Recycling Product
Table 143. Hwaxin Environmental Revenue in WEEE (Waste Electrical and Electronic Equipment) Recycling Business (US$ Million), 2021–2026
Table 144. Hwaxin Environmental Recent Development
Table 145. E-Reciklaza Company Details
Table 146. E-Reciklaza Business Overview
Table 147. E-Reciklaza WEEE (Waste Electrical and Electronic Equipment) Recycling Product
Table 148. E-Reciklaza Revenue in WEEE (Waste Electrical and Electronic Equipment) Recycling Business (US$ Million), 2021–2026
Table 149. E-Reciklaza Recent Development
Table 150. Sichuan Changhong Gerun Environmental Protection Technology Company Details
Table 151. Sichuan Changhong Gerun Environmental Protection Technology Business Overview
Table 152. Sichuan Changhong Gerun Environmental Protection Technology WEEE (Waste Electrical and Electronic Equipment) Recycling Product
Table 153. Sichuan Changhong Gerun Environmental Protection Technology Revenue in WEEE (Waste Electrical and Electronic Equipment) Recycling Business (US$ Million), 2021–2026
Table 154. Sichuan Changhong Gerun Environmental Protection Technology Recent Development
Table 155. Quantum Lifecycle Partners Company Details
Table 156. Quantum Lifecycle Partners Business Overview
Table 157. Quantum Lifecycle Partners WEEE (Waste Electrical and Electronic Equipment) Recycling Product
Table 158. Quantum Lifecycle Partners Revenue in WEEE (Waste Electrical and Electronic Equipment) Recycling Business (US$ Million), 2021–2026
Table 159. Quantum Lifecycle Partners Recent Development
Table 160. Tetronics Company Details
Table 161. Tetronics Business Overview
Table 162. Tetronics WEEE (Waste Electrical and Electronic Equipment) Recycling Product
Table 163. Tetronics Revenue in WEEE (Waste Electrical and Electronic Equipment) Recycling Business (US$ Million), 2021–2026
Table 164. Tetronics Recent Development
Table 165. Enviro-Hub Holdings Company Details
Table 166. Enviro-Hub Holdings Business Overview
Table 167. Enviro-Hub Holdings WEEE (Waste Electrical and Electronic Equipment) Recycling Product
Table 168. Enviro-Hub Holdings Revenue in WEEE (Waste Electrical and Electronic Equipment) Recycling Business (US$ Million), 2021–2026
Table 169. Enviro-Hub Holdings Recent Development
Table 170. WEEE Centre Company Details
Table 171. WEEE Centre Business Overview
Table 172. WEEE Centre WEEE (Waste Electrical and Electronic Equipment) Recycling Product
Table 173. WEEE Centre Revenue in WEEE (Waste Electrical and Electronic Equipment) Recycling Business (US$ Million), 2021–2026
Table 174. WEEE Centre Recent Development
Table 175. WEEE Ireland Company Details
Table 176. WEEE Ireland Business Overview
Table 177. WEEE Ireland WEEE (Waste Electrical and Electronic Equipment) Recycling Product
Table 178. WEEE Ireland Revenue in WEEE (Waste Electrical and Electronic Equipment) Recycling Business (US$ Million), 2021–2026
Table 179. WEEE Ireland Recent Development
Table 180. Beijing Enterprises Urban Resources Group Company Details
Table 181. Beijing Enterprises Urban Resources Group Business Overview
Table 182. Beijing Enterprises Urban Resources Group WEEE (Waste Electrical and Electronic Equipment) Recycling Product
Table 183. Beijing Enterprises Urban Resources Group Revenue in WEEE (Waste Electrical and Electronic Equipment) Recycling Business (US$ Million), 2021–2026
Table 184. Beijing Enterprises Urban Resources Group Recent Development
Table 185. China Daye Non-Ferrous Company Details
Table 186. China Daye Non-Ferrous Business Overview
Table 187. China Daye Non-Ferrous WEEE (Waste Electrical and Electronic Equipment) Recycling Product
Table 188. China Daye Non-Ferrous Revenue in WEEE (Waste Electrical and Electronic Equipment) Recycling Business (US$ Million), 2021–2026
Table 189. China Daye Non-Ferrous Recent Development
Table 190. Guangdong Huaqing Waste Treatment Company Details
Table 191. Guangdong Huaqing Waste Treatment Business Overview
Table 192. Guangdong Huaqing Waste Treatment WEEE (Waste Electrical and Electronic Equipment) Recycling Product
Table 193. Guangdong Huaqing Waste Treatment Revenue in WEEE (Waste Electrical and Electronic Equipment) Recycling Business (US$ Million), 2021–2026
Table 194. Guangdong Huaqing Waste Treatment Recent Development
Table 195. Jiangsu Subei Waste Automobile Household Appliances Disassembly Recycling Company Details
Table 196. Jiangsu Subei Waste Automobile Household Appliances Disassembly Recycling Business Overview
Table 197. Jiangsu Subei Waste Automobile Household Appliances Disassembly Recycling WEEE (Waste Electrical and Electronic Equipment) Recycling Product
Table 198. Jiangsu Subei Waste Automobile Household Appliances Disassembly Recycling Revenue in WEEE (Waste Electrical and Electronic Equipment) Recycling Business (US$ Million), 2021–2026
Table 199. Jiangsu Subei Waste Automobile Household Appliances Disassembly Recycling Recent Development
Table 200. EnviroCraft Company Details
Table 201. EnviroCraft Business Overview
Table 202. EnviroCraft WEEE (Waste Electrical and Electronic Equipment) Recycling Product
Table 203. EnviroCraft Revenue in WEEE (Waste Electrical and Electronic Equipment) Recycling Business (US$ Million), 2021–2026
Table 204. EnviroCraft Recent Development
Table 205. Research Programs/Design for This Report
Table 206. Key Data Information from Secondary Sources
Table 207. Key Data Information from Primary Sources
Table 208. Authors List of This Report
List of Figures
Figure 1. WEEE (Waste Electrical and Electronic Equipment) Recycling Picture
Figure 2. Global WEEE (Waste Electrical and Electronic Equipment) Recycling Market Size Comparison by Type (US$ Million), 2021–2032
Figure 3. Global WEEE (Waste Electrical and Electronic Equipment) Recycling Market Share by Type: 2025 vs 2032
Figure 4. Heat Exchangers (Refrigerator, Freezer, Air Conditioner, Dehumidifier, Heat Pump, etc.) Features
Figure 5. Display Devices for Use In Private Households (Monitors, TVs, LCD Screens, Notebook Computers, etc.) Features
Figure 6. Lamps/Glow-Discharge Lamps (Fluorescent Lamps, Compact Fluorescent Lamps, Discharge Lamps, LED Lamps, etc.) Features
Figure 7. Large Electronic Devices (Household Appliances, Electric Heaters, Stoves, Ventilators) Features
Figure 8. Small Electrical and Electronic Devices (Small Household Appliances, Consumer Electronics, Flashlights, Small Fans, etc.) Features
Figure 9. Small IT and Telecommunication Devices (Mobile Phones, GPS Navigation Devices, Calculators, etc.) Features
Figure 10. Global WEEE (Waste Electrical and Electronic Equipment) Recycling Market Size by Application (US$ Million), 2021–2032
Figure 11. Global WEEE (Waste Electrical and Electronic Equipment) Recycling Market Share by Application: 2025 vs 2032
Figure 12. Environmental Protection Case Studies
Figure 13. Metal Smelting Case Studies
Figure 14. Chemical Extraction Case Studies
Figure 15. Energy Power Case Studies
Figure 16. WEEE (Waste Electrical and Electronic Equipment) Recycling Report Years Considered
Figure 17. Global WEEE (Waste Electrical and Electronic Equipment) Recycling Market Size (US$ Million), Year-over-Year: 2021–2032
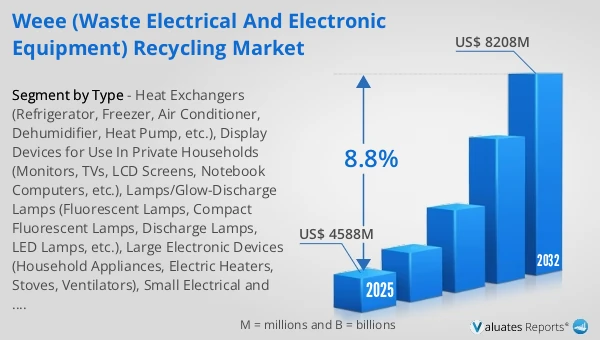
Figure 18. Global WEEE (Waste Electrical and Electronic Equipment) Recycling Market Size, (US$ Million), 2021 vs 2025 vs 2032
Figure 19. Global WEEE (Waste Electrical and Electronic Equipment) Recycling Market Share by Region: 2025 vs 2032
Figure 20. Global WEEE (Waste Electrical and Electronic Equipment) Recycling Market Share by Players in 2025
Figure 21. Global WEEE (Waste Electrical and Electronic Equipment) Recycling Market Share by Company Type (Tier 1, Tier 2, and Tier 3)
Figure 22. The Top 10 and 5 Players Market Share by WEEE (Waste Electrical and Electronic Equipment) Recycling Revenue in 2025
Figure 23. North America WEEE (Waste Electrical and Electronic Equipment) Recycling Market Size YoY Growth (US$ Million), 2021–2032
Figure 24. North America WEEE (Waste Electrical and Electronic Equipment) Recycling Market Share by Country (2021–2032)
Figure 25. United States WEEE (Waste Electrical and Electronic Equipment) Recycling Market Size YoY Growth (US$ Million), 2021–2032
Figure 26. Canada WEEE (Waste Electrical and Electronic Equipment) Recycling Market Size YoY Growth (US$ Million), 2021–2032
Figure 27. Europe WEEE (Waste Electrical and Electronic Equipment) Recycling Market Size YoY Growth (US$ Million), 2021–2032
Figure 28. Europe WEEE (Waste Electrical and Electronic Equipment) Recycling Market Share by Country (2021–2032)
Figure 29. Germany WEEE (Waste Electrical and Electronic Equipment) Recycling Market Size YoY Growth (US$ Million), 2021–2032
Figure 30. France WEEE (Waste Electrical and Electronic Equipment) Recycling Market Size YoY Growth (US$ Million), 2021–2032
Figure 31. U.K. WEEE (Waste Electrical and Electronic Equipment) Recycling Market Size YoY Growth (US$ Million), 2021–2032
Figure 32. Italy WEEE (Waste Electrical and Electronic Equipment) Recycling Market Size YoY Growth (US$ Million), 2021–2032
Figure 33. Russia WEEE (Waste Electrical and Electronic Equipment) Recycling Market Size YoY Growth (US$ Million), 2021–2032
Figure 34. Ireland WEEE (Waste Electrical and Electronic Equipment) Recycling Market Size YoY Growth (US$ Million), 2021–2032
Figure 35. Asia-Pacific WEEE (Waste Electrical and Electronic Equipment) Recycling Market Size YoY Growth (US$ Million), 2021–2032
Figure 36. Asia-Pacific WEEE (Waste Electrical and Electronic Equipment) Recycling Market Share by Region (2021–2032)
Figure 37. China WEEE (Waste Electrical and Electronic Equipment) Recycling Market Size YoY Growth (US$ Million), 2021–2032
Figure 38. Japan WEEE (Waste Electrical and Electronic Equipment) Recycling Market Size YoY Growth (US$ Million), 2021–2032
Figure 39. South Korea WEEE (Waste Electrical and Electronic Equipment) Recycling Market Size YoY Growth (US$ Million), 2021–2032
Figure 40. Southeast Asia WEEE (Waste Electrical and Electronic Equipment) Recycling Market Size YoY Growth (US$ Million), 2021–2032
Figure 41. India WEEE (Waste Electrical and Electronic Equipment) Recycling Market Size YoY Growth (US$ Million), 2021–2032
Figure 42. Australia & New Zealand WEEE (Waste Electrical and Electronic Equipment) Recycling Market Size YoY Growth (US$ Million), 2021–2032
Figure 43. Latin America WEEE (Waste Electrical and Electronic Equipment) Recycling Market Size YoY Growth (US$ Million), 2021–2032
Figure 44. Latin America WEEE (Waste Electrical and Electronic Equipment) Recycling Market Share by Country (2021–2032)
Figure 45. Mexico WEEE (Waste Electrical and Electronic Equipment) Recycling Market Size YoY Growth (US$ Million), 2021–2032
Figure 46. Brazil WEEE (Waste Electrical and Electronic Equipment) Recycling Market Size YoY Growth (US$ Million), 2021–2032
Figure 47. Middle East & Africa WEEE (Waste Electrical and Electronic Equipment) Recycling Market Size YoY Growth (US$ Million), 2021–2032
Figure 48. Middle East & Africa WEEE (Waste Electrical and Electronic Equipment) Recycling Market Share by Country (2021–2032)
Figure 49. Israel WEEE (Waste Electrical and Electronic Equipment) Recycling Market Size YoY Growth (US$ Million), 2021–2032
Figure 50. Saudi Arabia WEEE (Waste Electrical and Electronic Equipment) Recycling Market Size YoY Growth (US$ Million), 2021–2032
Figure 51. UAE WEEE (Waste Electrical and Electronic Equipment) Recycling Market Size YoY Growth (US$ Million), 2021–2032
Figure 52. China Resources and Environment Revenue Growth Rate in WEEE (Waste Electrical and Electronic Equipment) Recycling Business (2021–2026)
Figure 53. Boliden AB Revenue Growth Rate in WEEE (Waste Electrical and Electronic Equipment) Recycling Business (2021–2026)
Figure 54. Veolia Revenue Growth Rate in WEEE (Waste Electrical and Electronic Equipment) Recycling Business (2021–2026)
Figure 55. GEM Revenue Growth Rate in WEEE (Waste Electrical and Electronic Equipment) Recycling Business (2021–2026)
Figure 56. Umicore Revenue Growth Rate in WEEE (Waste Electrical and Electronic Equipment) Recycling Business (2021–2026)
Figure 57. Stena Metall Revenue Growth Rate in WEEE (Waste Electrical and Electronic Equipment) Recycling Business (2021–2026)
Figure 58. Gree Electric Revenue Growth Rate in WEEE (Waste Electrical and Electronic Equipment) Recycling Business (2021–2026)
Figure 59. Sound Environmental Resour Revenue Growth Rate in WEEE (Waste Electrical and Electronic Equipment) Recycling Business (2021–2026)
Figure 60. Galloo N.V. Revenue Growth Rate in WEEE (Waste Electrical and Electronic Equipment) Recycling Business (2021–2026)
Figure 61. SIMS Metals Revenue Growth Rate in WEEE (Waste Electrical and Electronic Equipment) Recycling Business (2021–2026)
Figure 62. TCL Revenue Growth Rate in WEEE (Waste Electrical and Electronic Equipment) Recycling Business (2021–2026)
Figure 63. Electronic Recyclers International (ERI) Revenue Growth Rate in WEEE (Waste Electrical and Electronic Equipment) Recycling Business (2021–2026)
Figure 64. Capital Environment Holdings Revenue Growth Rate in WEEE (Waste Electrical and Electronic Equipment) Recycling Business (2021–2026)
Figure 65. Alba AG Revenue Growth Rate in WEEE (Waste Electrical and Electronic Equipment) Recycling Business (2021–2026)
Figure 66. Aurubis Revenue Growth Rate in WEEE (Waste Electrical and Electronic Equipment) Recycling Business (2021–2026)
Figure 67. Coolrec B.V. Revenue Growth Rate in WEEE (Waste Electrical and Electronic Equipment) Recycling Business (2021–2026)
Figure 68. Environnement Recycling Revenue Growth Rate in WEEE (Waste Electrical and Electronic Equipment) Recycling Business (2021–2026)
Figure 69. Ecoreset Revenue Growth Rate in WEEE (Waste Electrical and Electronic Equipment) Recycling Business (2021–2026)
Figure 70. Hwaxin Environmental Revenue Growth Rate in WEEE (Waste Electrical and Electronic Equipment) Recycling Business (2021–2026)
Figure 71. E-Reciklaza Revenue Growth Rate in WEEE (Waste Electrical and Electronic Equipment) Recycling Business (2021–2026)
Figure 72. Sichuan Changhong Gerun Environmental Protection Technology Revenue Growth Rate in WEEE (Waste Electrical and Electronic Equipment) Recycling Business (2021–2026)
Figure 73. Quantum Lifecycle Partners Revenue Growth Rate in WEEE (Waste Electrical and Electronic Equipment) Recycling Business (2021–2026)
Figure 74. Tetronics Revenue Growth Rate in WEEE (Waste Electrical and Electronic Equipment) Recycling Business (2021–2026)
Figure 75. Enviro-Hub Holdings Revenue Growth Rate in WEEE (Waste Electrical and Electronic Equipment) Recycling Business (2021–2026)
Figure 76. WEEE Centre Revenue Growth Rate in WEEE (Waste Electrical and Electronic Equipment) Recycling Business (2021–2026)
Figure 77. WEEE Ireland Revenue Growth Rate in WEEE (Waste Electrical and Electronic Equipment) Recycling Business (2021–2026)
Figure 78. Beijing Enterprises Urban Resources Group Revenue Growth Rate in WEEE (Waste Electrical and Electronic Equipment) Recycling Business (2021–2026)
Figure 79. China Daye Non-Ferrous Revenue Growth Rate in WEEE (Waste Electrical and Electronic Equipment) Recycling Business (2021–2026)
Figure 80. Guangdong Huaqing Waste Treatment Revenue Growth Rate in WEEE (Waste Electrical and Electronic Equipment) Recycling Business (2021–2026)
Figure 81. Jiangsu Subei Waste Automobile Household Appliances Disassembly Recycling Revenue Growth Rate in WEEE (Waste Electrical and Electronic Equipment) Recycling Business (2021–2026)
Figure 82. EnviroCraft Revenue Growth Rate in WEEE (Waste Electrical and Electronic Equipment) Recycling Business (2021–2026)
Figure 83. Bottom-up and Top-down Approaches for This Report
Figure 84. Data Triangulation
Figure 85. Key Executives Interviewed