0
U.S. (TOLL FREE)
+1 (315) 215-3225
Automative

0
U.S. (TOLL FREE)
+1 (315) 215-3225
Global Recycled Materials Packaging Solutions Market Insights, Forecast to 2030
Published Date: December 2024
|
Report Code: QYRE-Auto-26T978
Home | Market Reports | Business & Industrial| Transportation & Logistics
Global Recycled Materials Packaging Solutions Market Insights Forecast to 2028
BUY CHAPTERS

Global Recycled Materials Packaging Solutions Market Insights, Forecast to 2030

Code: QYRE-Auto-26T978
Report
December 2024
Pages:111
QYResearch
Buy Now with 15% Discount
DESCRIPTION
TABLE OF CONTENT
TABLES & FIGURES

Recycled Materials Packaging Solutions Market Size

The global Recycled Materials Packaging Solutions market is projected to grow from US$ 198960 million in 2024 to US$ 232080 million by 2030, at a Compound Annual Growth Rate (CAGR) of 2.6% during the forecast period.

Recycled Materials Packaging Solutions Market

Recycled Materials Packaging Solutions Market

Recycled Materials Packaging is packaging made of materials that can be used again, usually after processing.
Market Analysis and Insights: Global Recycled Materials Packaging Solutions Market
The US & Canada market for Recycled Materials Packaging Solutions is estimated to increase from $ million in 2024 to reach $ million by 2030, at a CAGR of % during the forecast period of 2025 through 2030.
The China market for Recycled Materials Packaging Solutions is estimated to increase from $ million in 2024 to reach $ million by 2030, at a CAGR of % during the forecast period of 2025 through 2030.
The Europe market for Recycled Materials Packaging Solutions is estimated to increase from $ million in 2024 to reach $ million by 2030, at a CAGR of % during the forecast period of 2025 through 2030.
The global key companies of Recycled Materials Packaging Solutions include BASF, DuPont, Amcor, Sealed Air, Mondi Group, Kruger, Ranpak, Biopac and Tetra Laval, etc. In 2023, the global top five players had a share approximately % in terms of revenue.
Recycled Materials Packaging Solutions is widely used in various fields, such as Food, Beverage, Pharmaceutical and Personal Care, etc. Food provides greatest supports to the Recycled Materials Packaging Solutions industry development. In 2023, global % revenue of Recycled Materials Packaging Solutions went into Food filed and the proportion will reach to % in 2030.
Report Covers:
This report presents an overview of global market for Recycled Materials Packaging Solutions market size. Analyses of the global market trends, with historic market revenue data for 2019 - 2023, estimates for 2024, and projections of CAGR through 2030.
This report researches the key producers of Recycled Materials Packaging Solutions, also provides the revenue of main regions and countries. Highlights of the upcoming market potential for Recycled Materials Packaging Solutions, and key regions/countries of focus to forecast this market into various segments and sub-segments. Country specific data and market value analysis for the U.S., Canada, Mexico, Brazil, China, Japan, South Korea, Southeast Asia, India, Germany, the U.K., Italy, Middle East, Africa, and Other Countries.
This report focuses on the Recycled Materials Packaging Solutions revenue, market share and industry ranking of main companies, data from 2019 to 2024. Identification of the major stakeholders in the global Recycled Materials Packaging Solutions market, and analysis of their competitive landscape and market positioning based on recent developments and segmental revenues. This report will help stakeholders to understand the competitive landscape and gain more insights and position their businesses and market strategies in a better way.
This report analyzes the segments data by Type and by Application, revenue, and growth rate, from 2019 to 2030. Evaluation and forecast the market size for Recycled Materials Packaging Solutions revenue, projected growth trends, production technology, application and end-user industry.
Market Segmentation

Scope of Recycled Materials Packaging Solutions Market Report

Report Metric Details
Report Name Recycled Materials Packaging Solutions Market
Accounted market size in 2024 US$ 198960 million
Forecasted market size in 2030 US$ 232080 million
CAGR 2.6
Base Year 2024
Forecasted years 2025 - 2030
Segment by Type
  • Cornstarch Packaging
  • Eco-friendly and Recycled Plastic
  • Mushroom Packaging
  • Leaf Plates
  • Biodegradable Packaging Peanuts
  • Single Strip Cardboard Packaging
  • Other
Segment by Application
  • Food
  • Beverage
  • Pharmaceutical
  • Personal Care
  • Other
By Region
  • North America (United States, Canada)
  • Europe (Germany, France, UK, Italy, Russia) Rest of Europe
  • Nordic Countries
  • Asia-Pacific (China, Japan, South Korea)
  • Southeast Asia (India, Australia)
  • Rest of Asia
  • Latin America (Mexico, Brazil)
  • Rest of Latin America
  • Middle East & Africa (Turkey, Saudi Arabia, UAE, Rest of MEA)
By Company BASF, DuPont, Amcor, Sealed Air, Mondi Group, Kruger, Ranpak, Biopac, Tetra Laval, International Paper, Smurfit Kappa Group
Forecast units USD million in value
Report coverage Revenue and volume forecast, company share, competitive landscape, growth factors and trends

Chapter Outline

  • Chapter 1: Introduces the report scope of the report, executive summary of different market segments (product type, application, etc), including the market size of each market segment, future development potential, and so on. It offers a high-level view of the current state of the market and its likely evolution in the short to mid-term, and long term.
  • Chapter 2: Revenue of Recycled Materials Packaging Solutions in global and regional level. It provides a quantitative analysis of the market size and development potential of each region and its main countries and introduces the market development, future development prospects, market space, and capacity of each country in the world. This section also introduces the market dynamics, latest developments of the market, the driving factors and restrictive factors of the market, the challenges and risks faced by companies in the industry, and the analysis of relevant policies in the industry.
  • Chapter 3: Detailed analysis of Recycled Materials Packaging Solutions companies’ competitive landscape, revenue, market share and industry ranking, latest development plan, merger, and acquisition information, etc.
  • Chapter 4: Provides the analysis of various market segments by Type, covering the revenue, and development potential of each market segment, to help readers find the blue ocean market in different market segments.
  • Chapter 5: Provides the analysis of various market segments by Application, covering the revenue, and development potential of each market segment, to help readers find the blue ocean market in different downstream markets.
  • Chapter 6: North America (US & Canada) by Type, by Application and by country, revenue for each segment.
  • Chapter 7: Europe by Type, by Application and by country, revenue for each segment.
  • Chapter 8: China by Type, and by Application, revenue for each segment.
  • Chapter 9: Asia (excluding China) by Type, by Application and by region, revenue for each segment.
  • Chapter 10: Middle East, Africa, and Latin America by Type, by Application and by country, revenue for each segment.
  • Chapter 11: Provides profiles of key companies, introducing the basic situation of the main companies in the market in detail, including product descriptions and specifications, Recycled Materials Packaging Solutions revenue, gross margin, and recent development, etc.
  • Chapter 12: Analyst's Viewpoints/Conclusions

FAQ for this report

How fast is Recycled Materials Packaging Solutions Market growing?

Ans: The Recycled Materials Packaging Solutions Market witnessing a CAGR of 2.6 during the forecast period 2025-2030.

What is the Recycled Materials Packaging Solutions Market size in 2030?

Ans: The Recycled Materials Packaging Solutions Market size in 2030 will be US$ 232080 million.

Who are the main players in the Recycled Materials Packaging Solutions Market report?

Ans: The main players in the Recycled Materials Packaging Solutions Market are BASF, DuPont, Amcor, Sealed Air, Mondi Group, Kruger, Ranpak, Biopac, Tetra Laval, International Paper, Smurfit Kappa Group

What are the Application segmentation covered in the Recycled Materials Packaging Solutions Market report?

Ans: The Applications covered in the Recycled Materials Packaging Solutions Market report are Food, Beverage, Pharmaceutical, Personal Care, Other

What are the Type segmentation covered in the Recycled Materials Packaging Solutions Market report?

Ans: The Types covered in the Recycled Materials Packaging Solutions Market report are Cornstarch Packaging, Eco-friendly and Recycled Plastic, Mushroom Packaging, Leaf Plates, Biodegradable Packaging Peanuts, Single Strip Cardboard Packaging, Other

1 Report Overview
1.1 Study Scope
1.2 Market Analysis by Type
1.2.1 Global Recycled Materials Packaging Solutions Market Size Growth Rate by Type, 2019 VS 2023 VS 2030
1.2.2 Cornstarch Packaging
1.2.3 Eco-friendly and Recycled Plastic
1.2.4 Mushroom Packaging
1.2.5 Leaf Plates
1.2.6 Biodegradable Packaging Peanuts
1.2.7 Single Strip Cardboard Packaging
1.2.8 Other
1.3 Market by Application
1.3.1 Global Recycled Materials Packaging Solutions Market Size Growth Rate by Application, 2019 VS 2023 VS 2030
1.3.2 Food
1.3.3 Beverage
1.3.4 Pharmaceutical
1.3.5 Personal Care
1.3.6 Other
1.4 Assumptions and Limitations
1.5 Study Objectives
1.6 Years Considered
2 Global Growth Trends
2.1 Global Recycled Materials Packaging Solutions Market Perspective (2019-2030)
2.2 Global Recycled Materials Packaging Solutions Growth Trends by Region
2.2.1 Recycled Materials Packaging Solutions Market Size by Region: 2019 VS 2023 VS 2030
2.2.2 Recycled Materials Packaging Solutions Historic Market Size by Region (2019-2024)
2.2.3 Recycled Materials Packaging Solutions Forecasted Market Size by Region (2025-2030)
2.3 Recycled Materials Packaging Solutions Market Dynamics
2.3.1 Recycled Materials Packaging Solutions Industry Trends
2.3.2 Recycled Materials Packaging Solutions Market Drivers
2.3.3 Recycled Materials Packaging Solutions Market Challenges
2.3.4 Recycled Materials Packaging Solutions Market Restraints
3 Competition Landscape by Key Players
3.1 Global Revenue Recycled Materials Packaging Solutions by Players
3.1.1 Global Recycled Materials Packaging Solutions Revenue by Players (2019-2024)
3.1.2 Global Recycled Materials Packaging Solutions Revenue Market Share by Players (2019-2024)
3.2 Global Recycled Materials Packaging Solutions Market Share by Company Type (Tier 1, Tier 2, and Tier 3)
3.3 Global Key Players of Recycled Materials Packaging Solutions, Ranking by Revenue, 2022 VS 2023 VS 2024
3.4 Global Recycled Materials Packaging Solutions Market Concentration Ratio
3.4.1 Global Recycled Materials Packaging Solutions Market Concentration Ratio (CR5 and HHI)
3.4.2 Global Top 10 and Top 5 Companies by Recycled Materials Packaging Solutions Revenue in 2023
3.5 Global Key Players of Recycled Materials Packaging Solutions Head office and Area Served
3.6 Global Key Players of Recycled Materials Packaging Solutions, Product and Application
3.7 Global Key Players of Recycled Materials Packaging Solutions, Date of Enter into This Industry
3.8 Mergers & Acquisitions, Expansion Plans
4 Recycled Materials Packaging Solutions Breakdown Data by Type
4.1 Global Recycled Materials Packaging Solutions Historic Market Size by Type (2019-2024)
4.2 Global Recycled Materials Packaging Solutions Forecasted Market Size by Type (2025-2030)
5 Recycled Materials Packaging Solutions Breakdown Data by Application
5.1 Global Recycled Materials Packaging Solutions Historic Market Size by Application (2019-2024)
5.2 Global Recycled Materials Packaging Solutions Forecasted Market Size by Application (2025-2030)
6 North America
6.1 North America Recycled Materials Packaging Solutions Market Size (2019-2030)
6.2 North America Recycled Materials Packaging Solutions Market Size by Type
6.2.1 North America Recycled Materials Packaging Solutions Market Size by Type (2019-2024)
6.2.2 North America Recycled Materials Packaging Solutions Market Size by Type (2025-2030)
6.2.3 North America Recycled Materials Packaging Solutions Market Share by Type (2019-2030)
6.3 North America Recycled Materials Packaging Solutions Market Size by Application
6.3.1 North America Recycled Materials Packaging Solutions Market Size by Application (2019-2024)
6.3.2 North America Recycled Materials Packaging Solutions Market Size by Application (2025-2030)
6.3.3 North America Recycled Materials Packaging Solutions Market Share by Application (2019-2030)
6.4 North America Recycled Materials Packaging Solutions Market Size by Country
6.4.1 North America Recycled Materials Packaging Solutions Market Size by Country: 2019 VS 2023 VS 2030
6.4.2 North America Recycled Materials Packaging Solutions Market Size by Country (2019-2024)
6.4.3 North America Recycled Materials Packaging Solutions Market Size by Country (2025-2030)
6.4.4 U.S.
6.4.5 Canada
7 Europe
7.1 Europe Recycled Materials Packaging Solutions Market Size (2019-2030)
7.2 Europe Recycled Materials Packaging Solutions Market Size by Type
7.2.1 Europe Recycled Materials Packaging Solutions Market Size by Type (2019-2024)
7.2.2 Europe Recycled Materials Packaging Solutions Market Size by Type (2025-2030)
7.2.3 Europe Recycled Materials Packaging Solutions Market Share by Type (2019-2030)
7.3 Europe Recycled Materials Packaging Solutions Market Size by Application
7.3.1 Europe Recycled Materials Packaging Solutions Market Size by Application (2019-2024)
7.3.2 Europe Recycled Materials Packaging Solutions Market Size by Application (2025-2030)
7.3.3 Europe Recycled Materials Packaging Solutions Market Share by Application (2019-2030)
7.4 Europe Recycled Materials Packaging Solutions Market Size by Country
7.4.1 Europe Recycled Materials Packaging Solutions Market Size by Country: 2019 VS 2023 VS 2030
7.4.2 Europe Recycled Materials Packaging Solutions Market Size by Country (2019-2024)
7.4.3 Europe Recycled Materials Packaging Solutions Market Size by Country (2025-2030)
7.4.3 Germany
7.4.4 France
7.4.5 U.K.
7.4.6 Italy
7.4.7 Russia
7.4.8 Nordic Countries
8 China
8.1 China Recycled Materials Packaging Solutions Market Size (2019-2030)
8.2 China Recycled Materials Packaging Solutions Market Size by Type
8.2.1 China Recycled Materials Packaging Solutions Market Size by Type (2019-2024)
8.2.2 China Recycled Materials Packaging Solutions Market Size by Type (2025-2030)
8.2.3 China Recycled Materials Packaging Solutions Market Share by Type (2019-2030)
8.3 China Recycled Materials Packaging Solutions Market Size by Application
8.3.1 China Recycled Materials Packaging Solutions Market Size by Application (2019-2024)
8.3.2 China Recycled Materials Packaging Solutions Market Size by Application (2025-2030)
8.3.3 China Recycled Materials Packaging Solutions Market Share by Application (2019-2030)
9 Asia (excluding China)
9.1 Asia Recycled Materials Packaging Solutions Market Size (2019-2030)
9.2 Asia Recycled Materials Packaging Solutions Market Size by Type
9.2.1 Asia Recycled Materials Packaging Solutions Market Size by Type (2019-2024)
9.2.2 Asia Recycled Materials Packaging Solutions Market Size by Type (2025-2030)
9.2.3 Asia Recycled Materials Packaging Solutions Market Share by Type (2019-2030)
9.3 Asia Recycled Materials Packaging Solutions Market Size by Application
9.3.1 Asia Recycled Materials Packaging Solutions Market Size by Application (2019-2024)
9.3.2 Asia Recycled Materials Packaging Solutions Market Size by Application (2025-2030)
9.3.3 Asia Recycled Materials Packaging Solutions Market Share by Application (2019-2030)
9.4 Asia Recycled Materials Packaging Solutions Market Size by Region
9.4.1 Asia Recycled Materials Packaging Solutions Market Size by Region: 2019 VS 2023 VS 2030
9.4.2 Asia Recycled Materials Packaging Solutions Market Size by Region (2019-2024)
9.4.3 Asia Recycled Materials Packaging Solutions Market Size by Region (2025-2030)
9.4.4 Japan
9.4.5 South Korea
9.4.6 China Taiwan
9.4.7 Southeast Asia
9.4.8 India
9.4.9 Australia
10 Middle East, Africa, and Latin America
10.1 Middle East, Africa, and Latin America Recycled Materials Packaging Solutions Market Size (2019-2030)
10.2 Middle East, Africa, and Latin America Recycled Materials Packaging Solutions Market Size by Type
10.2.1 Middle East, Africa, and Latin America Recycled Materials Packaging Solutions Market Size by Type (2019-2024)
10.2.2 Middle East, Africa, and Latin America Recycled Materials Packaging Solutions Market Size by Type (2025-2030)
10.2.3 Middle East, Africa, and Latin America Recycled Materials Packaging Solutions Market Share by Type (2019-2030)
10.3 Middle East, Africa, and Latin America Recycled Materials Packaging Solutions Market Size by Application
10.3.1 Middle East, Africa, and Latin America Recycled Materials Packaging Solutions Market Size by Application (2019-2024)
10.3.2 Middle East, Africa, and Latin America Recycled Materials Packaging Solutions Market Size by Application (2025-2030)
10.3.3 Middle East, Africa, and Latin America Recycled Materials Packaging Solutions Market Share by Application (2019-2030)
10.4 Middle East, Africa, and Latin America Recycled Materials Packaging Solutions Market Size by Country
10.4.1 Middle East, Africa, and Latin America Recycled Materials Packaging Solutions Market Size by Country: 2019 VS 2023 VS 2030
10.4.2 Middle East, Africa, and Latin America Recycled Materials Packaging Solutions Market Size by Country (2019-2024)
10.4.3 Middle East, Africa, and Latin America Recycled Materials Packaging Solutions Market Size by Country (2025-2030)
10.4.4 Brazil
10.4.5 Mexico
10.4.6 Turkey
10.4.7 Saudi Arabia
10.4.8 Israel
10.4.9 GCC Countries
11 Key Players Profiles
11.1 BASF
11.1.1 BASF Company Details
11.1.2 BASF Business Overview
11.1.3 BASF Recycled Materials Packaging Solutions Introduction
11.1.4 BASF Revenue in Recycled Materials Packaging Solutions Business (2019-2024)
11.1.5 BASF Recent Developments
11.2 DuPont
11.2.1 DuPont Company Details
11.2.2 DuPont Business Overview
11.2.3 DuPont Recycled Materials Packaging Solutions Introduction
11.2.4 DuPont Revenue in Recycled Materials Packaging Solutions Business (2019-2024)
11.2.5 DuPont Recent Developments
11.3 Amcor
11.3.1 Amcor Company Details
11.3.2 Amcor Business Overview
11.3.3 Amcor Recycled Materials Packaging Solutions Introduction
11.3.4 Amcor Revenue in Recycled Materials Packaging Solutions Business (2019-2024)
11.3.5 Amcor Recent Developments
11.4 Sealed Air
11.4.1 Sealed Air Company Details
11.4.2 Sealed Air Business Overview
11.4.3 Sealed Air Recycled Materials Packaging Solutions Introduction
11.4.4 Sealed Air Revenue in Recycled Materials Packaging Solutions Business (2019-2024)
11.4.5 Sealed Air Recent Developments
11.5 Mondi Group
11.5.1 Mondi Group Company Details
11.5.2 Mondi Group Business Overview
11.5.3 Mondi Group Recycled Materials Packaging Solutions Introduction
11.5.4 Mondi Group Revenue in Recycled Materials Packaging Solutions Business (2019-2024)
11.5.5 Mondi Group Recent Developments
11.6 Kruger
11.6.1 Kruger Company Details
11.6.2 Kruger Business Overview
11.6.3 Kruger Recycled Materials Packaging Solutions Introduction
11.6.4 Kruger Revenue in Recycled Materials Packaging Solutions Business (2019-2024)
11.6.5 Kruger Recent Developments
11.7 Ranpak
11.7.1 Ranpak Company Details
11.7.2 Ranpak Business Overview
11.7.3 Ranpak Recycled Materials Packaging Solutions Introduction
11.7.4 Ranpak Revenue in Recycled Materials Packaging Solutions Business (2019-2024)
11.7.5 Ranpak Recent Developments
11.8 Biopac
11.8.1 Biopac Company Details
11.8.2 Biopac Business Overview
11.8.3 Biopac Recycled Materials Packaging Solutions Introduction
11.8.4 Biopac Revenue in Recycled Materials Packaging Solutions Business (2019-2024)
11.8.5 Biopac Recent Developments
11.9 Tetra Laval
11.9.1 Tetra Laval Company Details
11.9.2 Tetra Laval Business Overview
11.9.3 Tetra Laval Recycled Materials Packaging Solutions Introduction
11.9.4 Tetra Laval Revenue in Recycled Materials Packaging Solutions Business (2019-2024)
11.9.5 Tetra Laval Recent Developments
11.10 International Paper
11.10.1 International Paper Company Details
11.10.2 International Paper Business Overview
11.10.3 International Paper Recycled Materials Packaging Solutions Introduction
11.10.4 International Paper Revenue in Recycled Materials Packaging Solutions Business (2019-2024)
11.10.5 International Paper Recent Developments
11.11 Smurfit Kappa Group
11.11.1 Smurfit Kappa Group Company Details
11.11.2 Smurfit Kappa Group Business Overview
11.11.3 Smurfit Kappa Group Recycled Materials Packaging Solutions Introduction
11.11.4 Smurfit Kappa Group Revenue in Recycled Materials Packaging Solutions Business (2019-2024)
11.11.5 Smurfit Kappa Group Recent Developments
12 Analyst's Viewpoints/Conclusions
13 Appendix
13.1 Research Methodology
13.1.1 Methodology/Research Approach
13.1.2 Data Source
13.2 Disclaimer
13.3 Author Details
List of Tables
    Table 1. Global Recycled Materials Packaging Solutions Market Size Growth Rate by Type (US$ Million), 2019 VS 2023 VS 2030
    Table 2. Key Players of Cornstarch Packaging
    Table 3. Key Players of Eco-friendly and Recycled Plastic
    Table 4. Key Players of Mushroom Packaging
    Table 5. Key Players of Leaf Plates
    Table 6. Key Players of Biodegradable Packaging Peanuts
    Table 7. Key Players of Single Strip Cardboard Packaging
    Table 8. Key Players of Other
    Table 9. Global Recycled Materials Packaging Solutions Market Size Growth Rate by Application (US$ Million), 2019 VS 2023 VS 2030
    Table 10. Global Recycled Materials Packaging Solutions Market Size Growth Rate (CAGR) by Region (US$ Million): 2019 VS 2023 VS 2030
    Table 11. Global Recycled Materials Packaging Solutions Market Size by Region (2019-2024) & (US$ Million)
    Table 12. Global Recycled Materials Packaging Solutions Market Share by Region (2019-2024)
    Table 13. Global Recycled Materials Packaging Solutions Forecasted Market Size by Region (2025-2030) & (US$ Million)
    Table 14. Global Recycled Materials Packaging Solutions Market Share by Region (2025-2030)
    Table 15. Recycled Materials Packaging Solutions Market Trends
    Table 16. Recycled Materials Packaging Solutions Market Drivers
    Table 17. Recycled Materials Packaging Solutions Market Challenges
    Table 18. Recycled Materials Packaging Solutions Market Restraints
    Table 19. Global Recycled Materials Packaging Solutions Revenue by Players (2019-2024) & (US$ Million)
    Table 20. Global Recycled Materials Packaging Solutions Revenue Share by Players (2019-2024)
    Table 21. Global Top Recycled Materials Packaging Solutions by Company Type (Tier 1, Tier 2, and Tier 3) & (based on the Revenue in Recycled Materials Packaging Solutions as of 2023)
    Table 22. Global Recycled Materials Packaging Solutions Industry Ranking 2022 VS 2023 VS 2024
    Table 23. Global 5 Largest Players Market Share by Recycled Materials Packaging Solutions Revenue (CR5 and HHI) & (2019-2024)
    Table 24. Global Key Players of Recycled Materials Packaging Solutions, Headquarters and Area Served
    Table 25. Global Key Players of Recycled Materials Packaging Solutions, Product and Application
    Table 26. Global Key Players of Recycled Materials Packaging Solutions, Product and Application
    Table 27. Mergers & Acquisitions, Expansion Plans
    Table 28. Global Recycled Materials Packaging Solutions Market Size by Type (2019-2024) & (US$ Million)
    Table 29. Global Recycled Materials Packaging Solutions Revenue Market Share by Type (2019-2024)
    Table 30. Global Recycled Materials Packaging Solutions Forecasted Market Size by Type (2025-2030) & (US$ Million)
    Table 31. Global Recycled Materials Packaging Solutions Revenue Market Share by Type (2025-2030)
    Table 32. Global Recycled Materials Packaging Solutions Market Size by Application (2019-2024) & (US$ Million)
    Table 33. Global Recycled Materials Packaging Solutions Revenue Share by Application (2019-2024)
    Table 34. Global Recycled Materials Packaging Solutions Forecasted Market Size by Application (2025-2030) & (US$ Million)
    Table 35. Global Recycled Materials Packaging Solutions Revenue Share by Application (2025-2030)
    Table 36. North America Recycled Materials Packaging Solutions Market Size by Type (2019-2024) & (US$ Million)
    Table 37. North America Recycled Materials Packaging Solutions Market Size by Type (2025-2030) & (US$ Million)
    Table 38. North America Recycled Materials Packaging Solutions Market Size by Application (2019-2024) & (US$ Million)
    Table 39. North America Recycled Materials Packaging Solutions Market Size by Application (2025-2030) & (US$ Million)
    Table 40. North America Recycled Materials Packaging Solutions Growth Rate (CAGR) by Country (US$ Million): 2019 VS 2023 VS 2030
    Table 41. North America Recycled Materials Packaging Solutions Market Size by Country (2019-2024) & (US$ Million)
    Table 42. North America Recycled Materials Packaging Solutions Market Size by Country (2025-2030) & (US$ Million)
    Table 43. Europe Recycled Materials Packaging Solutions Market Size by Type (2019-2024) & (US$ Million)
    Table 44. Europe Recycled Materials Packaging Solutions Market Size by Type (2025-2030) & (US$ Million)
    Table 45. Europe Recycled Materials Packaging Solutions Market Size by Application (2019-2024) & (US$ Million)
    Table 46. Europe Recycled Materials Packaging Solutions Market Size by Application (2025-2030) & (US$ Million)
    Table 47. Europe Recycled Materials Packaging Solutions Growth Rate (CAGR) by Country (US$ Million): 2019 VS 2023 VS 2030
    Table 48. Europe Recycled Materials Packaging Solutions Market Size by Country (2019-2024) & (US$ Million)
    Table 49. Europe Recycled Materials Packaging Solutions Market Size by Country (2025-2030) & (US$ Million)
    Table 50. China Recycled Materials Packaging Solutions Market Size by Type (2019-2024) & (US$ Million)
    Table 51. China Recycled Materials Packaging Solutions Market Size by Type (2025-2030) & (US$ Million)
    Table 52. China Recycled Materials Packaging Solutions Market Size by Application (2019-2024) & (US$ Million)
    Table 53. China Recycled Materials Packaging Solutions Market Size by Application (2025-2030) & (US$ Million)
    Table 54. Asia Recycled Materials Packaging Solutions Market Size by Type (2019-2024) & (US$ Million)
    Table 55. Asia Recycled Materials Packaging Solutions Market Size by Type (2025-2030) & (US$ Million)
    Table 56. Asia Recycled Materials Packaging Solutions Market Size by Application (2019-2024) & (US$ Million)
    Table 57. Asia Recycled Materials Packaging Solutions Market Size by Application (2025-2030) & (US$ Million)
    Table 58. Asia Recycled Materials Packaging Solutions Growth Rate (CAGR) by Region (US$ Million): 2019 VS 2023 VS 2030
    Table 59. Asia Recycled Materials Packaging Solutions Market Size by Region (2019-2024) & (US$ Million)
    Table 60. Asia Recycled Materials Packaging Solutions Market Size by Region (2025-2030) & (US$ Million)
    Table 61. Middle East, Africa, and Latin America Recycled Materials Packaging Solutions Market Size by Type (2019-2024) & (US$ Million)
    Table 62. Middle East, Africa, and Latin America Recycled Materials Packaging Solutions Market Size by Type (2025-2030) & (US$ Million)
    Table 63. Middle East, Africa, and Latin America Recycled Materials Packaging Solutions Market Size by Application (2019-2024) & (US$ Million)
    Table 64. Middle East, Africa, and Latin America Recycled Materials Packaging Solutions Market Size by Application (2025-2030) & (US$ Million)
    Table 65. Middle East, Africa, and Latin America Recycled Materials Packaging Solutions Growth Rate (CAGR) by Country (US$ Million): 2019 VS 2023 VS 2030
    Table 66. Middle East, Africa, and Latin America Recycled Materials Packaging Solutions Market Size by Country (2019-2024) & (US$ Million)
    Table 67. Middle East, Africa, and Latin America Recycled Materials Packaging Solutions Market Size by Country (2025-2030) & (US$ Million)
    Table 68. BASF Company Details
    Table 69. BASF Business Overview
    Table 70. BASF Recycled Materials Packaging Solutions Product
    Table 71. BASF Revenue in Recycled Materials Packaging Solutions Business (2019-2024) & (US$ Million)
    Table 72. BASF Recent Developments
    Table 73. DuPont Company Details
    Table 74. DuPont Business Overview
    Table 75. DuPont Recycled Materials Packaging Solutions Product
    Table 76. DuPont Revenue in Recycled Materials Packaging Solutions Business (2019-2024) & (US$ Million)
    Table 77. DuPont Recent Developments
    Table 78. Amcor Company Details
    Table 79. Amcor Business Overview
    Table 80. Amcor Recycled Materials Packaging Solutions Product
    Table 81. Amcor Revenue in Recycled Materials Packaging Solutions Business (2019-2024) & (US$ Million)
    Table 82. Amcor Recent Developments
    Table 83. Sealed Air Company Details
    Table 84. Sealed Air Business Overview
    Table 85. Sealed Air Recycled Materials Packaging Solutions Product
    Table 86. Sealed Air Revenue in Recycled Materials Packaging Solutions Business (2019-2024) & (US$ Million)
    Table 87. Sealed Air Recent Developments
    Table 88. Mondi Group Company Details
    Table 89. Mondi Group Business Overview
    Table 90. Mondi Group Recycled Materials Packaging Solutions Product
    Table 91. Mondi Group Revenue in Recycled Materials Packaging Solutions Business (2019-2024) & (US$ Million)
    Table 92. Mondi Group Recent Developments
    Table 93. Kruger Company Details
    Table 94. Kruger Business Overview
    Table 95. Kruger Recycled Materials Packaging Solutions Product
    Table 96. Kruger Revenue in Recycled Materials Packaging Solutions Business (2019-2024) & (US$ Million)
    Table 97. Kruger Recent Developments
    Table 98. Ranpak Company Details
    Table 99. Ranpak Business Overview
    Table 100. Ranpak Recycled Materials Packaging Solutions Product
    Table 101. Ranpak Revenue in Recycled Materials Packaging Solutions Business (2019-2024) & (US$ Million)
    Table 102. Ranpak Recent Developments
    Table 103. Biopac Company Details
    Table 104. Biopac Business Overview
    Table 105. Biopac Recycled Materials Packaging Solutions Product
    Table 106. Biopac Revenue in Recycled Materials Packaging Solutions Business (2019-2024) & (US$ Million)
    Table 107. Biopac Recent Developments
    Table 108. Tetra Laval Company Details
    Table 109. Tetra Laval Business Overview
    Table 110. Tetra Laval Recycled Materials Packaging Solutions Product
    Table 111. Tetra Laval Revenue in Recycled Materials Packaging Solutions Business (2019-2024) & (US$ Million)
    Table 112. Tetra Laval Recent Developments
    Table 113. International Paper Company Details
    Table 114. International Paper Business Overview
    Table 115. International Paper Recycled Materials Packaging Solutions Product
    Table 116. International Paper Revenue in Recycled Materials Packaging Solutions Business (2019-2024) & (US$ Million)
    Table 117. International Paper Recent Developments
    Table 118. Smurfit Kappa Group Company Details
    Table 119. Smurfit Kappa Group Business Overview
    Table 120. Smurfit Kappa Group Recycled Materials Packaging Solutions Product
    Table 121. Smurfit Kappa Group Revenue in Recycled Materials Packaging Solutions Business (2019-2024) & (US$ Million)
    Table 122. Smurfit Kappa Group Recent Developments
    Table 123. Research Programs/Design for This Report
    Table 124. Key Data Information from Secondary Sources
    Table 125. Key Data Information from Primary Sources
List of Figures
    Figure 1. Global Recycled Materials Packaging Solutions Market Size Growth Rate by Type, 2019 VS 2023 VS 2030 (US$ Million)
    Figure 2. Global Recycled Materials Packaging Solutions Market Share by Type: 2023 VS 2030
    Figure 3. Cornstarch Packaging Features
    Figure 4. Eco-friendly and Recycled Plastic Features
    Figure 5. Mushroom Packaging Features
    Figure 6. Leaf Plates Features
    Figure 7. Biodegradable Packaging Peanuts Features
    Figure 8. Single Strip Cardboard Packaging Features
    Figure 9. Other Features
    Figure 10. Global Recycled Materials Packaging Solutions Market Size Growth Rate by Application, 2019 VS 2023 VS 2030 (US$ Million)
    Figure 11. Global Recycled Materials Packaging Solutions Market Share by Application: 2023 VS 2030
    Figure 12. Food Case Studies
    Figure 13. Beverage Case Studies
    Figure 14. Pharmaceutical Case Studies
    Figure 15. Personal Care Case Studies
    Figure 16. Other Case Studies
    Figure 17. Recycled Materials Packaging Solutions Report Years Considered
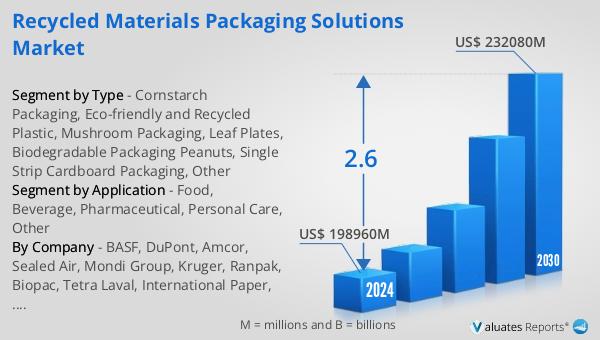
    Figure 18. Global Recycled Materials Packaging Solutions Market Size (US$ Million), Year-over-Year: 2019-2030
    Figure 19. Global Recycled Materials Packaging Solutions Market Size, (US$ Million), 2019 VS 2023 VS 2030
    Figure 20. Global Recycled Materials Packaging Solutions Market Share by Region: 2023 VS 2030
    Figure 21. Global Recycled Materials Packaging Solutions Market Share by Players in 2023
    Figure 22. Global Top Recycled Materials Packaging Solutions Players by Company Type (Tier 1, Tier 2, and Tier 3) & (based on the Revenue in Recycled Materials Packaging Solutions as of 2023)
    Figure 23. The Top 10 and 5 Players Market Share by Recycled Materials Packaging Solutions Revenue in 2023
    Figure 24. North America Recycled Materials Packaging Solutions Market Size YoY Growth (2019-2030) & (US$ Million)
    Figure 25. North America Recycled Materials Packaging Solutions Market Share by Type (2019-2030)
    Figure 26. North America Recycled Materials Packaging Solutions Market Share by Application (2019-2030)
    Figure 27. North America Recycled Materials Packaging Solutions Market Share by Country (2019-2030)
    Figure 28. United States Recycled Materials Packaging Solutions Market Size YoY Growth (2019-2030) & (US$ Million)
    Figure 29. Canada Recycled Materials Packaging Solutions Market Size YoY Growth (2019-2030) & (US$ Million)
    Figure 30. Europe Recycled Materials Packaging Solutions Market Size YoY (2019-2030) & (US$ Million)
    Figure 31. Europe Recycled Materials Packaging Solutions Market Share by Type (2019-2030)
    Figure 32. Europe Recycled Materials Packaging Solutions Market Share by Application (2019-2030)
    Figure 33. Europe Recycled Materials Packaging Solutions Market Share by Country (2019-2030)
    Figure 34. Germany Recycled Materials Packaging Solutions Market Size YoY Growth (2019-2030) & (US$ Million)
    Figure 35. France Recycled Materials Packaging Solutions Market Size YoY Growth (2019-2030) & (US$ Million)
    Figure 36. U.K. Recycled Materials Packaging Solutions Market Size YoY Growth (2019-2030) & (US$ Million)
    Figure 37. Italy Recycled Materials Packaging Solutions Market Size YoY Growth (2019-2030) & (US$ Million)
    Figure 38. Russia Recycled Materials Packaging Solutions Market Size YoY Growth (2019-2030) & (US$ Million)
    Figure 39. Nordic Countries Recycled Materials Packaging Solutions Market Size YoY Growth (2019-2030) & (US$ Million)
    Figure 40. China Recycled Materials Packaging Solutions Market Size YoY (2019-2030) & (US$ Million)
    Figure 41. China Recycled Materials Packaging Solutions Market Share by Type (2019-2030)
    Figure 42. China Recycled Materials Packaging Solutions Market Share by Application (2019-2030)
    Figure 43. Asia Recycled Materials Packaging Solutions Market Size YoY (2019-2030) & (US$ Million)
    Figure 44. Asia Recycled Materials Packaging Solutions Market Share by Type (2019-2030)
    Figure 45. Asia Recycled Materials Packaging Solutions Market Share by Application (2019-2030)
    Figure 46. Asia Recycled Materials Packaging Solutions Market Share by Region (2019-2030)
    Figure 47. Japan Recycled Materials Packaging Solutions Market Size YoY Growth (2019-2030) & (US$ Million)
    Figure 48. South Korea Recycled Materials Packaging Solutions Market Size YoY Growth (2019-2030) & (US$ Million)
    Figure 49. China Taiwan Recycled Materials Packaging Solutions Market Size YoY Growth (2019-2030) & (US$ Million)
    Figure 50. Southeast Asia Recycled Materials Packaging Solutions Market Size YoY Growth (2019-2030) & (US$ Million)
    Figure 51. India Recycled Materials Packaging Solutions Market Size YoY Growth (2019-2030) & (US$ Million)
    Figure 52. Australia Recycled Materials Packaging Solutions Market Size YoY Growth (2019-2030) & (US$ Million)
    Figure 53. Middle East, Africa, and Latin America Recycled Materials Packaging Solutions Market Size YoY (2019-2030) & (US$ Million)
    Figure 54. Middle East, Africa, and Latin America Recycled Materials Packaging Solutions Market Share by Type (2019-2030)
    Figure 55. Middle East, Africa, and Latin America Recycled Materials Packaging Solutions Market Share by Application (2019-2030)
    Figure 56. Middle East, Africa, and Latin America Recycled Materials Packaging Solutions Market Share by Country (2019-2030)
    Figure 57. Brazil Recycled Materials Packaging Solutions Market Size YoY Growth (2019-2030) & (US$ Million)
    Figure 58. Mexico Recycled Materials Packaging Solutions Market Size YoY Growth (2019-2030) & (US$ Million)
    Figure 59. Turkey Recycled Materials Packaging Solutions Market Size YoY Growth (2019-2030) & (US$ Million)
    Figure 60. Saudi Arabia Recycled Materials Packaging Solutions Market Size YoY Growth (2019-2030) & (US$ Million)
    Figure 61. Israel Recycled Materials Packaging Solutions Market Size YoY Growth (2019-2030) & (US$ Million)
    Figure 62. GCC Countries Recycled Materials Packaging Solutions Market Size YoY Growth (2019-2030) & (US$ Million)
    Figure 63. BASF Revenue Growth Rate in Recycled Materials Packaging Solutions Business (2019-2024)
    Figure 64. DuPont Revenue Growth Rate in Recycled Materials Packaging Solutions Business (2019-2024)
    Figure 65. Amcor Revenue Growth Rate in Recycled Materials Packaging Solutions Business (2019-2024)
    Figure 66. Sealed Air Revenue Growth Rate in Recycled Materials Packaging Solutions Business (2019-2024)
    Figure 67. Mondi Group Revenue Growth Rate in Recycled Materials Packaging Solutions Business (2019-2024)
    Figure 68. Kruger Revenue Growth Rate in Recycled Materials Packaging Solutions Business (2019-2024)
    Figure 69. Ranpak Revenue Growth Rate in Recycled Materials Packaging Solutions Business (2019-2024)
    Figure 70. Biopac Revenue Growth Rate in Recycled Materials Packaging Solutions Business (2019-2024)
    Figure 71. Tetra Laval Revenue Growth Rate in Recycled Materials Packaging Solutions Business (2019-2024)
    Figure 72. International Paper Revenue Growth Rate in Recycled Materials Packaging Solutions Business (2019-2024)
    Figure 73. Smurfit Kappa Group Revenue Growth Rate in Recycled Materials Packaging Solutions Business (2019-2024)
    Figure 74. Bottom-up and Top-down Approaches for This Report
    Figure 75. Data Triangulation
    Figure 76. Key Executives Interviewed
SELECT A FORMAT
Added to Cart
Electronic (PDF)

$4900

This license allows only one user to access the PDF.
Electronic (PDF)

$7350

This license allows 1 - 5 user to access the PDF, license is suitable for small groups of 5 users working together
Electronic (PDF)

$9800

This license allows users/teams in a same Enterprise to use this report, various departments within an enterpise can use this report
Add to Cart
Buy Now (15% Discount)

OUR CUSTOMER

Accenture