1 Market Overview
1.1 Azithromycin Tablets Product Introduction
1.2 Global Azithromycin Tablets Market Size Forecast
1.2.1 Global Azithromycin Tablets Sales Value (2021–2032)
1.2.2 Global Azithromycin Tablets Sales Volume (2021–2032)
1.2.3 Global Azithromycin Tablets Sales Price (2021–2032)
1.3 Azithromycin Tablets Market Trends & Drivers
1.3.1 Azithromycin Tablets Industry Trends
1.3.2 Azithromycin Tablets Market Drivers & Opportunities
1.3.3 Azithromycin Tablets Market Challenges
1.3.4 Azithromycin Tablets Market Restraints
1.3.5 Impact of U.S. Tariffs
1.4 Assumptions and Limitations
1.5 Study Objectives
1.6 Years Considered
2 Competitive Analysis by Company
2.1 Global Azithromycin Tablets Players Revenue Ranking (2025)
2.2 Global Azithromycin Tablets Revenue by Company (2021–2026)
2.3 Global Azithromycin Tablets Sales Volume Ranking of Players (2025)
2.4 Global Azithromycin Tablets Sales Volume by Company (2021–2026)
2.5 Global Azithromycin Tablets Average Price by Company (2021–2026)
2.6 Key Manufacturers Azithromycin Tablets Manufacturing Base and Headquarters
2.7 Key Manufacturers Azithromycin Tablets Product Offerings
2.8 Key Manufacturers Start of Mass Production of Azithromycin Tablets
2.9 Azithromycin Tablets Market Competitive Analysis
2.9.1 Azithromycin Tablets Market Concentration Rate (2021–2026)
2.9.2 Global 5 and 10 Largest Manufacturers by Azithromycin Tablets Revenue in 2025
2.9.3 Global Companies by Tier (Tier 1, Tier 2, Tier 3), based on Azithromycin Tablets revenue, 2025
2.10 Mergers & Acquisitions and Expansion
3 Segmentation Azithromycin Tablets Market Classification
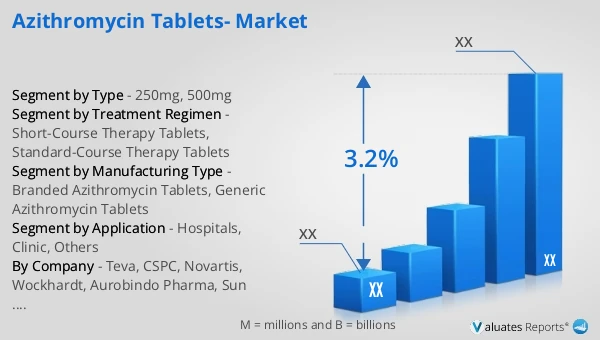
3.1 Introduction by Type
3.1.1 250mg
3.1.2 500mg
3.1.3 Global Azithromycin Tablets Sales Value by Type
3.1.3.1 Global Azithromycin Tablets Sales Value by Type (2021 vs 2025 vs 2032)
3.1.3.2 Global Azithromycin Tablets Sales Value, by Type (2021–2032)
3.1.3.3 Global Azithromycin Tablets Sales Value, by Type (%), 2021–2032
3.1.4 Global Azithromycin Tablets Sales Volume by Type
3.1.4.1 Global Azithromycin Tablets Sales Volume by Type (2021 vs 2025 vs 2032)
3.1.4.2 Global Azithromycin Tablets Sales Volume, by Type (2021–2032)
3.1.4.3 Global Azithromycin Tablets Sales Volume, by Type (%), 2021–2032
3.1.5 Global Azithromycin Tablets Average Price by Type (2021–2032)
3.2 Introduction by Treatment Regimen
3.2.1 Short-Course Therapy Tablets
3.2.2 Standard-Course Therapy Tablets
3.2.3 Global Azithromycin Tablets Sales Value by Treatment Regimen
3.2.3.1 Global Azithromycin Tablets Sales Value by Treatment Regimen (2021 vs 2025 vs 2032)
3.2.3.2 Global Azithromycin Tablets Sales Value, by Treatment Regimen (2021–2032)
3.2.3.3 Global Azithromycin Tablets Sales Value, by Treatment Regimen (%), 2021–2032
3.2.4 Global Azithromycin Tablets Sales Volume by Treatment Regimen
3.2.4.1 Global Azithromycin Tablets Sales Volume by Treatment Regimen (2021 vs 2025 vs 2032)
3.2.4.2 Global Azithromycin Tablets Sales Volume, by Treatment Regimen (2021–2032)
3.2.4.3 Global Azithromycin Tablets Sales Volume, by Treatment Regimen (%), 2021–2032
3.2.5 Global Azithromycin Tablets Average Price by Treatment Regimen (2021–2032)
3.3 Introduction by Manufacturing Type
3.3.1 Branded Azithromycin Tablets
3.3.2 Generic Azithromycin Tablets
3.3.3 Global Azithromycin Tablets Sales Value by Manufacturing Type
3.3.3.1 Global Azithromycin Tablets Sales Value by Manufacturing Type (2021 vs 2025 vs 2032)
3.3.3.2 Global Azithromycin Tablets Sales Value, by Manufacturing Type (2021–2032)
3.3.3.3 Global Azithromycin Tablets Sales Value, by Manufacturing Type (%), 2021–2032
3.3.4 Global Azithromycin Tablets Sales Volume by Manufacturing Type
3.3.4.1 Global Azithromycin Tablets Sales Volume by Manufacturing Type (2021 vs 2025 vs 2032)
3.3.4.2 Global Azithromycin Tablets Sales Volume, by Manufacturing Type (2021–2032)
3.3.4.3 Global Azithromycin Tablets Sales Volume, by Manufacturing Type (%), 2021–2032
3.3.5 Global Azithromycin Tablets Average Price by Manufacturing Type (2021–2032)
4 Segmentation by Application
4.1 Introduction by Application
4.1.1 Hospitals
4.1.2 Clinic
4.1.3 Others
4.2 Global Azithromycin Tablets Sales Value by Application
4.2.1 Global Azithromycin Tablets Sales Value by Application (2021 vs 2025 vs 2032)
4.2.2 Global Azithromycin Tablets Sales Value, by Application (2021–2032)
4.2.3 Global Azithromycin Tablets Sales Value, by Application (%), 2021–2032
4.3 Global Azithromycin Tablets Sales Volume by Application
4.3.1 Global Azithromycin Tablets Sales Volume by Application (2021 vs 2025 vs 2032)
4.3.2 Global Azithromycin Tablets Sales Volume, by Application (2021–2032)
4.3.3 Global Azithromycin Tablets Sales Volume, by Application (%), 2021–2032
4.4 Global Azithromycin Tablets Average Price by Application (2021–2032)
5 Segmentation by Region
5.1 Global Azithromycin Tablets Sales Value by Region
5.1.1 Global Azithromycin Tablets Sales Value by Region: 2021 vs 2025 vs 2032
5.1.2 Global Azithromycin Tablets Sales Value by Region (2021–2026)
5.1.3 Global Azithromycin Tablets Sales Value by Region (2027–2032)
5.1.4 Global Azithromycin Tablets Sales Value by Region (%), 2021–2032
5.2 Global Azithromycin Tablets Sales Volume by Region
5.2.1 Global Azithromycin Tablets Sales Volume by Region: 2021 vs 2025 vs 2032
5.2.2 Global Azithromycin Tablets Sales Volume by Region (2021–2026)
5.2.3 Global Azithromycin Tablets Sales Volume by Region (2027–2032)
5.2.4 Global Azithromycin Tablets Sales Volume by Region (%), 2021–2032
5.3 Global Azithromycin Tablets Average Price by Region (2021–2032)
5.4 North America
5.4.1 North America Azithromycin Tablets Sales Value, 2021–2032
5.4.2 North America Azithromycin Tablets Sales Value by Country (%), 2025 vs 2032
5.5 Europe
5.5.1 Europe Azithromycin Tablets Sales Value, 2021–2032
5.5.2 Europe Azithromycin Tablets Sales Value by Country (%), 2025 vs 2032
5.6 Asia Pacific
5.6.1 Asia Pacific Azithromycin Tablets Sales Value, 2021–2032
5.6.2 Asia Pacific Azithromycin Tablets Sales Value by Region (%), 2025 vs 2032
5.7 South America
5.7.1 South America Azithromycin Tablets Sales Value, 2021–2032
5.7.2 South America Azithromycin Tablets Sales Value by Country (%), 2025 vs 2032
5.8 Middle East & Africa
5.8.1 Middle East & Africa Azithromycin Tablets Sales Value, 2021–2032
5.8.2 Middle East & Africa Azithromycin Tablets Sales Value by Country (%), 2025 vs 2032
6 Segmentation by Key Countries/Regions
6.1 Key Countries/Regions Azithromycin Tablets Sales Value Growth Trends, 2021 vs 2025 vs 2032
6.2 Key Countries/Regions Azithromycin Tablets Sales Value and Sales Volume
6.2.1 Key Countries/Regions Azithromycin Tablets Sales Value, 2021–2032
6.2.2 Key Countries/Regions Azithromycin Tablets Sales Volume, 2021–2032
6.3 United States
6.3.1 United States Azithromycin Tablets Sales Value, 2021–2032
6.3.2 United States Azithromycin Tablets Sales Value by Type (%), 2025 vs 2032
6.3.3 United States Azithromycin Tablets Sales Value by Application, 2025 vs 2032
6.4 Europe
6.4.1 Europe Azithromycin Tablets Sales Value, 2021–2032
6.4.2 Europe Azithromycin Tablets Sales Value by Type (%), 2025 vs 2032
6.4.3 Europe Azithromycin Tablets Sales Value by Application, 2025 vs 2032
6.5 China
6.5.1 China Azithromycin Tablets Sales Value, 2021–2032
6.5.2 China Azithromycin Tablets Sales Value by Type (%), 2025 vs 2032
6.5.3 China Azithromycin Tablets Sales Value by Application, 2025 vs 2032
6.6 Japan
6.6.1 Japan Azithromycin Tablets Sales Value, 2021–2032
6.6.2 Japan Azithromycin Tablets Sales Value by Type (%), 2025 vs 2032
6.6.3 Japan Azithromycin Tablets Sales Value by Application, 2025 vs 2032
6.7 South Korea
6.7.1 South Korea Azithromycin Tablets Sales Value, 2021–2032
6.7.2 South Korea Azithromycin Tablets Sales Value by Type (%), 2025 vs 2032
6.7.3 South Korea Azithromycin Tablets Sales Value by Application, 2025 vs 2032
6.8 Southeast Asia
6.8.1 Southeast Asia Azithromycin Tablets Sales Value, 2021–2032
6.8.2 Southeast Asia Azithromycin Tablets Sales Value by Type (%), 2025 vs 2032
6.8.3 Southeast Asia Azithromycin Tablets Sales Value by Application, 2025 vs 2032
6.9 India
6.9.1 India Azithromycin Tablets Sales Value, 2021–2032
6.9.2 India Azithromycin Tablets Sales Value by Type (%), 2025 vs 2032
6.9.3 India Azithromycin Tablets Sales Value by Application, 2025 vs 2032
7 Company Profiles
7.1 Teva
7.1.1 Teva Company Information
7.1.2 Teva Introduction and Business Overview
7.1.3 Teva Azithromycin Tablets Sales, Revenue, Price and Gross Margin (2021–2026)
7.1.4 Teva Azithromycin Tablets Product Offerings
7.1.5 Teva Recent Developments
7.2 CSPC
7.2.1 CSPC Company Information
7.2.2 CSPC Introduction and Business Overview
7.2.3 CSPC Azithromycin Tablets Sales, Revenue, Price and Gross Margin (2021–2026)
7.2.4 CSPC Azithromycin Tablets Product Offerings
7.2.5 CSPC Recent Developments
7.3 Novartis
7.3.1 Novartis Company Information
7.3.2 Novartis Introduction and Business Overview
7.3.3 Novartis Azithromycin Tablets Sales, Revenue, Price and Gross Margin (2021–2026)
7.3.4 Novartis Azithromycin Tablets Product Offerings
7.3.5 Novartis Recent Developments
7.4 Wockhardt
7.4.1 Wockhardt Company Information
7.4.2 Wockhardt Introduction and Business Overview
7.4.3 Wockhardt Azithromycin Tablets Sales, Revenue, Price and Gross Margin (2021–2026)
7.4.4 Wockhardt Azithromycin Tablets Product Offerings
7.4.5 Wockhardt Recent Developments
7.5 Aurobindo Pharma
7.5.1 Aurobindo Pharma Company Information
7.5.2 Aurobindo Pharma Introduction and Business Overview
7.5.3 Aurobindo Pharma Azithromycin Tablets Sales, Revenue, Price and Gross Margin (2021–2026)
7.5.4 Aurobindo Pharma Azithromycin Tablets Product Offerings
7.5.5 Aurobindo Pharma Recent Developments
7.6 Sun Pharmaceutical Industries
7.6.1 Sun Pharmaceutical Industries Company Information
7.6.2 Sun Pharmaceutical Industries Introduction and Business Overview
7.6.3 Sun Pharmaceutical Industries Azithromycin Tablets Sales, Revenue, Price and Gross Margin (2021–2026)
7.6.4 Sun Pharmaceutical Industries Azithromycin Tablets Product Offerings
7.6.5 Sun Pharmaceutical Industries Recent Developments
7.7 Lupin Pharmaceuticals
7.7.1 Lupin Pharmaceuticals Company Information
7.7.2 Lupin Pharmaceuticals Introduction and Business Overview
7.7.3 Lupin Pharmaceuticals Azithromycin Tablets Sales, Revenue, Price and Gross Margin (2021–2026)
7.7.4 Lupin Pharmaceuticals Azithromycin Tablets Product Offerings
7.7.5 Lupin Pharmaceuticals Recent Developments
7.8 Lannett Company
7.8.1 Lannett Company Company Information
7.8.2 Lannett Company Introduction and Business Overview
7.8.3 Lannett Company Azithromycin Tablets Sales, Revenue, Price and Gross Margin (2021–2026)
7.8.4 Lannett Company Azithromycin Tablets Product Offerings
7.8.5 Lannett Company Recent Developments
7.9 Apotex
7.9.1 Apotex Company Information
7.9.2 Apotex Introduction and Business Overview
7.9.3 Apotex Azithromycin Tablets Sales, Revenue, Price and Gross Margin (2021–2026)
7.9.4 Apotex Azithromycin Tablets Product Offerings
7.9.5 Apotex Recent Developments
7.10 Pfizer
7.10.1 Pfizer Company Information
7.10.2 Pfizer Introduction and Business Overview
7.10.3 Pfizer Azithromycin Tablets Sales, Revenue, Price and Gross Margin (2021–2026)
7.10.4 Pfizer Azithromycin Tablets Product Offerings
7.10.5 Pfizer Recent Developments
7.11 Sinopharm
7.11.1 Sinopharm Company Information
7.11.2 Sinopharm Introduction and Business Overview
7.11.3 Sinopharm Azithromycin Tablets Sales, Revenue, Price and Gross Margin (2021–2026)
7.11.4 Sinopharm Azithromycin Tablets Product Offerings
7.11.5 Sinopharm Recent Developments
7.12 Yiling Pharmaceutical
7.12.1 Yiling Pharmaceutical Company Information
7.12.2 Yiling Pharmaceutical Introduction and Business Overview
7.12.3 Yiling Pharmaceutical Azithromycin Tablets Sales, Revenue, Price and Gross Margin (2021–2026)
7.12.4 Yiling Pharmaceutical Azithromycin Tablets Product Offerings
7.12.5 Yiling Pharmaceutical Recent Developments
7.13 Jilin Jingxin Pharmaceutical
7.13.1 Jilin Jingxin Pharmaceutical Company Information
7.13.2 Jilin Jingxin Pharmaceutical Introduction and Business Overview
7.13.3 Jilin Jingxin Pharmaceutical Azithromycin Tablets Sales, Revenue, Price and Gross Margin (2021–2026)
7.13.4 Jilin Jingxin Pharmaceutical Azithromycin Tablets Product Offerings
7.13.5 Jilin Jingxin Pharmaceutical Recent Developments
7.14 Yatal Pharma
7.14.1 Yatal Pharma Company Information
7.14.2 Yatal Pharma Introduction and Business Overview
7.14.3 Yatal Pharma Azithromycin Tablets Sales, Revenue, Price and Gross Margin (2021–2026)
7.14.4 Yatal Pharma Azithromycin Tablets Product Offerings
7.14.5 Yatal Pharma Recent Developments
7.15 Sichuan Kelun Pharma
7.15.1 Sichuan Kelun Pharma Company Information
7.15.2 Sichuan Kelun Pharma Introduction and Business Overview
7.15.3 Sichuan Kelun Pharma Azithromycin Tablets Sales, Revenue, Price and Gross Margin (2021–2026)
7.15.4 Sichuan Kelun Pharma Azithromycin Tablets Product Offerings
7.15.5 Sichuan Kelun Pharma Recent Developments
7.16 Furen Medicines
7.16.1 Furen Medicines Company Information
7.16.2 Furen Medicines Introduction and Business Overview
7.16.3 Furen Medicines Azithromycin Tablets Sales, Revenue, Price and Gross Margin (2021–2026)
7.16.4 Furen Medicines Azithromycin Tablets Product Offerings
7.16.5 Furen Medicines Recent Developments
7.17 Sandoz
7.17.1 Sandoz Company Information
7.17.2 Sandoz Introduction and Business Overview
7.17.3 Sandoz Azithromycin Tablets Sales, Revenue, Price and Gross Margin (2021–2026)
7.17.4 Sandoz Azithromycin Tablets Product Offerings
7.17.5 Sandoz Recent Developments
7.18 Alembic Pharmaceuticals
7.18.1 Alembic Pharmaceuticals Company Information
7.18.2 Alembic Pharmaceuticals Introduction and Business Overview
7.18.3 Alembic Pharmaceuticals Azithromycin Tablets Sales, Revenue, Price and Gross Margin (2021–2026)
7.18.4 Alembic Pharmaceuticals Azithromycin Tablets Product Offerings
7.18.5 Alembic Pharmaceuticals Recent Developments
8 Industry Chain Analysis
8.1 Azithromycin Tablets Industrial Chain
8.2 Azithromycin Tablets Upstream Analysis
8.2.1 Key Raw Materials
8.2.2 Key Suppliers of Raw Materials
8.2.3 Manufacturing Cost Structure
8.3 Midstream Analysis
8.4 Downstream Analysis (Customer Analysis)
8.5 Sales Model and Sales Channelss
8.5.1 Azithromycin Tablets Sales Model
8.5.2 Sales Channels
8.5.3 Azithromycin Tablets Distributors
9 Research Findings and Conclusion
10 Appendix
10.1 Research Methodology
10.1.1 Methodology/Research Approach
10.1.1.1 Research Programs/Design
10.1.1.2 Market Size Estimation
10.1.1.3 Market Breakdown and Data Triangulation
10.1.2 Data Source
10.1.2.1 Secondary Sources
10.1.2.2 Primary Sources
10.2 Author Details
10.3 Disclaimer