List of Tables
Table 1. Global Stem Cell Therapy for Premature Ovarian Failure Market Size Growth Rate by Type (2026-2032) & (US$ Million)
Table 2. Key Players of Mesenchymal Stem Cells
Table 3. Key Players of Extra-embryonic Stem Cells
Table 4. Key Players of Others
Table 5. Global Stem Cell Therapy for Premature Ovarian Failure Market Size Growth by Application (2026-2032) & (US$ Million)
Table 6. Global Stem Cell Therapy for Premature Ovarian Failure Market Size by Region (2026-2032) & (US$ Million)
Table 7. Global Stem Cell Therapy for Premature Ovarian Failure Market Size by Region (2026-2032) & (US$ Million)
Table 8. Global Stem Cell Therapy for Premature Ovarian Failure Market Share by Region (2026-2032)
Table 9. Market Top Trends
Table 10. Market Use Cases
Table 11. Global Stem Cell Therapy for Premature Ovarian Failure Revenue by Players (2026 & 2032) & (US$ Million)
Table 12. Global Stem Cell Therapy for Premature Ovarian Failure Market Share by Players (2026 & 2032)
Table 13. Key Players Headquarters and Area Served
Table 14. Key Players Stem Cell Therapy for Premature Ovarian Failure Product/Solution/Service
Table 15. Date of Enter into Stem Cell Therapy for Premature Ovarian Failure Market
Table 16. Mergers & Acquisitions, Expansion Plans
Table 17. Global Stem Cell Therapy for Premature Ovarian Failure Market Size by Type (2026-2032) & (US$ Million)
Table 18. Global Stem Cell Therapy for Premature Ovarian Failure Market Size Share by Type (2026-2032)
Table 19. Global Stem Cell Therapy for Premature Ovarian Failure Market Size by Application (2026-2032) & (US$ Million)
Table 20. Global Stem Cell Therapy for Premature Ovarian Failure Market Size Share by Application (2026-2032)
Table 21. North America Key Players Stem Cell Therapy for Premature Ovarian Failure Revenue (2026 & 2032) & (US$ Million)
Table 22. North America Key Players Stem Cell Therapy for Premature Ovarian Failure Market Share (2026 & 2032)
Table 23. North America Stem Cell Therapy for Premature Ovarian Failure Market Size by Type (2026-2032) & (US$ Million)
Table 24. North America Stem Cell Therapy for Premature Ovarian Failure Market Share by Type (2026-2032)
Table 25. North America Stem Cell Therapy for Premature Ovarian Failure Market Size by Application (2026-2032) & (US$ Million)
Table 26. North America Stem Cell Therapy for Premature Ovarian Failure Market Share by Application (2026-2032)
Table 27. Europe Key Players Stem Cell Therapy for Premature Ovarian Failure Revenue (2026 & 2032) & (US$ Million)
Table 28. Europe Key Players Stem Cell Therapy for Premature Ovarian Failure Market Share (2026 & 2032)
Table 29. Europe Stem Cell Therapy for Premature Ovarian Failure Market Size by Type (2026-2032) & (US$ Million)
Table 30. Europe Stem Cell Therapy for Premature Ovarian Failure Market Share by Type (2026-2032)
Table 31. Europe Stem Cell Therapy for Premature Ovarian Failure Market Size by Application (2026-2032) & (US$ Million)
Table 32. Europe Stem Cell Therapy for Premature Ovarian Failure Market Share by Application (2026-2032)
Table 33. Asia-Pacific Key Players Stem Cell Therapy for Premature Ovarian Failure Revenue (2026 & 2032) & (US$ Million)
Table 34. Asia-Pacific Key Players Stem Cell Therapy for Premature Ovarian Failure Market Share (2026 & 2032)
Table 35. Asia-Pacific Stem Cell Therapy for Premature Ovarian Failure Market Size by Type (2026-2032) & (US$ Million)
Table 36. Asia-Pacific Stem Cell Therapy for Premature Ovarian Failure Market Share by Type (2026-2032)
Table 37. Asia-Pacific Stem Cell Therapy for Premature Ovarian Failure Market Size by Application (2026-2032) & (US$ Million)
Table 38. Asia-Pacific Stem Cell Therapy for Premature Ovarian Failure Market Share by Application (2026-2032)
Table 39. Key Players in Latin America
Table 40. Key Players in Middle East & Africa
Table 41. OvoSkill Company Details
Table 42. OvoSkill Description and Business Overview
Table 43. OvoSkill Stem Cell Therapy for Premature Ovarian Failure Product
Table 44. OvoSkill Revenue in Stem Cell Therapy for Premature Ovarian Failure Business: 2026 & 2032
Table 45. OvoSkill Recent Development
Table 46. Stem Cell Therapy for Premature Ovarian Failure Market Trends
Table 47. Stem Cell Therapy for Premature Ovarian Failure Market Drivers
Table 48. Stem Cell Therapy for Premature Ovarian Failure Market Challenges
Table 49. Stem Cell Therapy for Premature Ovarian Failure Market Restraints
Table 50. Research Programs/Design for This Report
Table 51. Key Data Information from Secondary Sources
Table 52. Key Data Information from Primary Sources
List of Figures
Figure 1. Global Stem Cell Therapy for Premature Ovarian Failure Market Share by Type in 2026 & 2032
Figure 2. Mesenchymal Stem Cells Features
Figure 3. Extra-embryonic Stem Cells Features
Figure 4. Others Features
Figure 5. Global Stem Cell Therapy for Premature Ovarian Failure Market Share by Application in 2026 & 2032
Figure 6. Less than 20 Years Old Case Studies
Figure 7. 20 to 30 Years Old Case Studies
Figure 8. 30 to 45 Years Old Case Studies
Figure 9. 45 Years Old and Older Case Studies
Figure 10. Stem Cell Therapy for Premature Ovarian Failure Report Years Considered
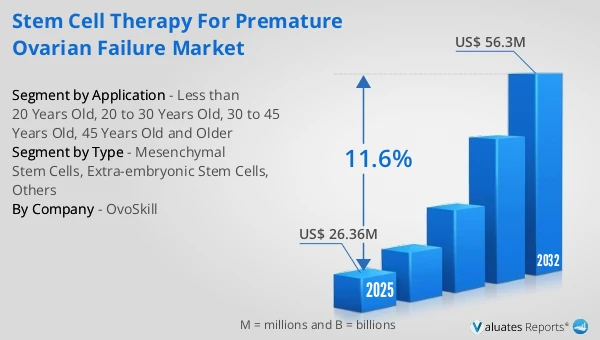
Figure 11. Global Stem Cell Therapy for Premature Ovarian Failure Market Size and Growth Rate 2026-2032 (US$ Million)
Figure 12. Global Stem Cell Therapy for Premature Ovarian Failure Market Share by Region (2026-2032)
Figure 13. Global Stem Cell Therapy for Premature Ovarian Failure Market Size Market Share by Type (2026-2032)
Figure 14. North America Stem Cell Therapy for Premature Ovarian Failure Market Size 2026-2032 (US$ Million)
Figure 15. Europe Stem Cell Therapy for Premature Ovarian Failure Market Size 2026-2032 (US$ Million)
Figure 16. Asia-Pacific Stem Cell Therapy for Premature Ovarian Failure Market Size 2026-2032 (US$ Million)
Figure 17. Stem Cell Therapy for Premature Ovarian Failure Market Size in Latin America (2026-2032) & (US$ Million)
Figure 18. Stem Cell Therapy for Premature Ovarian Failure Market Size in Middle East & Africa (2026-2032) & (US$ Million)
Figure 19. Bottom-up and Top-down Approaches for This Report
Figure 20. Data Triangulation
Figure 21. Key Executives Interviewed