List of Tables
Table 1. Carbon Capture Market Trends
Table 2. Carbon Capture Market Drivers & Opportunities
Table 3. Carbon Capture Market Challenges
Table 4. Carbon Capture Market Restraints
Table 5. Global Carbon Capture Revenue by Company (US$ Million), 2021–2026
Table 6. Global Carbon Capture Revenue Market Share by Company (2021–2026)
Table 7. Key Companies’ R&D and Operations Footprint and Headquarters
Table 8. Key Companies Carbon Capture Product Type
Table 9. Key Companies General Availability (GA) Timeline for Carbon Capture
Table 10. Global Carbon Capture Companies Market Concentration Ratio (CR5 and HHI)
Table 11. Global Companies by Tier (Tier 1, Tier 2, Tier 3), based on Carbon Capture revenue, 2025
Table 12. Mergers & Acquisitions and Expansion Plans
Table 13. Global Carbon Capture Sales Value by Type: 2021 vs 2025 vs 2032 (US$ Million)
Table 14. Global Carbon Capture Sales Value by Type (US$ Million), 2021–2026
Table 15. Global Carbon Capture Sales Value by Type (US$ Million), 2027–2032
Table 16. Global Carbon Capture Sales Market Share in Value by Type (2021–2026)
Table 17. Global Carbon Capture Sales Market Share in Value by Type (2027–2032)
Table 18. Global Carbon Capture Sales Value by Capture Technology: 2021 vs 2025 vs 2032 (US$ Million)
Table 19. Global Carbon Capture Sales Value by Capture Technology (US$ Million), 2021–2026
Table 20. Global Carbon Capture Sales Value by Capture Technology (US$ Million), 2027–2032
Table 21. Global Carbon Capture Sales Market Share in Value by Capture Technology (2021–2026)
Table 22. Global Carbon Capture Sales Market Share in Value by Capture Technology (2027–2032)
Table 23. Global Carbon Capture Sales Value by Capture Capacity: 2021 vs 2025 vs 2032 (US$ Million)
Table 24. Global Carbon Capture Sales Value by Capture Capacity (US$ Million), 2021–2026
Table 25. Global Carbon Capture Sales Value by Capture Capacity (US$ Million), 2027–2032
Table 26. Global Carbon Capture Sales Market Share in Value by Capture Capacity (2021–2026)
Table 27. Global Carbon Capture Sales Market Share in Value by Capture Capacity (2027–2032)
Table 28. Global Carbon Capture Sales Value by Application: 2021 vs 2025 vs 2032 (US$ Million)
Table 29. Global Carbon Capture Sales Value by Application (US$ Million), 2021–2026
Table 30. Global Carbon Capture Sales Value by Application (US$ Million), 2027–2032
Table 31. Global Carbon Capture Sales Market Share in Value by Application (2021–2026)
Table 32. Global Carbon Capture Sales Market Share in Value by Application (2027–2032)
Table 33. Global Carbon Capture Sales Value by Region, (US$ Million), 2021 vs 2025 vs 2032
Table 34. Global Carbon Capture Sales Value by Region (US$ Million), 2021–2026
Table 35. Global Carbon Capture Sales Value by Region (US$ Million), 2027–2032
Table 36. Global Carbon Capture Sales Value by Region (%), 2021–2026
Table 37. Global Carbon Capture Sales Value by Region (%), 2027–2032
Table 38. Key Countries/Regions Carbon Capture Sales Value Growth Trends, (US$ Million): 2021 vs 2025 vs 2032
Table 39. Key Countries/Regions Carbon Capture Sales Value, (US$ Million), 2021–2026
Table 40. Key Countries/Regions Carbon Capture Sales Value, (US$ Million), 2027–2032
Table 41. Exxon Mobil Basic Information List
Table 42. Exxon Mobil Description and Business Overview
Table 43. Exxon Mobil Carbon Capture Products, Services, and Solutions
Table 44. Revenue (US$ Million) in Carbon Capture Business of Exxon Mobil (2021–2026)
Table 45. Exxon Mobil Recent Developments
Table 46. SLB Basic Information List
Table 47. SLB Description and Business Overview
Table 48. SLB Carbon Capture Products, Services, and Solutions
Table 49. Revenue (US$ Million) in Carbon Capture Business of SLB (2021–2026)
Table 50. SLB Recent Developments
Table 51. Linde PLC Basic Information List
Table 52. Linde PLC Description and Business Overview
Table 53. Linde PLC Carbon Capture Products, Services, and Solutions
Table 54. Revenue (US$ Million) in Carbon Capture Business of Linde PLC (2021–2026)
Table 55. Linde PLC Recent Developments
Table 56. Mitsubishi Basic Information List
Table 57. Mitsubishi Description and Business Overview
Table 58. Mitsubishi Carbon Capture Products, Services, and Solutions
Table 59. Revenue (US$ Million) in Carbon Capture Business of Mitsubishi (2021–2026)
Table 60. Mitsubishi Recent Developments
Table 61. Huaneng Basic Information List
Table 62. Huaneng Description and Business Overview
Table 63. Huaneng Carbon Capture Products, Services, and Solutions
Table 64. Revenue (US$ Million) in Carbon Capture Business of Huaneng (2021–2026)
Table 65. Huaneng Recent Developments
Table 66. BASF Basic Information List
Table 67. BASF Description and Business Overview
Table 68. BASF Carbon Capture Products, Services, and Solutions
Table 69. Revenue (US$ Million) in Carbon Capture Business of BASF (2021–2026)
Table 70. BASF Recent Developments
Table 71. Halliburton Basic Information List
Table 72. Halliburton Description and Business Overview
Table 73. Halliburton Carbon Capture Products, Services, and Solutions
Table 74. Revenue (US$ Million) in Carbon Capture Business of Halliburton (2021–2026)
Table 75. Halliburton Recent Developments
Table 76. Siemens AG Basic Information List
Table 77. Siemens AG Description and Business Overview
Table 78. Siemens AG Carbon Capture Products, Services, and Solutions
Table 79. Revenue (US$ Million) in Carbon Capture Business of Siemens AG (2021–2026)
Table 80. Siemens AG Recent Developments
Table 81. General Electric Basic Information List
Table 82. General Electric Description and Business Overview
Table 83. General Electric Carbon Capture Products, Services, and Solutions
Table 84. Revenue (US$ Million) in Carbon Capture Business of General Electric (2021–2026)
Table 85. General Electric Recent Developments
Table 86. Honeywell UOP Basic Information List
Table 87. Honeywell UOP Description and Business Overview
Table 88. Honeywell UOP Carbon Capture Products, Services, and Solutions
Table 89. Revenue (US$ Million) in Carbon Capture Business of Honeywell UOP (2021–2026)
Table 90. Honeywell UOP Recent Developments
Table 91. Carbonfree Basic Information List
Table 92. Carbonfree Description and Business Overview
Table 93. Carbonfree Carbon Capture Products, Services, and Solutions
Table 94. Revenue (US$ Million) in Carbon Capture Business of Carbonfree (2021–2026)
Table 95. Carbonfree Recent Developments
Table 96. Shell Basic Information List
Table 97. Shell Description and Business Overview
Table 98. Shell Carbon Capture Products, Services, and Solutions
Table 99. Revenue (US$ Million) in Carbon Capture Business of Shell (2021–2026)
Table 100. Shell Recent Developments
Table 101. JX Nippon (ENEOS) Basic Information List
Table 102. JX Nippon (ENEOS) Description and Business Overview
Table 103. JX Nippon (ENEOS) Carbon Capture Products, Services, and Solutions
Table 104. Revenue (US$ Million) in Carbon Capture Business of JX Nippon (ENEOS) (2021–2026)
Table 105. JX Nippon (ENEOS) Recent Developments
Table 106. Sulzer Basic Information List
Table 107. Sulzer Description and Business Overview
Table 108. Sulzer Carbon Capture Products, Services, and Solutions
Table 109. Revenue (US$ Million) in Carbon Capture Business of Sulzer (2021–2026)
Table 110. Sulzer Recent Developments
Table 111. Equinor Basic Information List
Table 112. Equinor Description and Business Overview
Table 113. Equinor Carbon Capture Products, Services, and Solutions
Table 114. Revenue (US$ Million) in Carbon Capture Business of Equinor (2021–2026)
Table 115. Equinor Recent Developments
Table 116. Sinopec Basic Information List
Table 117. Sinopec Description and Business Overview
Table 118. Sinopec Carbon Capture Products, Services, and Solutions
Table 119. Revenue (US$ Million) in Carbon Capture Business of Sinopec (2021–2026)
Table 120. Sinopec Recent Developments
Table 121. Fluor Corporation Basic Information List
Table 122. Fluor Corporation Description and Business Overview
Table 123. Fluor Corporation Carbon Capture Products, Services, and Solutions
Table 124. Revenue (US$ Million) in Carbon Capture Business of Fluor Corporation (2021–2026)
Table 125. Fluor Corporation Recent Developments
Table 126. Revenue (US$ Million) in Carbon Capture Business of Company 40 (2021–2026)
Table 127. Company 40 Recent Developments
Table 128. Key Raw Materials Lists
Table 129. Key Suppliers of Raw Materials Lists
Table 130. Carbon Capture Downstream Customers
Table 131. Carbon Capture Distributors List
Table 132. Research Programs/Design for This Report
Table 133. Key Data Information from Secondary Sources
Table 134. Key Data Information from Primary Sources
List of Figures
Figure 1. Carbon Capture Product Picture
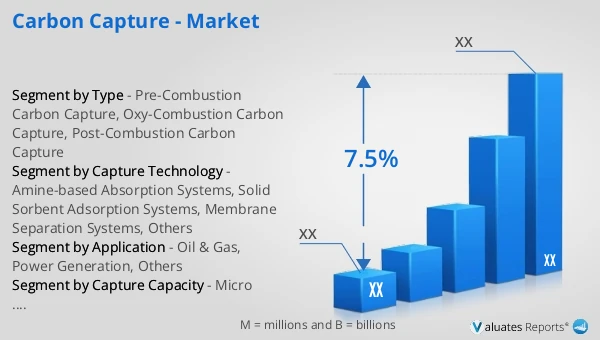
Figure 2. Global Carbon Capture Sales Value, 2021 vs 2025 vs 2032 (US$ Million)
Figure 3. Global Carbon Capture Sales Value (US$ Million), 2021–2032
Figure 4. Carbon Capture Report Years Considered
Figure 5. Global Carbon Capture Players Revenue Ranking (US$ Million), 2025
Figure 6. The 5 and 10 Largest Companies in the World: Market Share by Carbon Capture Revenue in 2025
Figure 7. Carbon Capture Market Share by Company Type (Tier 1, Tier 2, and Tier 3): 2021 vs 2025
Figure 8. Pre-Combustion Carbon Capture Picture
Figure 9. Oxy-Combustion Carbon Capture Picture
Figure 10. Post-Combustion Carbon Capture Picture
Figure 11. Global Carbon Capture Sales Value by Type (US$ Million), 2021 vs 2025 vs 2032
Figure 12. Global Carbon Capture Sales Value Market Share by Type, 2025 & 2032
Figure 13. Amine-based Absorption Systems Picture
Figure 14. Solid Sorbent Adsorption Systems Picture
Figure 15. Membrane Separation Systems Picture
Figure 16. Others Picture
Figure 17. Global Carbon Capture Sales Value by Capture Technology (US$ Million), 2021 vs 2025 vs 2032
Figure 18. Global Carbon Capture Sales Value Market Share by Capture Technology, 2025 & 2032
Figure 19. Micro Systems: < 100 tCO₂/year Picture
Figure 20. Small Systems: 100–1,000 tCO₂/year Picture
Figure 21. Medium-compact Systems: 1,000–10,000 tCO₂/year Picture
Figure 22. Large-scale Systems: >10,000 tCO₂/year Picture
Figure 23. Global Carbon Capture Sales Value by Capture Capacity (US$ Million), 2021 vs 2025 vs 2032
Figure 24. Global Carbon Capture Sales Value Market Share by Capture Capacity, 2025 & 2032
Figure 25. Product Picture of Oil & Gas
Figure 26. Product Picture of Power Generation
Figure 27. Product Picture of Others
Figure 28. Global Carbon Capture Sales Value by Application (US$ Million), 2021 vs 2025 vs 2032
Figure 29. Global Carbon Capture Sales Value Market Share by Application, 2025 & 2032
Figure 30. North America Carbon Capture Sales Value (US$ Million), 2021–2032
Figure 31. North America Carbon Capture Sales Value by Country (%), 2025 vs 2032
Figure 32. Europe Carbon Capture Sales Value (US$ Million), 2021–2032
Figure 33. Europe Carbon Capture Sales Value by Country (%), 2025 vs 2032
Figure 34. Asia Pacific Carbon Capture Sales Value (US$ Million), 2021–2032
Figure 35. Asia Pacific Carbon Capture Sales Value by Subregion (%), 2025 vs 2032
Figure 36. South America Carbon Capture Sales Value (US$ Million), 2021–2032
Figure 37. South America Carbon Capture Sales Value by Country (%), 2025 vs 2032
Figure 38. Middle East & Africa Carbon Capture Sales Value (US$ Million), 2021–2032
Figure 39. Middle East & Africa Carbon Capture Sales Value by Country (%), 2025 vs 2032
Figure 40. Key Countries/Regions Carbon Capture Sales Value (%), 2021–2032
Figure 41. United States Carbon Capture Sales Value (US$ Million), 2021–2032
Figure 42. United States Carbon Capture Sales Value by Type (%), 2025 vs 2032
Figure 43. United States Carbon Capture Sales Value by Application (%), 2025 vs 2032
Figure 44. Europe Carbon Capture Sales Value (US$ Million), 2021–2032
Figure 45. Europe Carbon Capture Sales Value by Type (%), 2025 vs 2032
Figure 46. Europe Carbon Capture Sales Value by Application (%), 2025 vs 2032
Figure 47. China Carbon Capture Sales Value (US$ Million), 2021–2032
Figure 48. China Carbon Capture Sales Value by Type (%), 2025 vs 2032
Figure 49. China Carbon Capture Sales Value by Application (%), 2025 vs 2032
Figure 50. Japan Carbon Capture Sales Value (US$ Million), 2021–2032
Figure 51. Japan Carbon Capture Sales Value by Type (%), 2025 vs 2032
Figure 52. Japan Carbon Capture Sales Value by Application (%), 2025 vs 2032
Figure 53. South Korea Carbon Capture Sales Value (US$ Million), 2021–2032
Figure 54. South Korea Carbon Capture Sales Value by Type (%), 2025 vs 2032
Figure 55. South Korea Carbon Capture Sales Value by Application (%), 2025 vs 2032
Figure 56. Southeast Asia Carbon Capture Sales Value (US$ Million), 2021–2032
Figure 57. Southeast Asia Carbon Capture Sales Value by Type (%), 2025 vs 2032
Figure 58. Southeast Asia Carbon Capture Sales Value by Application (%), 2025 vs 2032
Figure 59. India Carbon Capture Sales Value (US$ Million), 2021–2032
Figure 60. India Carbon Capture Sales Value by Type (%), 2025 vs 2032
Figure 61. India Carbon Capture Sales Value by Application (%), 2025 vs 2032
Figure 62. Carbon Capture Value Chain
Figure 63. Carbon Capture Cost Structure
Figure 64. Channels of Distribution (Direct Sales, and Distribution)
Figure 65. Bottom-up and Top-down Approaches for This Report
Figure 66. Data Triangulation
Figure 67. Key Executives Interviewed