List of Tables
Table 1. Commercial Washing Machines CAGR in Value, India VS Global, 2018 VS 2022 VS 2029
Table 2. Commercial Washing Machines Market Trends
Table 3. Commercial Washing Machines Market Drivers
Table 4. Commercial Washing Machines Market Challenges
Table 5. Commercial Washing Machines Market Restraints
Table 6. Global Commercial Washing Machines Sales Growth Rate (CAGR) by Type: 2018 VS 2022 VS 2029 (US$ Million)
Table 7. India Commercial Washing Machines Sales Growth Rate (CAGR) by Type: 2018 VS 2022 VS 2029 (US$ Million)
Table 8. Global Commercial Washing Machines Sales Growth Rate (CAGR) by Application: 2018 VS 2022 VS 2029 (US$ Million)
Table 9. India Commercial Washing Machines Sales Growth Rate (CAGR) by Application: 2018 VS 2022 VS 2029 (US$ Million)
Table 10. Global Key Manufacturers of Commercial Washing Machines, Ranked by Revenue (2022) & (US$ Million)
Table 11. Global Commercial Washing Machines Revenue by Manufacturer, (US$ Million), 2018-2023
Table 12. Global Commercial Washing Machines Revenue Share by Manufacturer, 2018-2023
Table 13. Global Commercial Washing Machines Sales by Manufacturer, (Units), 2018-2023
Table 14. Global Commercial Washing Machines Sales Share by Manufacturer, 2018-2023
Table 15. Global Commercial Washing Machines Price by Manufacturer (2018-2023) & (US$/Unit)
Table 16. Global Commercial Washing Machines Manufacturers Market Concentration Ratio (CR5 and HHI)
Table 17. Global Commercial Washing Machines by Company Type (Tier 1, Tier 2, and Tier 3) & (based on the Revenue in Commercial Washing Machines as of 2022)
Table 18. Global Key Manufacturers of Commercial Washing Machines, Manufacturing Base Distribution and Headquarters
Table 19. Global Key Manufacturers of Commercial Washing Machines, Product Offered and Application
Table 20. Global Key Manufacturers of Commercial Washing Machines, Date of Enter into This Industry
Table 21. Manufacturers Mergers & Acquisitions, Expansion Plans
Table 22. Key Players of Commercial Washing Machines in India, Ranked by Revenue (2022) & (US$ million)
Table 23. India Commercial Washing Machines Revenue by Players, (US$ Million), (2018-2023)
Table 24. India Commercial Washing Machines Revenue Share by Players, (2018-2023)
Table 25. India Commercial Washing Machines Sales by Players, (Units), (2018-2023)
Table 26. India Commercial Washing Machines Sales Share by Players, (2018-2023)
Table 27. Global Commercial Washing Machines Market Size Growth Rate (CAGR) by Region (US$ Million): 2018 VS 2022 VS 2029
Table 28. Global Commercial Washing Machines Sales in Volume by Region (2018-2023) & (Units)
Table 29. Global Commercial Washing Machines Sales in Volume Forecast by Region (2024-2029) & (Units)
Table 30. Global Commercial Washing Machines Sales in Value by Region (2018-2023) & (US$ Million)
Table 31. Global Commercial Washing Machines Sales in Value Forecast by Region (2024-2029) & (US$ Million)
Table 32. Americas Commercial Washing Machines Market Size Growth Rate (CAGR) by Country (US$ Million): 2018 VS 2022 VS 2029
Table 33. Americas Commercial Washing Machines Sales in Value by Country (2018-2023) & (US$ Million)
Table 34. Americas Commercial Washing Machines Sales in Value by Country (2024-2029) & (US$ Million)
Table 35. Americas Commercial Washing Machines Sales in Volume by Country (2018-2023) & (Units)
Table 36. Americas Commercial Washing Machines Sales in Volume by Country (2024-2029) & (Units)
Table 37. EMEA Commercial Washing Machines Market Size Growth Rate (CAGR) by Country (US$ Million): 2018 VS 2022 VS 2029
Table 38. EMEA Commercial Washing Machines Sales in Value by Country (2018-2023) & (US$ Million)
Table 39. EMEA Commercial Washing Machines Sales in Value by Country (2024-2029) & (US$ Million)
Table 40. EMEA Commercial Washing Machines Sales in Volume by Country (2018-2023) & (Units)
Table 41. EMEA Commercial Washing Machines Sales in Volume by Country (2024-2029) & (Units)
Table 42. APAC Commercial Washing Machines Market Size Growth Rate (CAGR) by Country (US$ Million): 2018 VS 2022 VS 2029
Table 43. APAC Commercial Washing Machines Sales in Value by Country (2018-2023) & (US$ Million)
Table 44. APAC Commercial Washing Machines Sales in Value by Country (2024-2029) & (US$ Million)
Table 45. APAC Commercial Washing Machines Sales in Volume by Country (2018-2023) & (Units)
Table 46. APAC Commercial Washing Machines Sales in Volume by Country (2024-2029) & (Units)
Table 47. Alliance Laundry System Company Information
Table 48. Alliance Laundry System Description and Business Overview
Table 49. Alliance Laundry System Commercial Washing Machines Sales (Units), Revenue (US$ Million), Price (US$/Unit) and Gross Margin (2018-2023)
Table 50. Alliance Laundry System Commercial Washing Machines Product
Table 51. Alliance Laundry System Recent Development
Table 52. Whirlpool Company Information
Table 53. Whirlpool Description and Business Overview
Table 54. Whirlpool Commercial Washing Machines Sales (Units), Revenue (US$ Million), Price (US$/Unit) and Gross Margin (2018-2023)
Table 55. Whirlpool Commercial Washing Machines Product
Table 56. Whirlpool Recent Development
Table 57. Miele Company Information
Table 58. Miele Description and Business Overview
Table 59. Miele Commercial Washing Machines Sales (Units), Revenue (US$ Million), Price (US$/Unit) and Gross Margin (2018-2023)
Table 60. Miele Commercial Washing Machines Product
Table 61. Miele Recent Development
Table 62. Electrolux Professional Company Information
Table 63. Electrolux Professional Description and Business Overview
Table 64. Electrolux Professional Commercial Washing Machines Sales (Units), Revenue (US$ Million), Price (US$/Unit) and Gross Margin (2018-2023)
Table 65. Electrolux Professional Commercial Washing Machines Product
Table 66. Electrolux Professional Recent Development
Table 67. Herbert Kannegiesser GmbH Company Information
Table 68. Herbert Kannegiesser GmbH Description and Business Overview
Table 69. Herbert Kannegiesser GmbH Commercial Washing Machines Sales (Units), Revenue (US$ Million), Price (US$/Unit) and Gross Margin (2018-2023)
Table 70. Herbert Kannegiesser GmbH Commercial Washing Machines Product
Table 71. Herbert Kannegiesser GmbH Recent Development
Table 72. Jensen Group Company Information
Table 73. Jensen Group Description and Business Overview
Table 74. Jensen Group Commercial Washing Machines Sales (Units), Revenue (US$ Million), Price (US$/Unit) and Gross Margin (2018-2023)
Table 75. Jensen Group Commercial Washing Machines Product
Table 76. Jensen Group Recent Development
Table 77. Pellerin Milnor Corporation Company Information
Table 78. Pellerin Milnor Corporation Description and Business Overview
Table 79. Pellerin Milnor Corporation Commercial Washing Machines Sales (Units), Revenue (US$ Million), Price (US$/Unit) and Gross Margin (2018-2023)
Table 80. Pellerin Milnor Corporation Commercial Washing Machines Product
Table 81. Pellerin Milnor Corporation Recent Development
Table 82. LG Commercial Company Information
Table 83. LG Commercial Description and Business Overview
Table 84. LG Commercial Commercial Washing Machines Sales (Units), Revenue (US$ Million), Price (US$/Unit) and Gross Margin (2018-2023)
Table 85. LG Commercial Commercial Washing Machines Product
Table 86. LG Commercial Recent Development
Table 87. Girbau Company Information
Table 88. Girbau Description and Business Overview
Table 89. Girbau Commercial Washing Machines Sales (Units), Revenue (US$ Million), Price (US$/Unit) and Gross Margin (2018-2023)
Table 90. Girbau Commercial Washing Machines Product
Table 91. Girbau Recent Development
Table 92. Dexter Laundry Company Information
Table 93. Dexter Laundry Description and Business Overview
Table 94. Dexter Laundry Commercial Washing Machines Sales (Units), Revenue (US$ Million), Price (US$/Unit) and Gross Margin (2018-2023)
Table 95. Dexter Laundry Commercial Washing Machines Product
Table 96. Dexter Laundry Recent Development
Table 97. Jiangsu Sea-Lion Machinery Company Information
Table 98. Jiangsu Sea-Lion Machinery Description and Business Overview
Table 99. Jiangsu Sea-Lion Machinery Commercial Washing Machines Sales (Units), Revenue (US$ Million), Price (US$/Unit) and Gross Margin (2018-2023)
Table 100. Jiangsu Sea-Lion Machinery Commercial Washing Machines Product
Table 101. Jiangsu Sea-Lion Machinery Recent Development
Table 102. ONNERA Group Company Information
Table 103. ONNERA Group Description and Business Overview
Table 104. ONNERA Group Commercial Washing Machines Sales (Units), Revenue (US$ Million), Price (US$/Unit) and Gross Margin (2018-2023)
Table 105. ONNERA Group Commercial Washing Machines Product
Table 106. ONNERA Group Recent Development
Table 107. Shanghai Sailstar Machinery Company Information
Table 108. Shanghai Sailstar Machinery Description and Business Overview
Table 109. Shanghai Sailstar Machinery Commercial Washing Machines Sales (Units), Revenue (US$ Million), Price (US$/Unit) and Gross Margin (2018-2023)
Table 110. Shanghai Sailstar Machinery Commercial Washing Machines Product
Table 111. Shanghai Sailstar Machinery Recent Development
Table 112. Grandimpianti Company Information
Table 113. Grandimpianti Description and Business Overview
Table 114. Grandimpianti Commercial Washing Machines Sales (Units), Revenue (US$ Million), Price (US$/Unit) and Gross Margin (2018-2023)
Table 115. Grandimpianti Commercial Washing Machines Product
Table 116. Grandimpianti Recent Development
Table 117. Schulthess Maschinen Company Information
Table 118. Schulthess Maschinen Description and Business Overview
Table 119. Schulthess Maschinen Commercial Washing Machines Sales (Units), Revenue (US$ Million), Price (US$/Unit) and Gross Margin (2018-2023)
Table 120. Schulthess Maschinen Commercial Washing Machines Product
Table 121. Schulthess Maschinen Recent Development
Table 122. Lavatec Company Information
Table 123. Lavatec Description and Business Overview
Table 124. Lavatec Commercial Washing Machines Sales (Units), Revenue (US$ Million), Price (US$/Unit) and Gross Margin (2018-2023)
Table 125. Lavatec Commercial Washing Machines Product
Table 126. Lavatec Recent Development
Table 127. G.A. Braun, Inc. Company Information
Table 128. G.A. Braun, Inc. Description and Business Overview
Table 129. G.A. Braun, Inc. Commercial Washing Machines Sales (Units), Revenue (US$ Million), Price (US$/Unit) and Gross Margin (2018-2023)
Table 130. G.A. Braun, Inc. Commercial Washing Machines Product
Table 131. G.A. Braun, Inc. Recent Development
Table 132. ASKO Company Information
Table 133. ASKO Description and Business Overview
Table 134. ASKO Commercial Washing Machines Sales (Units), Revenue (US$ Million), Price (US$/Unit) and Gross Margin (2018-2023)
Table 135. ASKO Commercial Washing Machines Product
Table 136. ASKO Recent Development
Table 137. Stefab India Limited Company Information
Table 138. Stefab India Limited Description and Business Overview
Table 139. Stefab India Limited Commercial Washing Machines Sales (Units), Revenue (US$ Million), Price (US$/Unit) and Gross Margin (2018-2023)
Table 140. Stefab India Limited Commercial Washing Machines Product
Table 141. Stefab India Limited Recent Development
Table 142. EDRO Corporation Company Information
Table 143. EDRO Corporation Description and Business Overview
Table 144. EDRO Corporation Commercial Washing Machines Sales (Units), Revenue (US$ Million), Price (US$/Unit) and Gross Margin (2018-2023)
Table 145. EDRO Corporation Commercial Washing Machines Product
Table 146. EDRO Corporation Recent Development
Table 147. IMESA Company Information
Table 148. IMESA Description and Business Overview
Table 149. IMESA Commercial Washing Machines Sales (Units), Revenue (US$ Million), Price (US$/Unit) and Gross Margin (2018-2023)
Table 150. IMESA Commercial Washing Machines Product
Table 151. IMESA Recent Development
Table 152. Stahl Company Information
Table 153. Stahl Description and Business Overview
Table 154. Stahl Commercial Washing Machines Sales (Units), Revenue (US$ Million), Price (US$/Unit) and Gross Margin (2018-2023)
Table 155. Stahl Commercial Washing Machines Product
Table 156. Stahl Recent Development
Table 157. Lavamac Company Information
Table 158. Lavamac Description and Business Overview
Table 159. Lavamac Commercial Washing Machines Sales (Units), Revenue (US$ Million), Price (US$/Unit) and Gross Margin (2018-2023)
Table 160. Lavamac Commercial Washing Machines Product
Table 161. Lavamac Recent Development
Table 162. Lapauw International Company Information
Table 163. Lapauw International Description and Business Overview
Table 164. Lapauw International Commercial Washing Machines Sales (Units), Revenue (US$ Million), Price (US$/Unit) and Gross Margin (2018-2023)
Table 165. Lapauw International Commercial Washing Machines Product
Table 166. Lapauw International Recent Development
Table 167. IMAGE Laundry Systems Company Information
Table 168. IMAGE Laundry Systems Description and Business Overview
Table 169. IMAGE Laundry Systems Commercial Washing Machines Sales (Units), Revenue (US$ Million), Price (US$/Unit) and Gross Margin (2018-2023)
Table 170. IMAGE Laundry Systems Commercial Washing Machines Product
Table 171. IMAGE Laundry Systems Recent Development
Table 172. GEI Company Information
Table 173. GEI Description and Business Overview
Table 174. GEI Commercial Washing Machines Sales (Units), Revenue (US$ Million), Price (US$/Unit) and Gross Margin (2018-2023)
Table 175. GEI Commercial Washing Machines Product
Table 176. GEI Recent Development
Table 177. IFB Appliances Company Information
Table 178. IFB Appliances Description and Business Overview
Table 179. IFB Appliances Commercial Washing Machines Sales (Units), Revenue (US$ Million), Price (US$/Unit) and Gross Margin (2018-2023)
Table 180. IFB Appliances Commercial Washing Machines Product
Table 181. IFB Appliances Recent Development
Table 182. Ramsons India Company Information
Table 183. Ramsons India Description and Business Overview
Table 184. Ramsons India Commercial Washing Machines Sales (Units), Revenue (US$ Million), Price (US$/Unit) and Gross Margin (2018-2023)
Table 185. Ramsons India Commercial Washing Machines Product
Table 186. Ramsons India Recent Development
Table 187. Key Raw Materials Lists
Table 188. Raw Materials Key Suppliers Lists
Table 189. Commercial Washing Machines Customers List
Table 190. Commercial Washing Machines Distributors List
Table 191. Research Programs/Design for This Report
Table 192. Key Data Information from Secondary Sources
Table 193. Key Data Information from Primary Sources
List of Figures
Figure 1. Commercial Washing Machines Product Picture
Figure 2. Global Commercial Washing Machines Revenue, (US$ Million), 2018 VS 2022 VS 2029
Figure 3. Global Commercial Washing Machines Market Size 2018-2029 (US$ Million)
Figure 4. Global Commercial Washing Machines Sales 2018-2029 (Units)
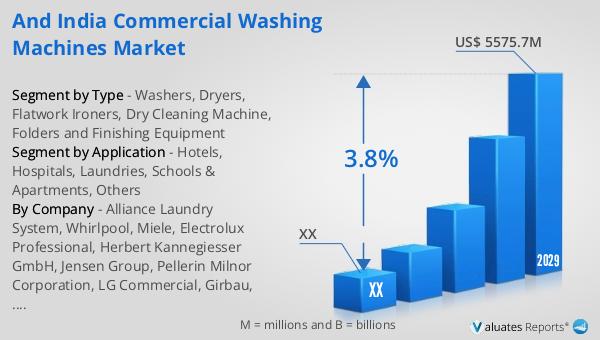
Figure 5. India Commercial Washing Machines Revenue, (US$ Million), 2018 VS 2022 VS 2029
Figure 6. India Commercial Washing Machines Market Size 2018-2029 (US$ Million)
Figure 7. India Commercial Washing Machines Sales 2018-2029 (Units)
Figure 8. India Commercial Washing Machines Market Share in Global, in Value (US$ Million) 2018-2029
Figure 9. India Commercial Washing Machines Market Share in Global, in Volume (Units) 2018-2029
Figure 10. Commercial Washing Machines Report Years Considered
Figure 11. Product Picture of Washers
Figure 12. Product Picture of Dryers
Figure 13. Product Picture of Flatwork Ironers
Figure 14. Product Picture of Dry Cleaning Machine
Figure 15. Product Picture of Folders and Finishing Equipment
Figure 16. Global Commercial Washing Machines Market Share by Type in 2022 & 2029
Figure 17. Global Commercial Washing Machines Sales in Value by Type (2018-2029) & (US$ Million)
Figure 18. Global Commercial Washing Machines Sales Market Share in Value by Type (2018-2029)
Figure 19. Global Commercial Washing Machines Sales by Type (2018-2029) & (Units)
Figure 20. Global Commercial Washing Machines Sales Market Share in Volume by Type (2018-2029)
Figure 21. Global Commercial Washing Machines Price by Type (2018-2029) & (US$/Unit)
Figure 22. India Commercial Washing Machines Market Share by Type in 2022 & 2029
Figure 23. India Commercial Washing Machines Sales in Value by Type (2018-2029) & (US$ Million)
Figure 24. India Commercial Washing Machines Sales Market Share in Value by Type (2018-2029)
Figure 25. India Commercial Washing Machines Sales by Type (2018-2029) & (Units)
Figure 26. India Commercial Washing Machines Sales Market Share in Volume by Type (2018-2029)
Figure 27. India Commercial Washing Machines Price by Type (2018-2029) & (US$/Unit)
Figure 28. Product Picture of Hotels
Figure 29. Product Picture of Hospitals
Figure 30. Product Picture of Laundries
Figure 31. Product Picture of Schools & Apartments
Figure 32. Product Picture of Others
Figure 33. Global Commercial Washing Machines Market Share by Application in 2022 & 2029
Figure 34. Global Commercial Washing Machines Sales in Value by Application (2018-2029) & (US$ Million)
Figure 35. Global Commercial Washing Machines Sales Market Share in Value by Application (2018-2029)
Figure 36. Global Commercial Washing Machines Sales by Application (2018-2029) & (Units)
Figure 37. Global Commercial Washing Machines Sales Market Share in Volume by Application (2018-2029)
Figure 38. Global Commercial Washing Machines Price by Application (2018-2029) & (US$/Unit)
Figure 39. India Commercial Washing Machines Market Share by Application in 2022 & 2029
Figure 40. India Commercial Washing Machines Sales in Value by Application (2018-2029) & (US$ Million)
Figure 41. India Commercial Washing Machines Sales Market Share in Value by Application (2018-2029)
Figure 42. India Commercial Washing Machines Sales by Application (2018-2029) & (Units)
Figure 43. India Commercial Washing Machines Sales Market Share in Volume by Application (2018-2029)
Figure 44. India Commercial Washing Machines Price by Application (2018-2029) & (US$/Unit)
Figure 45. Americas Commercial Washing Machines Sales in Volume Growth Rate 2018-2029 (Units)
Figure 46. Americas Commercial Washing Machines Sales in Value Growth Rate 2018-2029 (US$ Million)
Figure 47. Americas Commercial Washing Machines Sales by Type (2018-2029) & (Units)
Figure 48. Americas Commercial Washing Machines Sales Market Share in Volume by Type (2018-2029)
Figure 49. Americas Commercial Washing Machines Sales by Application (2018-2029) & (Units)
Figure 50. Americas Commercial Washing Machines Sales Market Share in Volume by Application (2018-2029)
Figure 51. United States Commercial Washing Machines Sales in Value Growth Rate (2018-2029) & (US$ Million)
Figure 52. Canada Commercial Washing Machines Sales in Value Growth Rate (2018-2029) & (US$ Million)
Figure 53. Mexico Commercial Washing Machines Sales in Value Growth Rate (2018-2029) & (US$ Million)
Figure 54. Brazil Commercial Washing Machines Sales in Value Growth Rate (2018-2029) & (US$ Million)
Figure 55. EMEA Commercial Washing Machines Sales in Volume Growth Rate 2018-2029 (Units)
Figure 56. EMEA Commercial Washing Machines Sales in Value Growth Rate 2018-2029 (US$ Million)
Figure 57. EMEA Commercial Washing Machines Sales by Type (2018-2029) & (Units)
Figure 58. EMEA Commercial Washing Machines Sales Market Share in Volume by Type (2018-2029)
Figure 59. EMEA Commercial Washing Machines Sales by Application (2018-2029) & (Units)
Figure 60. EMEA Commercial Washing Machines Sales Market Share in Volume by Application (2018-2029)
Figure 61. Europe Commercial Washing Machines Sales in Value Growth Rate (2018-2029) & (US$ Million)
Figure 62. Middle East Commercial Washing Machines Sales in Value Growth Rate (2018-2029) & (US$ Million)
Figure 63. Africa Commercial Washing Machines Sales in Value Growth Rate (2018-2029) & (US$ Million)
Figure 64. China Commercial Washing Machines Sales in Volume Growth Rate 2018-2029 (Units)
Figure 65. China Commercial Washing Machines Sales in Value Growth Rate 2018-2029 (US$ Million)
Figure 66. China Commercial Washing Machines Sales by Type (2018-2029) & (Units)
Figure 67. China Commercial Washing Machines Sales Market Share in Volume by Type (2018-2029)
Figure 68. China Commercial Washing Machines Sales by Application (2018-2029) & (Units)
Figure 69. China Commercial Washing Machines Sales Market Share in Volume by Application (2018-2029)
Figure 70. APAC Commercial Washing Machines Sales in Volume Growth Rate 2018-2029 (Units)
Figure 71. APAC Commercial Washing Machines Sales in Value Growth Rate 2018-2029 (US$ Million)
Figure 72. APAC Commercial Washing Machines Sales by Type (2018-2029) & (Units)
Figure 73. APAC Commercial Washing Machines Sales Market Share in Volume by Type (2018-2029)
Figure 74. APAC Commercial Washing Machines Sales by Application (2018-2029) & (Units)
Figure 75. APAC Commercial Washing Machines Sales Market Share in Volume by Application (2018-2029)
Figure 76. Japan Commercial Washing Machines Sales in Value Growth Rate (2018-2029) & (US$ Million)
Figure 77. South Korea Commercial Washing Machines Sales in Value Growth Rate (2018-2029) & (US$ Million)
Figure 78. China Taiwan Commercial Washing Machines Sales in Value Growth Rate (2018-2029) & (US$ Million)
Figure 79. Southeast Asia Commercial Washing Machines Sales in Value Growth Rate (2018-2029) & (US$ Million)
Figure 80. India Commercial Washing Machines Sales in Value Growth Rate (2018-2029) & (US$ Million)
Figure 81. Commercial Washing Machines Value Chain
Figure 82. Commercial Washing Machines Production Process
Figure 83. Channels of Distribution
Figure 84. Distributors Profiles
Figure 85. Bottom-up and Top-down Approaches for This Report
Figure 86. Data Triangulation
Figure 87. Key Executives Interviewed