0
U.S. (TOLL FREE)
+1 (315) 215-3225
Automative

0
U.S. (TOLL FREE)
+1 (315) 215-3225
Cruise Tourism - Global Market Insights and Sales Trends 2024
Published Date: December 2023
|
Report Code: QYRE-Auto-27G3891
Home | Market Reports | Travel| Cruises & Charters
Global Cruise Tourism Market Insights and Forecast to 2028
BUY CHAPTERS

Cruise Tourism - Global Market Insights and Sales Trends 2024

Code: QYRE-Auto-27G3891
Report
December 2023
Pages:101
QYResearch
Buy Now with 15% Discount
DESCRIPTION
TABLE OF CONTENT
TABLES & FIGURES

Cruise Tourism - Market Size

The cruise tourism market size will grow by USD 13 billion during 2018-2022.

Cruise Tourism -  Market

Cruise Tourism - Market

The global Cruise Tourism market size is expected to reach US$ million by 2029, growing at a CAGR of % from 2023 to 2029. The market is mainly driven by the significant applications of Cruise Tourism in various end use industries. The expanding demands from the Ocean cruising and River cruising, are propelling Cruise Tourism market. Passenger tickets, one of the segments analysed in this report, is projected to record % CAGR and reach US$ million by the end of the analysis period. Growth in the Onboard facilities segment is estimated at % CAGR for the next seven-year period.
This report offers an analysis of the market based on application (ocean cruising and river cruising) and product (passenger tickets and onboard facilities).

Report Objectives

This report provides market insight on the different segments, by players, by Type, by Application. Market size and forecast (2018-2029) has been provided in the report. The primary objectives of this report are to provide 1) global market size and forecasts, growth rates, market dynamics, industry structure and developments, market situation, trends; 2) global market share and ranking by company; 3) comprehensive presentation of the global market for Cruise Tourism, with both quantitative and qualitative analysis through detailed segmentation; 4) detailed value chain analysis and review of growth factors essential for the existing market players and new entrants; 5) emerging opportunities in the market and the future impact of major drivers and restraints of the market.

Key Features of The Study:

This report provides in-depth analysis of the global Cruise Tourism market, and provides market size (US$ million) and CAGR for the forecast period (2023-2029), considering 2022 as the base year.
This report profiles key players in the global Cruise Tourism market based on the following parameters - company details (found date, headquarters, manufacturing bases), products portfolio, Cruise Tourism sales data, market share and ranking.
This report elucidates potential market opportunities across different segments and explains attractive investment proposition matrices for this market.
This report illustrates key insights about market drivers, restraints, opportunities, market trends, regional outlook.
Key companies of Cruise Tourism covered in this report include Carnival Corporation, Royal Caribbean, Norwegian Cruise Lines, MSC Cruises, Genting Hong Kong, Disney Cruise, Marella Cruises (TUI), Saga Cruises (Saga Group) and Bohai Cruise, etc.
The global Cruise Tourism market report caters to various stakeholders in this industry including investors, suppliers, product players, distributors, new entrants, and financial analysts.
Market Segmentation
Company Profiles:
Carnival Corporation
Royal Caribbean
Norwegian Cruise Lines
MSC Cruises
Genting Hong Kong
Disney Cruise
Marella Cruises (TUI)
Saga Cruises (Saga Group)
Bohai Cruise
Century Cruises

Scope of Cruise Tourism - Market Report

Report Metric Details
Report Name Cruise Tourism - Market
Accounted market size in 2018 USD 13 billion
Base Year 2018
Global Cruise Tourism market, by region:
  • North America (U.S., Canada, Mexico)
  • Europe (Germany, France, UK, Italy, etc.)
  • Asia Pacific (China, Japan, South Korea, Southeast Asia, India, etc.)
  • South America (Brazil, etc.)
  • Middle East and Africa (Turkey, GCC Countries, Africa, etc.)
Global Cruise Tourism market, Segment by Type:
  • Passenger tickets
  • Onboard facilities
Global Cruise Tourism market, by Application
  • Ocean cruising
  • River cruising
Forecast units USD million in value
Report coverage Revenue and volume forecast, company share, competitive landscape, growth factors and trends

Core Chapters

  • Chapter One: Introduces the report scope of the report, executive summary of global and regional market size and CAGR for the history and forecast period (2018-2023, 2024-2029). It offers a high-level view of the current state of the market and its likely evolution in the short to mid-term, and long term.
  • Chapter Two: Provides the analysis of various market segments by Type, covering the market size and development potential of each market segment, to help readers find the blue ocean market in different market segments.
  • Chapter Three: Provides the analysis of various market segments by Application, covering the market size and development potential of each market segment, to help readers find the blue ocean market in different downstream markets.
  • Chapter Four: Detailed analysis of Cruise Tourism companies’ competitive landscape, revenue, market share and ranking, latest development plan, merger, and acquisition information, etc.
  • Chapter Five: Provides profiles of key players, introducing the basic situation of the main companies in the market in detail, including product introduction, revenue, recent development, etc.
  • Chapter Six, Seven, Eight, Nine and Ten: North America, Europe, Asia Pacific, Latin America, Middle East & Africa, revenue by country.
  • Chapter Eleven: this section also introduces the market dynamics, latest developments of the market, the driving factors and restrictive factors of the market, the challenges and risks faced by companies in the industry, and the analysis of relevant policies in the industry.
  • Chapter Twelve: Research Finding/Conclusion

FAQ for this report

What are the Application segmentation covered in the Cruise Tourism - Market report?

Ans: The Applications covered in the Cruise Tourism - Market report are Ocean cruising, River cruising

What are the Type segmentation covered in the Cruise Tourism - Market report?

Ans: The Types covered in the Cruise Tourism - Market report are Passenger tickets, Onboard facilities

1 Market Overview of Cruise Tourism
1.1 Cruise Tourism Market Overview
1.1.1 Cruise Tourism Product Scope
1.1.2 Cruise Tourism Market Status and Outlook
1.2 Global Cruise Tourism Market Size Overview by Region 2018 VS 2022 VS 2029
1.3 Global Cruise Tourism Market Size by Region (2018-2029)
1.4 Global Cruise Tourism Historic Market Size by Region (2018-2023)
1.5 Global Cruise Tourism Market Size Forecast by Region (2024-2029)
1.6 Key Regions, Cruise Tourism Market Size (2018-2029)
1.6.1 North America Cruise Tourism Market Size (2018-2029)
1.6.2 Europe Cruise Tourism Market Size (2018-2029)
1.6.3 Asia-Pacific Cruise Tourism Market Size (2018-2029)
1.6.4 Latin America Cruise Tourism Market Size (2018-2029)
1.6.5 Middle East & Africa Cruise Tourism Market Size (2018-2029)
2 Cruise Tourism Market by Type
2.1 Introduction
2.1.1 Passenger tickets
2.1.2 Onboard facilities
2.2 Global Cruise Tourism Market Size by Type: 2018 VS 2022 VS 2029
2.2.1 Global Cruise Tourism Historic Market Size by Type (2018-2023)
2.2.2 Global Cruise Tourism Forecasted Market Size by Type (2024-2029)
2.3 Key Regions Market Size by Type
2.3.1 North America Cruise Tourism Revenue Breakdown by Type (2018-2029)
2.3.2 Europe Cruise Tourism Revenue Breakdown by Type (2018-2029)
2.3.3 Asia-Pacific Cruise Tourism Revenue Breakdown by Type (2018-2029)
2.3.4 Latin America Cruise Tourism Revenue Breakdown by Type (2018-2029)
2.3.5 Middle East and Africa Cruise Tourism Revenue Breakdown by Type (2018-2029)
3 Cruise Tourism Market Overview by Application
3.1 Introduction
3.1.1 Ocean cruising
3.1.2 River cruising
3.2 Global Cruise Tourism Market Size by Application: 2018 VS 2022 VS 2029
3.2.1 Global Cruise Tourism Historic Market Size by Application (2018-2023)
3.2.2 Global Cruise Tourism Forecasted Market Size by Application (2024-2029)
3.3 Key Regions Market Size by Application
3.3.1 North America Cruise Tourism Revenue Breakdown by Application (2018-2029)
3.3.2 Europe Cruise Tourism Revenue Breakdown by Application (2018-2029)
3.3.3 Asia-Pacific Cruise Tourism Revenue Breakdown by Application (2018-2029)
3.3.4 Latin America Cruise Tourism Revenue Breakdown by Application (2018-2029)
3.3.5 Middle East and Africa Cruise Tourism Revenue Breakdown by Application (2018-2029)
4 Cruise Tourism Competition Analysis by Players
4.1 Global Cruise Tourism Market Size by Players (2018-2023)
4.2 Global Top Players by Company Type (Tier 1, Tier 2 and Tier 3) & (based on the Revenue in Cruise Tourism as of 2022)
4.3 Date of Key Players Enter into Cruise Tourism Market
4.4 Global Top Players Cruise Tourism Headquarters and Area Served
4.5 Key Players Cruise Tourism Product Solution and Service
4.6 Competitive Status
4.6.1 Cruise Tourism Market Concentration Rate
4.6.2 Mergers & Acquisitions, Expansion Plans
5 Company (Top Players) Profiles
5.1 Carnival Corporation
5.1.1 Carnival Corporation Profile
5.1.2 Carnival Corporation Main Business
5.1.3 Carnival Corporation Cruise Tourism Products, Services and Solutions
5.1.4 Carnival Corporation Cruise Tourism Revenue (US$ Million) & (2018-2023)
5.1.5 Carnival Corporation Recent Developments
5.2 Royal Caribbean
5.2.1 Royal Caribbean Profile
5.2.2 Royal Caribbean Main Business
5.2.3 Royal Caribbean Cruise Tourism Products, Services and Solutions
5.2.4 Royal Caribbean Cruise Tourism Revenue (US$ Million) & (2018-2023)
5.2.5 Royal Caribbean Recent Developments
5.3 Norwegian Cruise Lines
5.3.1 Norwegian Cruise Lines Profile
5.3.2 Norwegian Cruise Lines Main Business
5.3.3 Norwegian Cruise Lines Cruise Tourism Products, Services and Solutions
5.3.4 Norwegian Cruise Lines Cruise Tourism Revenue (US$ Million) & (2018-2023)
5.3.5 MSC Cruises Recent Developments
5.4 MSC Cruises
5.4.1 MSC Cruises Profile
5.4.2 MSC Cruises Main Business
5.4.3 MSC Cruises Cruise Tourism Products, Services and Solutions
5.4.4 MSC Cruises Cruise Tourism Revenue (US$ Million) & (2018-2023)
5.4.5 MSC Cruises Recent Developments
5.5 Genting Hong Kong
5.5.1 Genting Hong Kong Profile
5.5.2 Genting Hong Kong Main Business
5.5.3 Genting Hong Kong Cruise Tourism Products, Services and Solutions
5.5.4 Genting Hong Kong Cruise Tourism Revenue (US$ Million) & (2018-2023)
5.5.5 Genting Hong Kong Recent Developments
5.6 Disney Cruise
5.6.1 Disney Cruise Profile
5.6.2 Disney Cruise Main Business
5.6.3 Disney Cruise Cruise Tourism Products, Services and Solutions
5.6.4 Disney Cruise Cruise Tourism Revenue (US$ Million) & (2018-2023)
5.6.5 Disney Cruise Recent Developments
5.7 Marella Cruises (TUI)
5.7.1 Marella Cruises (TUI) Profile
5.7.2 Marella Cruises (TUI) Main Business
5.7.3 Marella Cruises (TUI) Cruise Tourism Products, Services and Solutions
5.7.4 Marella Cruises (TUI) Cruise Tourism Revenue (US$ Million) & (2018-2023)
5.7.5 Marella Cruises (TUI) Recent Developments
5.8 Saga Cruises (Saga Group)
5.8.1 Saga Cruises (Saga Group) Profile
5.8.2 Saga Cruises (Saga Group) Main Business
5.8.3 Saga Cruises (Saga Group) Cruise Tourism Products, Services and Solutions
5.8.4 Saga Cruises (Saga Group) Cruise Tourism Revenue (US$ Million) & (2018-2023)
5.8.5 Saga Cruises (Saga Group) Recent Developments
5.9 Bohai Cruise
5.9.1 Bohai Cruise Profile
5.9.2 Bohai Cruise Main Business
5.9.3 Bohai Cruise Cruise Tourism Products, Services and Solutions
5.9.4 Bohai Cruise Cruise Tourism Revenue (US$ Million) & (2018-2023)
5.9.5 Bohai Cruise Recent Developments
5.10 Century Cruises
5.10.1 Century Cruises Profile
5.10.2 Century Cruises Main Business
5.10.3 Century Cruises Cruise Tourism Products, Services and Solutions
5.10.4 Century Cruises Cruise Tourism Revenue (US$ Million) & (2018-2023)
5.10.5 Century Cruises Recent Developments
6 North America
6.1 North America Cruise Tourism Market Size by Country (2018-2029)
6.2 U.S.
6.3 Canada
7 Europe
7.1 Europe Cruise Tourism Market Size by Country (2018-2029)
7.2 Germany
7.3 France
7.4 U.K.
7.5 Italy
7.6 Russia
7.7 Nordic Countries
7.8 Rest of Europe
8 Asia-Pacific
8.1 Asia-Pacific Cruise Tourism Market Size by Region (2018-2029)
8.2 China
8.3 Japan
8.4 South Korea
8.5 Southeast Asia
8.6 India
8.7 Australia
8.8 Rest of Asia-Pacific
9 Latin America
9.1 Latin America Cruise Tourism Market Size by Country (2018-2029)
9.2 Mexico
9.3 Brazil
9.4 Rest of Latin America
10 Middle East & Africa
10.1 Middle East & Africa Cruise Tourism Market Size by Country (2018-2029)
10.2 Turkey
10.3 Saudi Arabia
10.4 UAE
10.5 Rest of Middle East & Africa
11 Cruise Tourism Market Dynamics
11.1 Cruise Tourism Industry Trends
11.2 Cruise Tourism Market Drivers
11.3 Cruise Tourism Market Challenges
11.4 Cruise Tourism Market Restraints
12 Research Finding /Conclusion
13 Methodology and Data Source
13.1 Methodology/Research Approach
13.1.1 Research Programs/Design
13.1.2 Market Size Estimation
13.1.3 Market Breakdown and Data Triangulation
13.2 Data Source
13.2.1 Secondary Sources
13.2.2 Primary Sources
13.3 Disclaimer
13.4 Author List
List of Tables
    Table 1. Global Market Cruise Tourism Market Size (US$ Million) Comparison by Region 2018 VS 2022 VS 2029
    Table 2. Global Cruise Tourism Market Size by Region (2018-2023) & (US$ Million)
    Table 3. Global Cruise Tourism Market Size Share by Region (2018-2023)
    Table 4. Global Cruise Tourism Forecasted Market Size by Region (2024-2029) & (US$ Million)
    Table 5. Global Cruise Tourism Forecasted Market Size Share by Region (2024-2029)
    Table 6. Global Cruise Tourism Market Size (US$ Million) by Type: 2018 VS 2022 VS 2029
    Table 7. Global Cruise Tourism Market Size by Type (2018-2023) & (US$ Million)
    Table 8. Global Cruise Tourism Revenue Market Share by Type (2018-2023)
    Table 9. Global Cruise Tourism Forecasted Market Size by Type (2024-2029) & (US$ Million)
    Table 10. Global Cruise Tourism Revenue Market Share by Type (2024-2029)
    Table 11. North America Cruise Tourism Revenue by Type (2018-2023) & (US$ Million)
    Table 12. North America Cruise Tourism Revenue by Type (2024-2029) & (US$ Million)
    Table 13. Europe Cruise Tourism Revenue by Type (2018-2023) & (US$ Million)
    Table 14. Europe Cruise Tourism Revenue by Type (2024-2029) & (US$ Million)
    Table 15. Asia-Pacific Cruise Tourism Revenue by Type (2018-2023) & (US$ Million)
    Table 16. Asia-Pacific Cruise Tourism Revenue by Type (2024-2029) & (US$ Million)
    Table 17. Latin America Cruise Tourism Revenue by Type (2018-2023) & (US$ Million)
    Table 18. Latin America Cruise Tourism Revenue by Type (2024-2029) & (US$ Million)
    Table 19. Middle East and Africa Cruise Tourism Revenue by Type (2018-2023) & (US$ Million)
    Table 20. Middle East and Africa Cruise Tourism Revenue by Type (2024-2029) & (US$ Million)
    Table 21. Global Cruise Tourism Market Size (US$ Million) by Application: 2018 VS 2022 VS 2029
    Table 22. Global Cruise Tourism Market Size by Application (2018-2023) & (US$ Million)
    Table 23. Global Cruise Tourism Revenue Market Share by Application (2018-2023)
    Table 24. Global Cruise Tourism Forecasted Market Size by Application (2024-2029) & (US$ Million)
    Table 25. Global Cruise Tourism Revenue Market Share by Application (2024-2029)
    Table 26. North America Cruise Tourism Revenue by Application (2018-2023) & (US$ Million)
    Table 27. North America Cruise Tourism Revenue by Application (2024-2029) & (US$ Million)
    Table 28. Europe Cruise Tourism Revenue by Application (2018-2023) & (US$ Million)
    Table 29. Europe Cruise Tourism Revenue by Application (2024-2029) & (US$ Million)
    Table 30. Asia-Pacific Cruise Tourism Revenue by Application (2018-2023) & (US$ Million)
    Table 31. Asia-Pacific Cruise Tourism Revenue by Application (2024-2029) & (US$ Million)
    Table 32. Latin America Cruise Tourism Revenue by Application (2018-2023) & (US$ Million)
    Table 33. Latin America Cruise Tourism Revenue by Application (2024-2029) & (US$ Million)
    Table 34. Middle East and Africa Cruise Tourism Revenue by Application (2018-2023) & (US$ Million)
    Table 35. Middle East and Africa Cruise Tourism Revenue by Application (2024-2029) & (US$ Million)
    Table 36. Global Cruise Tourism Revenue (US$ Million) by Players (2018-2023)
    Table 37. Global Cruise Tourism Revenue Market Share by Players (2018-2023)
    Table 38. Global Top Players Market Share by Company Type (Tier 1, Tier 2 and Tier 3) & (based on the Revenue in Cruise Tourism as of 2022)
    Table 39. Date of Key Players Enter into Cruise Tourism Market
    Table 40. Global Cruise Tourism Key Players Headquarters and Area Served
    Table 41. Cruise Tourism Product Solution and Service
    Table 42. Global Cruise Tourism Players Market Concentration Ratio (CR5 and HHI)
    Table 43. Mergers & Acquisitions, Expansion Plans
    Table 44. Carnival Corporation Basic Information List
    Table 45. Carnival Corporation Description and Business Overview
    Table 46. Carnival Corporation Cruise Tourism Products, Services and Solutions
    Table 47. Revenue (US$ Million) in Cruise Tourism Business of Carnival Corporation (2018-2023)
    Table 48. Carnival Corporation Recent Developments
    Table 49. Royal Caribbean Basic Information List
    Table 50. Royal Caribbean Description and Business Overview
    Table 51. Royal Caribbean Cruise Tourism Products, Services and Solutions
    Table 52. Revenue (US$ Million) in Cruise Tourism Business of Royal Caribbean (2018-2023)
    Table 53. Royal Caribbean Recent Developments
    Table 54. Norwegian Cruise Lines Basic Information List
    Table 55. Norwegian Cruise Lines Description and Business Overview
    Table 56. Norwegian Cruise Lines Cruise Tourism Products, Services and Solutions
    Table 57. Revenue (US$ Million) in Cruise Tourism Business of Norwegian Cruise Lines (2018-2023)
    Table 58. Norwegian Cruise Lines Recent Developments
    Table 59. MSC Cruises Basic Information List
    Table 60. MSC Cruises Description and Business Overview
    Table 61. MSC Cruises Cruise Tourism Products, Services and Solutions
    Table 62. Revenue (US$ Million) in Cruise Tourism Business of MSC Cruises (2018-2023)
    Table 63. MSC Cruises Recent Developments
    Table 64. Genting Hong Kong Basic Information List
    Table 65. Genting Hong Kong Description and Business Overview
    Table 66. Genting Hong Kong Cruise Tourism Products, Services and Solutions
    Table 67. Revenue (US$ Million) in Cruise Tourism Business of Genting Hong Kong (2018-2023)
    Table 68. Genting Hong Kong Recent Developments
    Table 69. Disney Cruise Basic Information List
    Table 70. Disney Cruise Description and Business Overview
    Table 71. Disney Cruise Cruise Tourism Products, Services and Solutions
    Table 72. Revenue (US$ Million) in Cruise Tourism Business of Disney Cruise (2018-2023)
    Table 73. Disney Cruise Recent Developments
    Table 74. Marella Cruises (TUI) Basic Information List
    Table 75. Marella Cruises (TUI) Description and Business Overview
    Table 76. Marella Cruises (TUI) Cruise Tourism Products, Services and Solutions
    Table 77. Revenue (US$ Million) in Cruise Tourism Business of Marella Cruises (TUI) (2018-2023)
    Table 78. Marella Cruises (TUI) Recent Developments
    Table 79. Saga Cruises (Saga Group) Basic Information List
    Table 80. Saga Cruises (Saga Group) Description and Business Overview
    Table 81. Saga Cruises (Saga Group) Cruise Tourism Products, Services and Solutions
    Table 82. Revenue (US$ Million) in Cruise Tourism Business of Saga Cruises (Saga Group) (2018-2023)
    Table 83. Saga Cruises (Saga Group) Recent Developments
    Table 84. Bohai Cruise Basic Information List
    Table 85. Bohai Cruise Description and Business Overview
    Table 86. Bohai Cruise Cruise Tourism Products, Services and Solutions
    Table 87. Revenue (US$ Million) in Cruise Tourism Business of Bohai Cruise (2018-2023)
    Table 88. Bohai Cruise Recent Developments
    Table 89. Century Cruises Basic Information List
    Table 90. Century Cruises Description and Business Overview
    Table 91. Century Cruises Cruise Tourism Products, Services and Solutions
    Table 92. Revenue (US$ Million) in Cruise Tourism Business of Century Cruises (2018-2023)
    Table 93. Century Cruises Recent Developments
    Table 94. North America Cruise Tourism Market Size by Country (2018-2023) & (US$ Million)
    Table 95. North America Cruise Tourism Market Size by Country (2024-2029) & (US$ Million)
    Table 96. Europe Cruise Tourism Market Size by Country (2018-2023) & (US$ Million)
    Table 97. Europe Cruise Tourism Market Size by Country (2024-2029) & (US$ Million)
    Table 98. Asia-Pacific Cruise Tourism Market Size Growth Rate (CAGR) by Region (US$ Million): 2018 VS 2022 VS 2029
    Table 99. Asia-Pacific Cruise Tourism Market Size by Region (2018-2023) & (US$ Million)
    Table 100. Asia-Pacific Cruise Tourism Market Size by Region (2024-2029) & (US$ Million)
    Table 101. Asia-Pacific Cruise Tourism Market Share by Region (2018-2023)
    Table 102. Asia-Pacific Cruise Tourism Market Share by Region (2024-2029)
    Table 103. Latin America Cruise Tourism Market Size Growth Rate (CAGR) by Region (US$ Million): 2018 VS 2022 VS 2029
    Table 104. Latin America Cruise Tourism Market Size by Country (2018-2023) & (US$ Million)
    Table 105. Latin America Cruise Tourism Market Size by Country (2024-2029) & (US$ Million)
    Table 106. Middle East & Africa Cruise Tourism Market Size Growth Rate (CAGR) by Region (US$ Million): 2018 VS 2022 VS 2029
    Table 107. Middle East & Africa Cruise Tourism Market Size by Country (2018-2023) & (US$ Million)
    Table 108. Middle East & Africa Cruise Tourism Market Size by Country (2024-2029) & (US$ Million)
    Table 109. Cruise Tourism Market Trends
    Table 110. Cruise Tourism Market Drivers
    Table 111. Cruise Tourism Market Challenges
    Table 112. Cruise Tourism Market Restraints
    Table 113. Research Programs/Design for This Report
    Table 114. Key Data Information from Secondary Sources
    Table 115. Key Data Information from Primary Sources
List of Figures
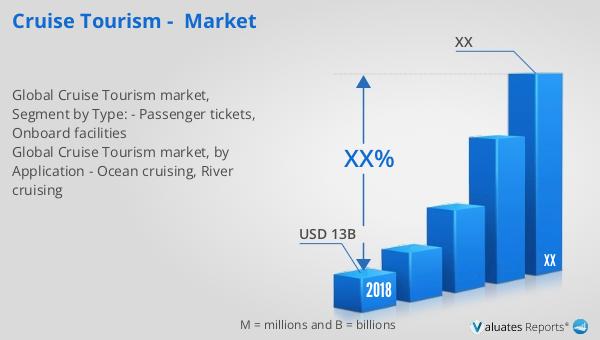
    Figure 1. Global Cruise Tourism Market Size Year-over-Year 2018-2029 & (US$ Million)
    Figure 2. Global Cruise Tourism Market Size (US$ Million), 2018 VS 2022 VS 2029
    Figure 3. Global Cruise Tourism Market Share by Regions: 2022 VS 2029
    Figure 4. Global Cruise Tourism Forecasted Market Size Share by Region (2024-2029)
    Figure 5. North America Cruise Tourism Market Size Growth Rate (2018-2029) & (US$ Million)
    Figure 6. Europe Cruise Tourism Market Size Growth Rate (2018-2029) & (US$ Million)
    Figure 7. Asia-Pacific Cruise Tourism Market Size Growth Rate (2018-2029) & (US$ Million)
    Figure 8. Latin America Cruise Tourism Market Size Growth Rate (2018-2029) & (US$ Million)
    Figure 9. Middle East & Africa Cruise Tourism Market Size Growth Rate (2018-2029) & (US$ Million)
    Figure 10. Product Picture of Passenger tickets
    Figure 11. Global Passenger tickets Market Size (US$ Million) & YoY Growth (2018-2029)
    Figure 12. Product Picture of Onboard facilities
    Figure 13. Global Onboard facilities Market Size (US$ Million) & YoY Growth (2018-2029)
    Figure 14. Global Cruise Tourism Market Size Share by Type: 2022 & 2029
    Figure 15. North America Cruise Tourism Revenue Market Share by Type (2018-2029)
    Figure 16. Europe Cruise Tourism Revenue Market Share by Type (2018-2029)
    Figure 17. Asia-Pacific Cruise Tourism Revenue Market Share by Type (2018-2029)
    Figure 18. Latin America Cruise Tourism Revenue Market Share by Type (2018-2029)
    Figure 19. Middle East and Africa Cruise Tourism Revenue Market Share by Type (2018-2029)
    Figure 20. Ocean cruising Market Size (US$ Million) & YoY Growth (2018-2029)
    Figure 21. River cruising Market Size (US$ Million) & YoY Growth (2018-2029)
    Figure 22. Global Cruise Tourism Market Size Share by Application: 2022 & 2029
    Figure 23. North America Cruise Tourism Revenue Market Share by Application (2018-2029)
    Figure 24. Europe Cruise Tourism Revenue Market Share by Application (2018-2029)
    Figure 25. Asia-Pacific Cruise Tourism Revenue Market Share by Application (2018-2029)
    Figure 26. Latin America Cruise Tourism Revenue Market Share by Application (2018-2029)
    Figure 27. Middle East and Africa Cruise Tourism Revenue Market Share by Application (2018-2029)
    Figure 28. Cruise Tourism Market Share by Company Type (Tier 1, Tier 2 and Tier 3): 2018 VS 2022
    Figure 29. Global Top 5 and Top 10 Players Cruise Tourism Market Share in 2022
    Figure 30. North America Cruise Tourism Market Share by Country (2018-2029)
    Figure 31. U.S. Cruise Tourism Market Size (2018-2029) & (US$ Million)
    Figure 32. Canada Cruise Tourism Market Size (2018-2029) & (US$ Million)
    Figure 33. Germany Cruise Tourism Market Size (2018-2029) & (US$ Million)
    Figure 34. France Cruise Tourism Market Size (2018-2029) & (US$ Million)
    Figure 35. U.K. Cruise Tourism Market Size (2018-2029) & (US$ Million)
    Figure 36. Italy Cruise Tourism Market Size (2018-2029) & (US$ Million)
    Figure 37. Russia Cruise Tourism Market Size (2018-2029) & (US$ Million)
    Figure 38. Nordic Countries Cruise Tourism Market Size (2018-2029) & (US$ Million)
    Figure 39. Asia-Pacific Cruise Tourism Market Share by Region (2018-2029)
    Figure 40. China Cruise Tourism Market Size (2018-2029) & (US$ Million)
    Figure 41. Japan Cruise Tourism Market Size (2018-2029) & (US$ Million)
    Figure 42. South Korea Cruise Tourism Market Size (2018-2029) & (US$ Million)
    Figure 43. Southeast Asia Cruise Tourism Market Size (2018-2029) & (US$ Million)
    Figure 44. India Cruise Tourism Market Size (2018-2029) & (US$ Million)
    Figure 45. Australia Cruise Tourism Market Size (2018-2029) & (US$ Million)
    Figure 46. Latin America Cruise Tourism Market Share by Country (2018-2029)
    Figure 47. Mexico Cruise Tourism Market Size (2018-2029) & (US$ Million)
    Figure 48. Brazil Cruise Tourism Market Size (2018-2029) & (US$ Million)
    Figure 49. Middle East & Africa Cruise Tourism Market Share by Country (2018-2029)
    Figure 50. Turkey Cruise Tourism Market Size (2018-2029) & (US$ Million)
    Figure 51. Saudi Arabia Cruise Tourism Market Size (2018-2029) & (US$ Million)
    Figure 52. UAE Cruise Tourism Market Size (2018-2029) & (US$ Million)
    Figure 53. Bottom-up and Top-down Approaches for This Report
SELECT A FORMAT
Added to Cart
Electronic (PDF)

$3350

This license allows only one user to access the PDF.
Electronic (PDF)

$5025

This license allows 1 - 5 user to access the PDF, license is suitable for small groups of 5 users working together
Electronic (PDF)

$6700

This license allows users/teams in a same Enterprise to use this report, various departments within an enterpise can use this report
Add to Cart
Buy Now (15% Discount)

OUR CUSTOMER

Nano Dimension

SIMILAR REPORTS