List of Tables
Table 1. Food Metal Detection and X-ray Inspection Equipment CAGR in Value, India VS Global, 2018 VS 2022 VS 2029
Table 2. Food Metal Detection and X-ray Inspection Equipment Market Trends
Table 3. Food Metal Detection and X-ray Inspection Equipment Market Drivers
Table 4. Food Metal Detection and X-ray Inspection Equipment Market Challenges
Table 5. Food Metal Detection and X-ray Inspection Equipment Market Restraints
Table 6. Global Food Metal Detection and X-ray Inspection Equipment Sales Growth Rate (CAGR) by Type: 2018 VS 2022 VS 2029 (US$ Million)
Table 7. India Food Metal Detection and X-ray Inspection Equipment Sales Growth Rate (CAGR) by Type: 2018 VS 2022 VS 2029 (US$ Million)
Table 8. Global Food Metal Detection and X-ray Inspection Equipment Sales Growth Rate (CAGR) by Application: 2018 VS 2022 VS 2029 (US$ Million)
Table 9. India Food Metal Detection and X-ray Inspection Equipment Sales Growth Rate (CAGR) by Application: 2018 VS 2022 VS 2029 (US$ Million)
Table 10. Global Key Manufacturers of Food Metal Detection and X-ray Inspection Equipment, Ranked by Revenue (2022) & (US$ Million)
Table 11. Global Food Metal Detection and X-ray Inspection Equipment Revenue by Manufacturer, (US$ Million), 2018-2023
Table 12. Global Food Metal Detection and X-ray Inspection Equipment Revenue Share by Manufacturer, 2018-2023
Table 13. Global Food Metal Detection and X-ray Inspection Equipment Sales by Manufacturer, (Units), 2018-2023
Table 14. Global Food Metal Detection and X-ray Inspection Equipment Sales Share by Manufacturer, 2018-2023
Table 15. Global Food Metal Detection and X-ray Inspection Equipment Price by Manufacturer (2018-2023) & (K US$/Unit)
Table 16. Global Food Metal Detection and X-ray Inspection Equipment Manufacturers Market Concentration Ratio (CR5 and HHI)
Table 17. Global Food Metal Detection and X-ray Inspection Equipment by Company Type (Tier 1, Tier 2, and Tier 3) & (based on the Revenue in Food Metal Detection and X-ray Inspection Equipment as of 2022)
Table 18. Global Key Manufacturers of Food Metal Detection and X-ray Inspection Equipment, Manufacturing Base Distribution and Headquarters
Table 19. Global Key Manufacturers of Food Metal Detection and X-ray Inspection Equipment, Product Offered and Application
Table 20. Global Key Manufacturers of Food Metal Detection and X-ray Inspection Equipment, Date of Enter into This Industry
Table 21. Manufacturers Mergers & Acquisitions, Expansion Plans
Table 22. Key Players of Food Metal Detection and X-ray Inspection Equipment in India, Ranked by Revenue (2022) & (US$ million)
Table 23. India Food Metal Detection and X-ray Inspection Equipment Revenue by Players, (US$ Million), (2018-2023)
Table 24. India Food Metal Detection and X-ray Inspection Equipment Revenue Share by Players, (2018-2023)
Table 25. India Food Metal Detection and X-ray Inspection Equipment Sales by Players, (Units), (2018-2023)
Table 26. India Food Metal Detection and X-ray Inspection Equipment Sales Share by Players, (2018-2023)
Table 27. Global Food Metal Detection and X-ray Inspection Equipment Market Size Growth Rate (CAGR) by Region (US$ Million): 2018 VS 2022 VS 2029
Table 28. Global Food Metal Detection and X-ray Inspection Equipment Sales in Volume by Region (2018-2023) & (Units)
Table 29. Global Food Metal Detection and X-ray Inspection Equipment Sales in Volume Forecast by Region (2024-2029) & (Units)
Table 30. Global Food Metal Detection and X-ray Inspection Equipment Sales in Value by Region (2018-2023) & (US$ Million)
Table 31. Global Food Metal Detection and X-ray Inspection Equipment Sales in Value Forecast by Region (2024-2029) & (US$ Million)
Table 32. Americas Food Metal Detection and X-ray Inspection Equipment Market Size Growth Rate (CAGR) by Country (US$ Million): 2018 VS 2022 VS 2029
Table 33. Americas Food Metal Detection and X-ray Inspection Equipment Sales in Value by Country (2018-2023) & (US$ Million)
Table 34. Americas Food Metal Detection and X-ray Inspection Equipment Sales in Value by Country (2024-2029) & (US$ Million)
Table 35. Americas Food Metal Detection and X-ray Inspection Equipment Sales in Volume by Country (2018-2023) & (Units)
Table 36. Americas Food Metal Detection and X-ray Inspection Equipment Sales in Volume by Country (2024-2029) & (Units)
Table 37. EMEA Food Metal Detection and X-ray Inspection Equipment Market Size Growth Rate (CAGR) by Country (US$ Million): 2018 VS 2022 VS 2029
Table 38. EMEA Food Metal Detection and X-ray Inspection Equipment Sales in Value by Country (2018-2023) & (US$ Million)
Table 39. EMEA Food Metal Detection and X-ray Inspection Equipment Sales in Value by Country (2024-2029) & (US$ Million)
Table 40. EMEA Food Metal Detection and X-ray Inspection Equipment Sales in Volume by Country (2018-2023) & (Units)
Table 41. EMEA Food Metal Detection and X-ray Inspection Equipment Sales in Volume by Country (2024-2029) & (Units)
Table 42. APAC Food Metal Detection and X-ray Inspection Equipment Market Size Growth Rate (CAGR) by Country (US$ Million): 2018 VS 2022 VS 2029
Table 43. APAC Food Metal Detection and X-ray Inspection Equipment Sales in Value by Country (2018-2023) & (US$ Million)
Table 44. APAC Food Metal Detection and X-ray Inspection Equipment Sales in Value by Country (2024-2029) & (US$ Million)
Table 45. APAC Food Metal Detection and X-ray Inspection Equipment Sales in Volume by Country (2018-2023) & (Units)
Table 46. APAC Food Metal Detection and X-ray Inspection Equipment Sales in Volume by Country (2024-2029) & (Units)
Table 47. Mettler-Toledo Company Information
Table 48. Mettler-Toledo Description and Business Overview
Table 49. Mettler-Toledo Food Metal Detection and X-ray Inspection Equipment Sales (Units), Revenue (US$ Million), Price (K US$/Unit) and Gross Margin (2018-2023)
Table 50. Mettler-Toledo Food Metal Detection and X-ray Inspection Equipment Product
Table 51. Mettler-Toledo Recent Development
Table 52. Anritsu Infivis Company Information
Table 53. Anritsu Infivis Description and Business Overview
Table 54. Anritsu Infivis Food Metal Detection and X-ray Inspection Equipment Sales (Units), Revenue (US$ Million), Price (K US$/Unit) and Gross Margin (2018-2023)
Table 55. Anritsu Infivis Food Metal Detection and X-ray Inspection Equipment Product
Table 56. Anritsu Infivis Recent Development
Table 57. Sesotec GmbH Company Information
Table 58. Sesotec GmbH Description and Business Overview
Table 59. Sesotec GmbH Food Metal Detection and X-ray Inspection Equipment Sales (Units), Revenue (US$ Million), Price (K US$/Unit) and Gross Margin (2018-2023)
Table 60. Sesotec GmbH Food Metal Detection and X-ray Inspection Equipment Product
Table 61. Sesotec GmbH Recent Development
Table 62. Ishida Company Information
Table 63. Ishida Description and Business Overview
Table 64. Ishida Food Metal Detection and X-ray Inspection Equipment Sales (Units), Revenue (US$ Million), Price (K US$/Unit) and Gross Margin (2018-2023)
Table 65. Ishida Food Metal Detection and X-ray Inspection Equipment Product
Table 66. Ishida Recent Development
Table 67. Thermo-fisher Company Information
Table 68. Thermo-fisher Description and Business Overview
Table 69. Thermo-fisher Food Metal Detection and X-ray Inspection Equipment Sales (Units), Revenue (US$ Million), Price (K US$/Unit) and Gross Margin (2018-2023)
Table 70. Thermo-fisher Food Metal Detection and X-ray Inspection Equipment Product
Table 71. Thermo-fisher Recent Development
Table 72. Minebea Intec Company Information
Table 73. Minebea Intec Description and Business Overview
Table 74. Minebea Intec Food Metal Detection and X-ray Inspection Equipment Sales (Units), Revenue (US$ Million), Price (K US$/Unit) and Gross Margin (2018-2023)
Table 75. Minebea Intec Food Metal Detection and X-ray Inspection Equipment Product
Table 76. Minebea Intec Recent Development
Table 77. Multivac Group Company Information
Table 78. Multivac Group Description and Business Overview
Table 79. Multivac Group Food Metal Detection and X-ray Inspection Equipment Sales (Units), Revenue (US$ Million), Price (K US$/Unit) and Gross Margin (2018-2023)
Table 80. Multivac Group Food Metal Detection and X-ray Inspection Equipment Product
Table 81. Multivac Group Recent Development
Table 82. Loma Systems Company Information
Table 83. Loma Systems Description and Business Overview
Table 84. Loma Systems Food Metal Detection and X-ray Inspection Equipment Sales (Units), Revenue (US$ Million), Price (K US$/Unit) and Gross Margin (2018-2023)
Table 85. Loma Systems Food Metal Detection and X-ray Inspection Equipment Product
Table 86. Loma Systems Recent Development
Table 87. Bizerba Company Information
Table 88. Bizerba Description and Business Overview
Table 89. Bizerba Food Metal Detection and X-ray Inspection Equipment Sales (Units), Revenue (US$ Million), Price (K US$/Unit) and Gross Margin (2018-2023)
Table 90. Bizerba Food Metal Detection and X-ray Inspection Equipment Product
Table 91. Bizerba Recent Development
Table 92. Nissin Electronics Company Information
Table 93. Nissin Electronics Description and Business Overview
Table 94. Nissin Electronics Food Metal Detection and X-ray Inspection Equipment Sales (Units), Revenue (US$ Million), Price (K US$/Unit) and Gross Margin (2018-2023)
Table 95. Nissin Electronics Food Metal Detection and X-ray Inspection Equipment Product
Table 96. Nissin Electronics Recent Development
Table 97. Eagle PI Company Information
Table 98. Eagle PI Description and Business Overview
Table 99. Eagle PI Food Metal Detection and X-ray Inspection Equipment Sales (Units), Revenue (US$ Million), Price (K US$/Unit) and Gross Margin (2018-2023)
Table 100. Eagle PI Food Metal Detection and X-ray Inspection Equipment Product
Table 101. Eagle PI Recent Development
Table 102. WIPOTEC-OCS Company Information
Table 103. WIPOTEC-OCS Description and Business Overview
Table 104. WIPOTEC-OCS Food Metal Detection and X-ray Inspection Equipment Sales (Units), Revenue (US$ Million), Price (K US$/Unit) and Gross Margin (2018-2023)
Table 105. WIPOTEC-OCS Food Metal Detection and X-ray Inspection Equipment Product
Table 106. WIPOTEC-OCS Recent Development
Table 107. CEIA Company Information
Table 108. CEIA Description and Business Overview
Table 109. CEIA Food Metal Detection and X-ray Inspection Equipment Sales (Units), Revenue (US$ Million), Price (K US$/Unit) and Gross Margin (2018-2023)
Table 110. CEIA Food Metal Detection and X-ray Inspection Equipment Product
Table 111. CEIA Recent Development
Table 112. Techik Company Information
Table 113. Techik Description and Business Overview
Table 114. Techik Food Metal Detection and X-ray Inspection Equipment Sales (Units), Revenue (US$ Million), Price (K US$/Unit) and Gross Margin (2018-2023)
Table 115. Techik Food Metal Detection and X-ray Inspection Equipment Product
Table 116. Techik Recent Development
Table 117. Dylog Hi-Tech Company Information
Table 118. Dylog Hi-Tech Description and Business Overview
Table 119. Dylog Hi-Tech Food Metal Detection and X-ray Inspection Equipment Sales (Units), Revenue (US$ Million), Price (K US$/Unit) and Gross Margin (2018-2023)
Table 120. Dylog Hi-Tech Food Metal Detection and X-ray Inspection Equipment Product
Table 121. Dylog Hi-Tech Recent Development
Table 122. Mekitec Company Information
Table 123. Mekitec Description and Business Overview
Table 124. Mekitec Food Metal Detection and X-ray Inspection Equipment Sales (Units), Revenue (US$ Million), Price (K US$/Unit) and Gross Margin (2018-2023)
Table 125. Mekitec Food Metal Detection and X-ray Inspection Equipment Product
Table 126. Mekitec Recent Development
Table 127. Nikka Densok Company Information
Table 128. Nikka Densok Description and Business Overview
Table 129. Nikka Densok Food Metal Detection and X-ray Inspection Equipment Sales (Units), Revenue (US$ Million), Price (K US$/Unit) and Gross Margin (2018-2023)
Table 130. Nikka Densok Food Metal Detection and X-ray Inspection Equipment Product
Table 131. Nikka Densok Recent Development
Table 132. Cassel Messtechnik Company Information
Table 133. Cassel Messtechnik Description and Business Overview
Table 134. Cassel Messtechnik Food Metal Detection and X-ray Inspection Equipment Sales (Units), Revenue (US$ Million), Price (K US$/Unit) and Gross Margin (2018-2023)
Table 135. Cassel Messtechnik Food Metal Detection and X-ray Inspection Equipment Product
Table 136. Cassel Messtechnik Recent Development
Table 137. Mesutronic Company Information
Table 138. Mesutronic Description and Business Overview
Table 139. Mesutronic Food Metal Detection and X-ray Inspection Equipment Sales (Units), Revenue (US$ Million), Price (K US$/Unit) and Gross Margin (2018-2023)
Table 140. Mesutronic Food Metal Detection and X-ray Inspection Equipment Product
Table 141. Mesutronic Recent Development
Table 142. Fortress Technology Company Information
Table 143. Fortress Technology Description and Business Overview
Table 144. Fortress Technology Food Metal Detection and X-ray Inspection Equipment Sales (Units), Revenue (US$ Million), Price (K US$/Unit) and Gross Margin (2018-2023)
Table 145. Fortress Technology Food Metal Detection and X-ray Inspection Equipment Product
Table 146. Fortress Technology Recent Development
Table 147. SHANAN Company Information
Table 148. SHANAN Description and Business Overview
Table 149. SHANAN Food Metal Detection and X-ray Inspection Equipment Sales (Units), Revenue (US$ Million), Price (K US$/Unit) and Gross Margin (2018-2023)
Table 150. SHANAN Food Metal Detection and X-ray Inspection Equipment Product
Table 151. SHANAN Recent Development
Table 152. JUZHENG Electronic and Technology Company Information
Table 153. JUZHENG Electronic and Technology Description and Business Overview
Table 154. JUZHENG Electronic and Technology Food Metal Detection and X-ray Inspection Equipment Sales (Units), Revenue (US$ Million), Price (K US$/Unit) and Gross Margin (2018-2023)
Table 155. JUZHENG Electronic and Technology Food Metal Detection and X-ray Inspection Equipment Product
Table 156. JUZHENG Electronic and Technology Recent Development
Table 157. Easyweigh Company Information
Table 158. Easyweigh Description and Business Overview
Table 159. Easyweigh Food Metal Detection and X-ray Inspection Equipment Sales (Units), Revenue (US$ Million), Price (K US$/Unit) and Gross Margin (2018-2023)
Table 160. Easyweigh Food Metal Detection and X-ray Inspection Equipment Product
Table 161. Easyweigh Recent Development
Table 162. Key Raw Materials Lists
Table 163. Raw Materials Key Suppliers Lists
Table 164. Food Metal Detection and X-ray Inspection Equipment Customers List
Table 165. Food Metal Detection and X-ray Inspection Equipment Distributors List
Table 166. Research Programs/Design for This Report
Table 167. Key Data Information from Secondary Sources
Table 168. Key Data Information from Primary Sources
List of Figures
Figure 1. Food Metal Detection and X-ray Inspection Equipment Product Picture
Figure 2. Global Food Metal Detection and X-ray Inspection Equipment Revenue, (US$ Million), 2018 VS 2022 VS 2029
Figure 3. Global Food Metal Detection and X-ray Inspection Equipment Market Size 2018-2029 (US$ Million)
Figure 4. Global Food Metal Detection and X-ray Inspection Equipment Sales 2018-2029 (Units)
Figure 5. India Food Metal Detection and X-ray Inspection Equipment Revenue, (US$ Million), 2018 VS 2022 VS 2029
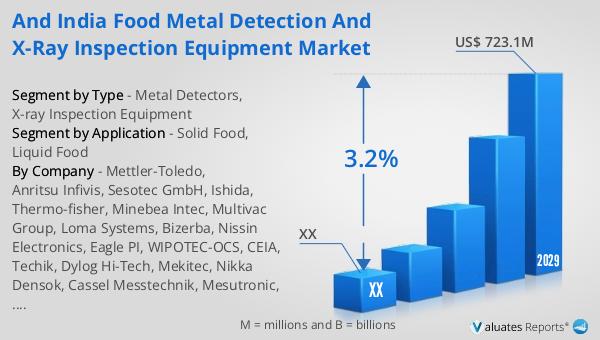
Figure 6. India Food Metal Detection and X-ray Inspection Equipment Market Size 2018-2029 (US$ Million)
Figure 7. India Food Metal Detection and X-ray Inspection Equipment Sales 2018-2029 (Units)
Figure 8. India Food Metal Detection and X-ray Inspection Equipment Market Share in Global, in Value (US$ Million) 2018-2029
Figure 9. India Food Metal Detection and X-ray Inspection Equipment Market Share in Global, in Volume (Units) 2018-2029
Figure 10. Food Metal Detection and X-ray Inspection Equipment Report Years Considered
Figure 11. Product Picture of Metal Detectors
Figure 12. Product Picture of X-ray Inspection Equipment
Figure 13. Global Food Metal Detection and X-ray Inspection Equipment Market Share by Type in 2022 & 2029
Figure 14. Global Food Metal Detection and X-ray Inspection Equipment Sales in Value by Type (2018-2029) & (US$ Million)
Figure 15. Global Food Metal Detection and X-ray Inspection Equipment Sales Market Share in Value by Type (2018-2029)
Figure 16. Global Food Metal Detection and X-ray Inspection Equipment Sales by Type (2018-2029) & (Units)
Figure 17. Global Food Metal Detection and X-ray Inspection Equipment Sales Market Share in Volume by Type (2018-2029)
Figure 18. Global Food Metal Detection and X-ray Inspection Equipment Price by Type (2018-2029) & (K US$/Unit)
Figure 19. India Food Metal Detection and X-ray Inspection Equipment Market Share by Type in 2022 & 2029
Figure 20. India Food Metal Detection and X-ray Inspection Equipment Sales in Value by Type (2018-2029) & (US$ Million)
Figure 21. India Food Metal Detection and X-ray Inspection Equipment Sales Market Share in Value by Type (2018-2029)
Figure 22. India Food Metal Detection and X-ray Inspection Equipment Sales by Type (2018-2029) & (Units)
Figure 23. India Food Metal Detection and X-ray Inspection Equipment Sales Market Share in Volume by Type (2018-2029)
Figure 24. India Food Metal Detection and X-ray Inspection Equipment Price by Type (2018-2029) & (K US$/Unit)
Figure 25. Product Picture of Solid Food
Figure 26. Product Picture of Liquid Food
Figure 27. Global Food Metal Detection and X-ray Inspection Equipment Market Share by Application in 2022 & 2029
Figure 28. Global Food Metal Detection and X-ray Inspection Equipment Sales in Value by Application (2018-2029) & (US$ Million)
Figure 29. Global Food Metal Detection and X-ray Inspection Equipment Sales Market Share in Value by Application (2018-2029)
Figure 30. Global Food Metal Detection and X-ray Inspection Equipment Sales by Application (2018-2029) & (Units)
Figure 31. Global Food Metal Detection and X-ray Inspection Equipment Sales Market Share in Volume by Application (2018-2029)
Figure 32. Global Food Metal Detection and X-ray Inspection Equipment Price by Application (2018-2029) & (K US$/Unit)
Figure 33. India Food Metal Detection and X-ray Inspection Equipment Market Share by Application in 2022 & 2029
Figure 34. India Food Metal Detection and X-ray Inspection Equipment Sales in Value by Application (2018-2029) & (US$ Million)
Figure 35. India Food Metal Detection and X-ray Inspection Equipment Sales Market Share in Value by Application (2018-2029)
Figure 36. India Food Metal Detection and X-ray Inspection Equipment Sales by Application (2018-2029) & (Units)
Figure 37. India Food Metal Detection and X-ray Inspection Equipment Sales Market Share in Volume by Application (2018-2029)
Figure 38. India Food Metal Detection and X-ray Inspection Equipment Price by Application (2018-2029) & (K US$/Unit)
Figure 39. Americas Food Metal Detection and X-ray Inspection Equipment Sales in Volume Growth Rate 2018-2029 (Units)
Figure 40. Americas Food Metal Detection and X-ray Inspection Equipment Sales in Value Growth Rate 2018-2029 (US$ Million)
Figure 41. Americas Food Metal Detection and X-ray Inspection Equipment Sales by Type (2018-2029) & (Units)
Figure 42. Americas Food Metal Detection and X-ray Inspection Equipment Sales Market Share in Volume by Type (2018-2029)
Figure 43. Americas Food Metal Detection and X-ray Inspection Equipment Sales by Application (2018-2029) & (Units)
Figure 44. Americas Food Metal Detection and X-ray Inspection Equipment Sales Market Share in Volume by Application (2018-2029)
Figure 45. United States Food Metal Detection and X-ray Inspection Equipment Sales in Value Growth Rate (2018-2029) & (US$ Million)
Figure 46. Canada Food Metal Detection and X-ray Inspection Equipment Sales in Value Growth Rate (2018-2029) & (US$ Million)
Figure 47. Mexico Food Metal Detection and X-ray Inspection Equipment Sales in Value Growth Rate (2018-2029) & (US$ Million)
Figure 48. Brazil Food Metal Detection and X-ray Inspection Equipment Sales in Value Growth Rate (2018-2029) & (US$ Million)
Figure 49. EMEA Food Metal Detection and X-ray Inspection Equipment Sales in Volume Growth Rate 2018-2029 (Units)
Figure 50. EMEA Food Metal Detection and X-ray Inspection Equipment Sales in Value Growth Rate 2018-2029 (US$ Million)
Figure 51. EMEA Food Metal Detection and X-ray Inspection Equipment Sales by Type (2018-2029) & (Units)
Figure 52. EMEA Food Metal Detection and X-ray Inspection Equipment Sales Market Share in Volume by Type (2018-2029)
Figure 53. EMEA Food Metal Detection and X-ray Inspection Equipment Sales by Application (2018-2029) & (Units)
Figure 54. EMEA Food Metal Detection and X-ray Inspection Equipment Sales Market Share in Volume by Application (2018-2029)
Figure 55. Europe Food Metal Detection and X-ray Inspection Equipment Sales in Value Growth Rate (2018-2029) & (US$ Million)
Figure 56. Middle East Food Metal Detection and X-ray Inspection Equipment Sales in Value Growth Rate (2018-2029) & (US$ Million)
Figure 57. Africa Food Metal Detection and X-ray Inspection Equipment Sales in Value Growth Rate (2018-2029) & (US$ Million)
Figure 58. China Food Metal Detection and X-ray Inspection Equipment Sales in Volume Growth Rate 2018-2029 (Units)
Figure 59. China Food Metal Detection and X-ray Inspection Equipment Sales in Value Growth Rate 2018-2029 (US$ Million)
Figure 60. China Food Metal Detection and X-ray Inspection Equipment Sales by Type (2018-2029) & (Units)
Figure 61. China Food Metal Detection and X-ray Inspection Equipment Sales Market Share in Volume by Type (2018-2029)
Figure 62. China Food Metal Detection and X-ray Inspection Equipment Sales by Application (2018-2029) & (Units)
Figure 63. China Food Metal Detection and X-ray Inspection Equipment Sales Market Share in Volume by Application (2018-2029)
Figure 64. APAC Food Metal Detection and X-ray Inspection Equipment Sales in Volume Growth Rate 2018-2029 (Units)
Figure 65. APAC Food Metal Detection and X-ray Inspection Equipment Sales in Value Growth Rate 2018-2029 (US$ Million)
Figure 66. APAC Food Metal Detection and X-ray Inspection Equipment Sales by Type (2018-2029) & (Units)
Figure 67. APAC Food Metal Detection and X-ray Inspection Equipment Sales Market Share in Volume by Type (2018-2029)
Figure 68. APAC Food Metal Detection and X-ray Inspection Equipment Sales by Application (2018-2029) & (Units)
Figure 69. APAC Food Metal Detection and X-ray Inspection Equipment Sales Market Share in Volume by Application (2018-2029)
Figure 70. Japan Food Metal Detection and X-ray Inspection Equipment Sales in Value Growth Rate (2018-2029) & (US$ Million)
Figure 71. South Korea Food Metal Detection and X-ray Inspection Equipment Sales in Value Growth Rate (2018-2029) & (US$ Million)
Figure 72. China Taiwan Food Metal Detection and X-ray Inspection Equipment Sales in Value Growth Rate (2018-2029) & (US$ Million)
Figure 73. Southeast Asia Food Metal Detection and X-ray Inspection Equipment Sales in Value Growth Rate (2018-2029) & (US$ Million)
Figure 74. India Food Metal Detection and X-ray Inspection Equipment Sales in Value Growth Rate (2018-2029) & (US$ Million)
Figure 75. Food Metal Detection and X-ray Inspection Equipment Value Chain
Figure 76. Food Metal Detection and X-ray Inspection Equipment Production Process
Figure 77. Channels of Distribution
Figure 78. Distributors Profiles
Figure 79. Bottom-up and Top-down Approaches for This Report
Figure 80. Data Triangulation
Figure 81. Key Executives Interviewed