List of Tables
Table 1. Global Shrimps Disease Diagnostic Market Size Growth Rate by Type (US$ Million), 2019 VS 2023 VS 2030
Table 2. Key Players of WSSV (White Spot Syndrome Virus)
Table 3. Key Players of TSV (Taura Syndrome Virus)
Table 4. Key Players of YHV/GAV (Yellow Head/Gill Associated Virus)
Table 5. Key Players of IHHNV (Infectious Hypodermal and Hematopoietic Virus)
Table 6. Key Players of HPV (Hepatopancreatic Parvovirus)
Table 7. Key Players of MBV (Monodon Baculovirus)
Table 8. Key Players of IMNV (Infectious Myonecrosis Virus)
Table 9. Key Players of NHP-B (Necrotising Hepatopancreatitis Bacteria)
Table 10. Key Players of MoV (Mourilyan Virus)
Table 11. Key Players of Early Mortality Syndrome (EMS)
Table 12. Global Shrimps Disease Diagnostic Market Size Growth Rate by Application (US$ Million), 2019 VS 2023 VS 2030
Table 13. Global Shrimps Disease Diagnostic Market Size Growth Rate (CAGR) by Region (US$ Million): 2019 VS 2023 VS 2030
Table 14. Global Shrimps Disease Diagnostic Market Size by Region (2019-2024) & (US$ Million)
Table 15. Global Shrimps Disease Diagnostic Market Share by Region (2019-2024)
Table 16. Global Shrimps Disease Diagnostic Forecasted Market Size by Region (2025-2030) & (US$ Million)
Table 17. Global Shrimps Disease Diagnostic Market Share by Region (2025-2030)
Table 18. Shrimps Disease Diagnostic Market Trends
Table 19. Shrimps Disease Diagnostic Market Drivers
Table 20. Shrimps Disease Diagnostic Market Challenges
Table 21. Shrimps Disease Diagnostic Market Restraints
Table 22. Global Shrimps Disease Diagnostic Revenue by Players (2019-2024) & (US$ Million)
Table 23. Global Shrimps Disease Diagnostic Revenue Share by Players (2019-2024)
Table 24. Global Top Shrimps Disease Diagnostic by Company Type (Tier 1, Tier 2, and Tier 3) & (based on the Revenue in Shrimps Disease Diagnostic as of 2023)
Table 25. Global Shrimps Disease Diagnostic Industry Ranking 2022 VS 2023 VS 2024
Table 26. Global 5 Largest Players Market Share by Shrimps Disease Diagnostic Revenue (CR5 and HHI) & (2019-2024)
Table 27. Global Key Players of Shrimps Disease Diagnostic, Headquarters and Area Served
Table 28. Global Key Players of Shrimps Disease Diagnostic, Product and Application
Table 29. Global Key Players of Shrimps Disease Diagnostic, Product and Application
Table 30. Mergers & Acquisitions, Expansion Plans
Table 31. Global Shrimps Disease Diagnostic Market Size by Type (2019-2024) & (US$ Million)
Table 32. Global Shrimps Disease Diagnostic Revenue Market Share by Type (2019-2024)
Table 33. Global Shrimps Disease Diagnostic Forecasted Market Size by Type (2025-2030) & (US$ Million)
Table 34. Global Shrimps Disease Diagnostic Revenue Market Share by Type (2025-2030)
Table 35. Global Shrimps Disease Diagnostic Market Size by Application (2019-2024) & (US$ Million)
Table 36. Global Shrimps Disease Diagnostic Revenue Share by Application (2019-2024)
Table 37. Global Shrimps Disease Diagnostic Forecasted Market Size by Application (2025-2030) & (US$ Million)
Table 38. Global Shrimps Disease Diagnostic Revenue Share by Application (2025-2030)
Table 39. North America Shrimps Disease Diagnostic Market Size by Type (2019-2024) & (US$ Million)
Table 40. North America Shrimps Disease Diagnostic Market Size by Type (2025-2030) & (US$ Million)
Table 41. North America Shrimps Disease Diagnostic Market Size by Application (2019-2024) & (US$ Million)
Table 42. North America Shrimps Disease Diagnostic Market Size by Application (2025-2030) & (US$ Million)
Table 43. North America Shrimps Disease Diagnostic Growth Rate (CAGR) by Country (US$ Million): 2019 VS 2023 VS 2030
Table 44. North America Shrimps Disease Diagnostic Market Size by Country (2019-2024) & (US$ Million)
Table 45. North America Shrimps Disease Diagnostic Market Size by Country (2025-2030) & (US$ Million)
Table 46. Europe Shrimps Disease Diagnostic Market Size by Type (2019-2024) & (US$ Million)
Table 47. Europe Shrimps Disease Diagnostic Market Size by Type (2025-2030) & (US$ Million)
Table 48. Europe Shrimps Disease Diagnostic Market Size by Application (2019-2024) & (US$ Million)
Table 49. Europe Shrimps Disease Diagnostic Market Size by Application (2025-2030) & (US$ Million)
Table 50. Europe Shrimps Disease Diagnostic Growth Rate (CAGR) by Country (US$ Million): 2019 VS 2023 VS 2030
Table 51. Europe Shrimps Disease Diagnostic Market Size by Country (2019-2024) & (US$ Million)
Table 52. Europe Shrimps Disease Diagnostic Market Size by Country (2025-2030) & (US$ Million)
Table 53. China Shrimps Disease Diagnostic Market Size by Type (2019-2024) & (US$ Million)
Table 54. China Shrimps Disease Diagnostic Market Size by Type (2025-2030) & (US$ Million)
Table 55. China Shrimps Disease Diagnostic Market Size by Application (2019-2024) & (US$ Million)
Table 56. China Shrimps Disease Diagnostic Market Size by Application (2025-2030) & (US$ Million)
Table 57. Asia Shrimps Disease Diagnostic Market Size by Type (2019-2024) & (US$ Million)
Table 58. Asia Shrimps Disease Diagnostic Market Size by Type (2025-2030) & (US$ Million)
Table 59. Asia Shrimps Disease Diagnostic Market Size by Application (2019-2024) & (US$ Million)
Table 60. Asia Shrimps Disease Diagnostic Market Size by Application (2025-2030) & (US$ Million)
Table 61. Asia Shrimps Disease Diagnostic Growth Rate (CAGR) by Region (US$ Million): 2019 VS 2023 VS 2030
Table 62. Asia Shrimps Disease Diagnostic Market Size by Region (2019-2024) & (US$ Million)
Table 63. Asia Shrimps Disease Diagnostic Market Size by Region (2025-2030) & (US$ Million)
Table 64. Middle East, Africa, and Latin America Shrimps Disease Diagnostic Market Size by Type (2019-2024) & (US$ Million)
Table 65. Middle East, Africa, and Latin America Shrimps Disease Diagnostic Market Size by Type (2025-2030) & (US$ Million)
Table 66. Middle East, Africa, and Latin America Shrimps Disease Diagnostic Market Size by Application (2019-2024) & (US$ Million)
Table 67. Middle East, Africa, and Latin America Shrimps Disease Diagnostic Market Size by Application (2025-2030) & (US$ Million)
Table 68. Middle East, Africa, and Latin America Shrimps Disease Diagnostic Growth Rate (CAGR) by Country (US$ Million): 2019 VS 2023 VS 2030
Table 69. Middle East, Africa, and Latin America Shrimps Disease Diagnostic Market Size by Country (2019-2024) & (US$ Million)
Table 70. Middle East, Africa, and Latin America Shrimps Disease Diagnostic Market Size by Country (2025-2030) & (US$ Million)
Table 71. HiMedia Laboratories Company Details
Table 72. HiMedia Laboratories Business Overview
Table 73. HiMedia Laboratories Shrimps Disease Diagnostic Product
Table 74. HiMedia Laboratories Revenue in Shrimps Disease Diagnostic Business (2019-2024) & (US$ Million)
Table 75. HiMedia Laboratories Recent Developments
Table 76. Speedy Assay Sdn Bhd Company Details
Table 77. Speedy Assay Sdn Bhd Business Overview
Table 78. Speedy Assay Sdn Bhd Shrimps Disease Diagnostic Product
Table 79. Speedy Assay Sdn Bhd Revenue in Shrimps Disease Diagnostic Business (2019-2024) & (US$ Million)
Table 80. Speedy Assay Sdn Bhd Recent Developments
Table 81. REAGEN LLC Company Details
Table 82. REAGEN LLC Business Overview
Table 83. REAGEN LLC Shrimps Disease Diagnostic Product
Table 84. REAGEN LLC Revenue in Shrimps Disease Diagnostic Business (2019-2024) & (US$ Million)
Table 85. REAGEN LLC Recent Developments
Table 86. FUJIKURA KASEI CO., LTD Company Details
Table 87. FUJIKURA KASEI CO., LTD Business Overview
Table 88. FUJIKURA KASEI CO., LTD Shrimps Disease Diagnostic Product
Table 89. FUJIKURA KASEI CO., LTD Revenue in Shrimps Disease Diagnostic Business (2019-2024) & (US$ Million)
Table 90. FUJIKURA KASEI CO., LTD Recent Developments
Table 91. GeneReach Biotechnology Corp Company Details
Table 92. GeneReach Biotechnology Corp Business Overview
Table 93. GeneReach Biotechnology Corp Shrimps Disease Diagnostic Product
Table 94. GeneReach Biotechnology Corp Revenue in Shrimps Disease Diagnostic Business (2019-2024) & (US$ Million)
Table 95. GeneReach Biotechnology Corp Recent Developments
Table 96. Thermo Fisher Scientific Company Details
Table 97. Thermo Fisher Scientific Business Overview
Table 98. Thermo Fisher Scientific Shrimps Disease Diagnostic Product
Table 99. Thermo Fisher Scientific Revenue in Shrimps Disease Diagnostic Business (2019-2024) & (US$ Million)
Table 100. Thermo Fisher Scientific Recent Developments
Table 101. Lab - Ind Resource Sdn Bhd Company Details
Table 102. Lab - Ind Resource Sdn Bhd Business Overview
Table 103. Lab - Ind Resource Sdn Bhd Shrimps Disease Diagnostic Product
Table 104. Lab - Ind Resource Sdn Bhd Revenue in Shrimps Disease Diagnostic Business (2019-2024) & (US$ Million)
Table 105. Lab - Ind Resource Sdn Bhd Recent Developments
Table 106. AquaBounty Technologies, Inc Company Details
Table 107. AquaBounty Technologies, Inc Business Overview
Table 108. AquaBounty Technologies, Inc Shrimps Disease Diagnostic Product
Table 109. AquaBounty Technologies, Inc Revenue in Shrimps Disease Diagnostic Business (2019-2024) & (US$ Million)
Table 110. AquaBounty Technologies, Inc Recent Developments
Table 111. pop bio Company Details
Table 112. pop bio Business Overview
Table 113. pop bio Shrimps Disease Diagnostic Product
Table 114. pop bio Revenue in Shrimps Disease Diagnostic Business (2019-2024) & (US$ Million)
Table 115. pop bio Recent Developments
Table 116. SUREBIO Company Details
Table 117. SUREBIO Business Overview
Table 118. SUREBIO Shrimps Disease Diagnostic Product
Table 119. SUREBIO Revenue in Shrimps Disease Diagnostic Business (2019-2024) & (US$ Million)
Table 120. SUREBIO Recent Developments
Table 121. Auro Biotechnologies Company Details
Table 122. Auro Biotechnologies Business Overview
Table 123. Auro Biotechnologies Shrimps Disease Diagnostic Product
Table 124. Auro Biotechnologies Revenue in Shrimps Disease Diagnostic Business (2019-2024) & (US$ Million)
Table 125. Auro Biotechnologies Recent Developments
Table 126. Research Programs/Design for This Report
Table 127. Key Data Information from Secondary Sources
Table 128. Key Data Information from Primary Sources
List of Figures
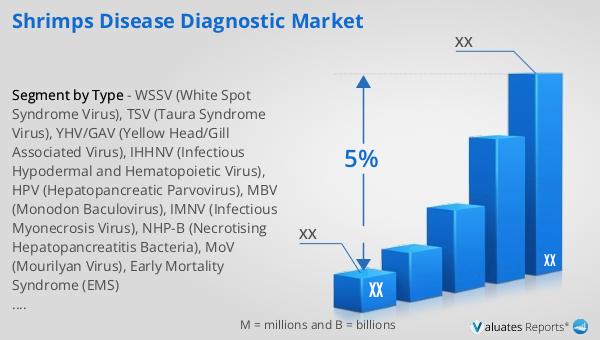
Figure 1. Global Shrimps Disease Diagnostic Market Size Growth Rate by Type, 2019 VS 2023 VS 2030 (US$ Million)
Figure 2. Global Shrimps Disease Diagnostic Market Share by Type: 2023 VS 2030
Figure 3. WSSV (White Spot Syndrome Virus) Features
Figure 4. TSV (Taura Syndrome Virus) Features
Figure 5. YHV/GAV (Yellow Head/Gill Associated Virus) Features
Figure 6. IHHNV (Infectious Hypodermal and Hematopoietic Virus) Features
Figure 7. HPV (Hepatopancreatic Parvovirus) Features
Figure 8. MBV (Monodon Baculovirus) Features
Figure 9. IMNV (Infectious Myonecrosis Virus) Features
Figure 10. NHP-B (Necrotising Hepatopancreatitis Bacteria) Features
Figure 11. MoV (Mourilyan Virus) Features
Figure 12. Early Mortality Syndrome (EMS) Features
Figure 13. Global Shrimps Disease Diagnostic Market Size Growth Rate by Application, 2019 VS 2023 VS 2030 (US$ Million)
Figure 14. Global Shrimps Disease Diagnostic Market Share by Application: 2023 VS 2030
Figure 15. Fisheries Case Studies
Figure 16. Aquaculture Laboratories Case Studies
Figure 17. Marine Laboratories Case Studies
Figure 18. Education and Research Institutes Case Studies
Figure 19. Others Case Studies
Figure 20. Shrimps Disease Diagnostic Report Years Considered
Figure 21. Global Shrimps Disease Diagnostic Market Size (US$ Million), Year-over-Year: 2019-2030
Figure 22. Global Shrimps Disease Diagnostic Market Size, (US$ Million), 2019 VS 2023 VS 2030
Figure 23. Global Shrimps Disease Diagnostic Market Share by Region: 2023 VS 2030
Figure 24. Global Shrimps Disease Diagnostic Market Share by Players in 2023
Figure 25. Global Top Shrimps Disease Diagnostic Players by Company Type (Tier 1, Tier 2, and Tier 3) & (based on the Revenue in Shrimps Disease Diagnostic as of 2023)
Figure 26. The Top 10 and 5 Players Market Share by Shrimps Disease Diagnostic Revenue in 2023
Figure 27. North America Shrimps Disease Diagnostic Market Size YoY Growth (2019-2030) & (US$ Million)
Figure 28. North America Shrimps Disease Diagnostic Market Share by Type (2019-2030)
Figure 29. North America Shrimps Disease Diagnostic Market Share by Application (2019-2030)
Figure 30. North America Shrimps Disease Diagnostic Market Share by Country (2019-2030)
Figure 31. United States Shrimps Disease Diagnostic Market Size YoY Growth (2019-2030) & (US$ Million)
Figure 32. Canada Shrimps Disease Diagnostic Market Size YoY Growth (2019-2030) & (US$ Million)
Figure 33. Europe Shrimps Disease Diagnostic Market Size YoY (2019-2030) & (US$ Million)
Figure 34. Europe Shrimps Disease Diagnostic Market Share by Type (2019-2030)
Figure 35. Europe Shrimps Disease Diagnostic Market Share by Application (2019-2030)
Figure 36. Europe Shrimps Disease Diagnostic Market Share by Country (2019-2030)
Figure 37. Germany Shrimps Disease Diagnostic Market Size YoY Growth (2019-2030) & (US$ Million)
Figure 38. France Shrimps Disease Diagnostic Market Size YoY Growth (2019-2030) & (US$ Million)
Figure 39. U.K. Shrimps Disease Diagnostic Market Size YoY Growth (2019-2030) & (US$ Million)
Figure 40. Italy Shrimps Disease Diagnostic Market Size YoY Growth (2019-2030) & (US$ Million)
Figure 41. Russia Shrimps Disease Diagnostic Market Size YoY Growth (2019-2030) & (US$ Million)
Figure 42. Nordic Countries Shrimps Disease Diagnostic Market Size YoY Growth (2019-2030) & (US$ Million)
Figure 43. China Shrimps Disease Diagnostic Market Size YoY (2019-2030) & (US$ Million)
Figure 44. China Shrimps Disease Diagnostic Market Share by Type (2019-2030)
Figure 45. China Shrimps Disease Diagnostic Market Share by Application (2019-2030)
Figure 46. Asia Shrimps Disease Diagnostic Market Size YoY (2019-2030) & (US$ Million)
Figure 47. Asia Shrimps Disease Diagnostic Market Share by Type (2019-2030)
Figure 48. Asia Shrimps Disease Diagnostic Market Share by Application (2019-2030)
Figure 49. Asia Shrimps Disease Diagnostic Market Share by Region (2019-2030)
Figure 50. Japan Shrimps Disease Diagnostic Market Size YoY Growth (2019-2030) & (US$ Million)
Figure 51. South Korea Shrimps Disease Diagnostic Market Size YoY Growth (2019-2030) & (US$ Million)
Figure 52. China Taiwan Shrimps Disease Diagnostic Market Size YoY Growth (2019-2030) & (US$ Million)
Figure 53. Southeast Asia Shrimps Disease Diagnostic Market Size YoY Growth (2019-2030) & (US$ Million)
Figure 54. India Shrimps Disease Diagnostic Market Size YoY Growth (2019-2030) & (US$ Million)
Figure 55. Australia Shrimps Disease Diagnostic Market Size YoY Growth (2019-2030) & (US$ Million)
Figure 56. Middle East, Africa, and Latin America Shrimps Disease Diagnostic Market Size YoY (2019-2030) & (US$ Million)
Figure 57. Middle East, Africa, and Latin America Shrimps Disease Diagnostic Market Share by Type (2019-2030)
Figure 58. Middle East, Africa, and Latin America Shrimps Disease Diagnostic Market Share by Application (2019-2030)
Figure 59. Middle East, Africa, and Latin America Shrimps Disease Diagnostic Market Share by Country (2019-2030)
Figure 60. Brazil Shrimps Disease Diagnostic Market Size YoY Growth (2019-2030) & (US$ Million)
Figure 61. Mexico Shrimps Disease Diagnostic Market Size YoY Growth (2019-2030) & (US$ Million)
Figure 62. Turkey Shrimps Disease Diagnostic Market Size YoY Growth (2019-2030) & (US$ Million)
Figure 63. Saudi Arabia Shrimps Disease Diagnostic Market Size YoY Growth (2019-2030) & (US$ Million)
Figure 64. Israel Shrimps Disease Diagnostic Market Size YoY Growth (2019-2030) & (US$ Million)
Figure 65. GCC Countries Shrimps Disease Diagnostic Market Size YoY Growth (2019-2030) & (US$ Million)
Figure 66. HiMedia Laboratories Revenue Growth Rate in Shrimps Disease Diagnostic Business (2019-2024)
Figure 67. Speedy Assay Sdn Bhd Revenue Growth Rate in Shrimps Disease Diagnostic Business (2019-2024)
Figure 68. REAGEN LLC Revenue Growth Rate in Shrimps Disease Diagnostic Business (2019-2024)
Figure 69. FUJIKURA KASEI CO., LTD Revenue Growth Rate in Shrimps Disease Diagnostic Business (2019-2024)
Figure 70. GeneReach Biotechnology Corp Revenue Growth Rate in Shrimps Disease Diagnostic Business (2019-2024)
Figure 71. Thermo Fisher Scientific Revenue Growth Rate in Shrimps Disease Diagnostic Business (2019-2024)
Figure 72. Lab - Ind Resource Sdn Bhd Revenue Growth Rate in Shrimps Disease Diagnostic Business (2019-2024)
Figure 73. AquaBounty Technologies, Inc Revenue Growth Rate in Shrimps Disease Diagnostic Business (2019-2024)
Figure 74. pop bio Revenue Growth Rate in Shrimps Disease Diagnostic Business (2019-2024)
Figure 75. SUREBIO Revenue Growth Rate in Shrimps Disease Diagnostic Business (2019-2024)
Figure 76. Auro Biotechnologies Revenue Growth Rate in Shrimps Disease Diagnostic Business (2019-2024)
Figure 77. Bottom-up and Top-down Approaches for This Report
Figure 78. Data Triangulation
Figure 79. Key Executives Interviewed