0
U.S. (TOLL FREE)
+1 (315) 215-3225
Automative

0
U.S. (TOLL FREE)
+1 (315) 215-3225
Contract Logistics Market Size, Share, Competitive Landscape and Trend Analysis Report by Service (Transportation, Warehousing, Distribution, Aftermarket Logistics), by Type (Insourcing, Outsourcing), by Industry Vertical (Retail, E-Commerce, Aerospace, Automotive, Industrial, High-tech, Pharma and healthcare, Others), by Mode of Transportation (Railways, Airways, Roadways, Waterways): Global Opportunity Analysis and Industry Forecast, 2022-2031
Published Date: November 2023
|
Report Code: ALLI-Manu-0S93
Home | Market Reports | Business & Industrial| Transportation & Logistics
Contract Logistics Market
BUY CHAPTERS

Contract Logistics Market Size, Share, Competitive Landscape and Trend Analysis Report by Service (Transportation, Warehousing, Distribution, Aftermarket Logistics), by Type (Insourcing, Outsourcing), by Industry Vertical (Retail, E-Commerce, Aerospace, Automotive, Industrial, High-tech, Pharma and healthcare, Others), by Mode of Transportation (Railways, Airways, Roadways, Waterways): Global Opportunity Analysis and Industry Forecast, 2022-2031

Code: ALLI-Manu-0S93
Report
November 2023
Pages:356
Allied Market Research
Buy Now with 15% Discount
DESCRIPTION
TABLE OF CONTENT
TABLES & FIGURES

Contract Logistics Market 

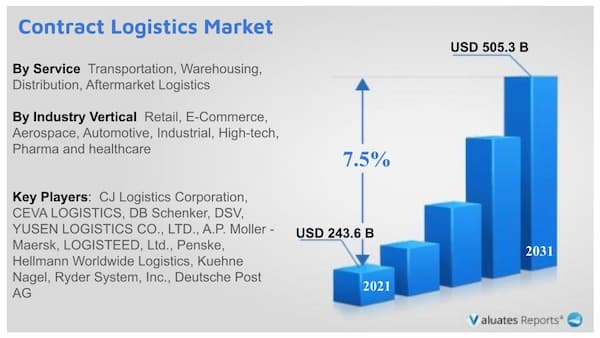
The global contract logistics market size was valued at USD 243.6 Billion in 2021, and is projected to reach USD 505.3 Billion by 2031, growing at a CAGR of 7.5% from 2022 to 2031.

contract Logistics Market

Logistics refers to the flow of goods from one place to another. Contract Logistics is defined as the comprehensive process from production to distribution at the final point of sale. It is a broader course of action that integrates conventional logistics with supply chain management processes. The companies that operate in the contract logistics industry handle activities such as supply chain management, warehousing, transporting & distributing goods, processing orders & collecting payments, managing inventory, and even providing certain aspects of customer service. This refers to the outsourcing of resource management tasks to third-party service providers.

Currently, the market requires a wide range of services and precise logistics practices. Therefore, contract logistics has become an ideal solution for companies that wish to monitor and manage their operations. For instance, in December 2021, A.P. Moller – Maersk one of contract logistics market leader announced the signing of an international freight supply chain management partnership with Unilever, which is a significant player in the FMCG space to combine the execution of its global ocean and air transport, intending to enhance visibility, increase efficiency, and drive reductions in emissions across its operations. 

The contract logistics industry is estimated to witness significant growth, owing to increase in trade activities across the world, surge in trade related contracts, and technological advancements in the transportation sector during the forecast period. In addition, the contract logistics market growth is linked to the advancement of the flow of foreign trade and the current economic climate. It involves integrating information, transport, inventory, warehousing, handling materials, packaging, and protection. Moreover, rise in demand for fresh consumable goods from various regional markets helps to build better trade relations within neighboring regions, thereby fueling the growth of the market during the forecast period. Furthermore, favorable government trade policies have resulted in increased demand for logistics services, thereby creating opportunities for the expansion of the market.

Moreover, aftermarket logistics services used in the logistics industry offers numerous advantages such as optimization of supply availability through forward default calculations is easily done and helps to determine the reliable stock volume & on-time deliveries. In addition, the aftermarket logistics services offer full control of the value chain as well as the internal storage cost is reduced overall. These factors create many opportunities for the growth of the global market. In addition, introduction of distribution services in logistics offers numerous advantages such as reduction of distribution cost, optimization of financial resources, price stabilization and numerous other benefits. Further, the increased inclination toward owing a distribution service in a logistics industry offers huge profit to the owner which eventually proves to be a factor supplementing the growth of the market.

Insourcing is the process of adding a new stock of goods within the portfolio of the company. This includes online campaigns designed by the company, social media marketing and other sources through which the consumption of products is increased. It is frequently used in the logistics sector, has many benefits including improved product quality control, reduced shipping costs, and the ability to distinguish products based on their manufacturing. Such offerings create opportunities for the growth of the segment in the global market.

Rise in cross-border trade & transportation activity in the country is the primary factor that drives the growth of the contract logistics market in Canada. In addition, most e-commerce companies award contracts to logistics service providers in the country for warehousing and distribution services. In 2021, there were over 27 million e-commerce users in Canada, accounting for 72.5% of the Canadian population. Increased online shoppers are leading to a continuous increase in retail e-commerce sales in Canada, both in real terms and as a proportion of total retail.

Moreover, the contract logistics market trends include increase in demand for transport services, economic development, rise in customer demand fueled by e-commerce, and surge in number of new start-ups are expected to drive the growth of the logistics market in LAMEA. Further, various expansion plans by market players to fulfill growth in demand fuel the expansion of the market. In addition, the surge in the use of information technologies (IT) solutions & software and the emergence of last-mile deliveries coupled with logistics automation provide remarkable growth opportunities for the players operating in the Latin America contract logistics market.

The factors such as expansion in the e-commerce industry, rise in trade related agreements, and growth in the manufacturing industry supplement the growth of the contract logistics market. However, poor infrastructure for logistics, higher logistics costs, and lack of control of manufacturers on logistics services are the factors expected to hamper the growth of the market. In addition, the emergence of last-mile deliveries coupled with logistics automation and a surge in the use of information technologies (IT) solutions & software creates market opportunities for the key players operating in the market.  

The contract logistics market is segmented on the basis of service, type, industry vertical, mode of transportation, and region. By service, the market is divided into transportation, warehousing, distribution, and aftermarket logistics. By type, it is bifurcated into insourcing and outsourcing. By industry vertical, it is categorized into retail, e-commerce, aerospace, automotive, industrial, high-tech, pharma & healthcare, and others. By mode of transportation, it is classified into railways, airways, roadways, and waterways. By region, it is analyzed across North America, Europe, Asia-Pacific, and LAMEA.

The leading players that operate in the contract logistics market are A.P. Moller - Maersk, Agility, CEVA Logistics AG, CJ Logistics Corporation, DB Schenker, Deutsche Post AG, DSV, GEODIS, Hellmann Worldwide Logistics, Logisteed, Ltd., Kuehne+Nagel International AG, Neovia Logistics Services, LLC, Penske, Ryder System, Inc., United Parcel Service, Inc. (UPS), XPO Logistics, Inc., and Yusen Logistics Co., Ltd. Business expansion, partnership, agreement, and acquisition are the extensively adopted strategies among the market players, followed by collaboration and product launch. 

Growth in the e-commerce industry

E-commerce refers to the buying and selling of goods by using the Internet. Third-party logistics service providers encompass the shipping of products to consumers. In addition, the e-commerce industry utilizes contract logistics services to manage and oversee the supply chain of e-commerce companies, which allows these companies to focus on marketing and other business operations.

Thus, due to the numerous benefits provided by logistics to the e-commerce industry, the adoption of logistics services has increased at a significant rate, which drives the growth of the contract logistics market. For instance, in January 2022, Penske collaborated with Röhlig Logistics, a provider of logistics services to form a new joint venture company called Rohlig Penske Logistics GmbH, operating primarily in Germany and the Netherlands.

This new joint venture incorporated 55,000 sqm of additional warehousing, transport management operations, and e-commerce logistics with plans to accelerate additional growth across Europe. Furthermore, in September 2020, the e-commerce giant Mercado Libre bought a minority stake in Kangu, a Brazilian logistics startup to boost e-commerce. Kangu enables small retailers to collect and withdraw products purchased via e-commerce. Thus, the growth in e-commerce sector is expected to propel the growth of the market.

Rise in trade related agreements

Dynamic market conditions and improvement in the global economy are the key factors that drive globalization. Owing to rise in globalization, various trade-related activities have witnessed an increase. Therefore, it has become difficult for manufacturers or retailers to keep track of these activities efficiently.

Contract logistics services are vital for price-sensitive customers who require a wider choice of high-quality products with timely delivery. This factor is expected to drive the contract logistics market growth for key players. Moreover, the development of the overseas market is a significant factor that fuels the market's growth. For instance, in 2019, Nepal and China signed the Protocol on Implementing Agreement on Transit and Transport along with 6 other agreements to enable Nepal to access Chinese sea and land ports. China has agreed to let Nepal use Tianjin, Shenzhen, Lianyungang, & Zhanjiang open seaports; and Lanzhou, Lhasa, & Xigatse dry ports for trading with other countries. Thus, an increase in trading activities due to globalization fuels the growth of the market.

Poor infrastructure and higher logistics costs

Contract logistics demand good infrastructure, supply chain, and trade facilitation. Without these, firms have to build up more stock reserves and working capital, which can strongly affect national and regional competitiveness due to high financial costs. In addition, the lack of infrastructure hinders the market as it increases costs and reduces supply chain reliability. These include significant inefficiencies in transport, poor condition of storage infrastructure, complex tax structure, low rate of technology adoption, and poor skills of logistics professionals. For instance, according to a report by the Economist, an international newspaper, Latin America lacks adequate infrastructure. More than 60% of the region’s roads are unpaved. Thus, due to poor transport infrastructure, firms need high inventories to account for contingencies, which can result in higher overall logistics costs. Therefore, factors such as poor infrastructure, high inventory prices, and insufficient warehousing space are expected to hamper the contract logistics market growth.

Emergence of last-mile deliveries coupled with logistics automation.

Last-mile logistics refers to the final step of the delivery process from a distribution center or facility to the end user. With continuous increase in proliferation of e-commerce companies, the provision of efficient last-mile deliveries has witnessed a major upswing in the contract logistics industry. Furthermore, the continuous effort of contract logistics companies to offer efficient last-mile deliveries is another opportunity expected to fuel the contract logistics market growth in the near future. For instance, in September 2021, United Parcel Service, Inc. (UPS) acquired Roadie, an on-the-way delivery service provider within the U.S. which reduced the transit times for same-day deliveries as well as last-mile delivery services across the U.S.

In addition, automation has gained traction in the logistics industry. The inception of logistics 4.0 is one of the key logistics trends opening lucrative opportunities in the contract logistics industry. For instance, in July 2020, Movile Group, a mobile commerce platform company, announced a new investment in a Colombian last-mile delivery startup Mensajeros Urbanos. It aims to expand its operations in 10 major cities in Colombia and Mexico. The company is anticipated open 50 urban warehouses within the 10 cities it serves to reduce delivery time windows further and provide certain items for same-day delivery. Hence, the emergence of last-mile deliveries coupled with logistics automation is expected to create lucrative opportunities for the contract logistics market during the forecast period.

Scope of Global Contract Logistics Market Report

Report Metric Details
Report Name Global Contract Logistics Market
Base Year 2021
Forecasted years 2022-2031
By Company CJ Logistics Corporation, CEVA LOGISTICS, DB Schenker, DSV, YUSEN LOGISTICS CO., LTD., A.P. Moller - Maersk, LOGISTEED, Ltd., Penske, Hellmann Worldwide Logistics, Kuehne Nagel, Ryder System, Inc., Deutsche Post AG, Agility, Neovia Logistics Services, LLC., XPO Logistics Inc., United Parcel Service of America, Inc., GEODIS
Segment by Mode of Transportation
  • Railways
  • Airways
  • Roadways
  • Waterways
Segment by Industry Vertical
  • Aerospace
  • Automotive
  • Industrial
  • High-tech
  • Pharma and healthcare
  • Others
  • Retail
  • E-Commerce
Segment by Type
  • Insourcing
  • Outsourcing
Segment by Service
  • Transportation
  • Warehousing
  • Distribution
  • Aftermarket Logistics
Consumption byRegion
  • North America (United States, Canada)
  • Europe (Germany, France, UK, Italy, Russia)
  • Asia-Pacific (China, Japan, South Korea, Taiwan)
  • Southeast Asia (India)
  • Latin America (Mexico, Brazil)
Forecast units USD million in value
Report coverage Revenue and volume forecast, company share, competitive landscape, growth factors and trends
  • CHAPTER 1: INTRODUCTION
    • 1.1. Report description
    • 1.2. Key market segments
    • 1.3. Key benefits to the stakeholders
    • 1.4. Research Methodology
      • 1.4.1. Primary research
      • 1.4.2. Secondary research
      • 1.4.3. Analyst tools and models
  • CHAPTER 2: EXECUTIVE SUMMARY
    • 2.1. CXO Perspective
  • CHAPTER 3: MARKET OVERVIEW
    • 3.1. Market definition and scope
    • 3.2. Key findings
      • 3.2.1. Top impacting factors
      • 3.2.2. Top investment pockets
    • 3.3. Porter’s five forces analysis
      • 3.3.1. Bargaining power of suppliers
      • 3.3.2. Bargaining power of buyers
      • 3.3.3. Threat of substitutes
      • 3.3.4. Threat of new entrants
      • 3.3.5. Intensity of rivalry
    • 3.4. Market dynamics
        • 3.4.1. Drivers
          • 3.4.1.1. Growth in e-commerce industry
          • 3.4.1.2. Rise in trade related agreements
          • 3.4.1.3. Growth in manufacturing industry


        • 3.4.2. Restraints
          • 3.4.2.1. Poor infrastructure and higher logistics costs
          • 3.4.2.2. Lack of control of manufacturers on logistics service


        • 3.4.3. Opportunities
          • 3.4.3.1. Emergence of last-mile deliveries coupled with logistics automation
          • 3.4.3.2. Surge in use of information technologies (IT) solutions & software
    • 3.5. COVID-19 Impact Analysis on the market
  • CHAPTER 4: CONTRACT LOGISTICS MARKET, BY SERVICE
    • 4.1. Overview
      • 4.1.1. Market size and forecast
    • 4.2. Transportation
      • 4.2.1. Key market trends, growth factors and opportunities
      • 4.2.2. Market size and forecast, by region
      • 4.2.3. Market share analysis by country
    • 4.3. Warehousing
      • 4.3.1. Key market trends, growth factors and opportunities
      • 4.3.2. Market size and forecast, by region
      • 4.3.3. Market share analysis by country
    • 4.4. Distribution
      • 4.4.1. Key market trends, growth factors and opportunities
      • 4.4.2. Market size and forecast, by region
      • 4.4.3. Market share analysis by country
    • 4.5. Aftermarket Logistics
      • 4.5.1. Key market trends, growth factors and opportunities
      • 4.5.2. Market size and forecast, by region
      • 4.5.3. Market share analysis by country
  • CHAPTER 5: CONTRACT LOGISTICS MARKET, BY TYPE
    • 5.1. Overview
      • 5.1.1. Market size and forecast
    • 5.2. Insourcing
      • 5.2.1. Key market trends, growth factors and opportunities
      • 5.2.2. Market size and forecast, by region
      • 5.2.3. Market share analysis by country
    • 5.3. Outsourcing
      • 5.3.1. Key market trends, growth factors and opportunities
      • 5.3.2. Market size and forecast, by region
      • 5.3.3. Market share analysis by country
  • CHAPTER 6: CONTRACT LOGISTICS MARKET, BY INDUSTRY VERTICAL
    • 6.1. Overview
      • 6.1.1. Market size and forecast
    • 6.2. Retail
      • 6.2.1. Key market trends, growth factors and opportunities
      • 6.2.2. Market size and forecast, by region
      • 6.2.3. Market share analysis by country
    • 6.3. E-Commerce
      • 6.3.1. Key market trends, growth factors and opportunities
      • 6.3.2. Market size and forecast, by region
      • 6.3.3. Market share analysis by country
    • 6.4. Aerospace
      • 6.4.1. Key market trends, growth factors and opportunities
      • 6.4.2. Market size and forecast, by region
      • 6.4.3. Market share analysis by country
    • 6.5. Automotive
      • 6.5.1. Key market trends, growth factors and opportunities
      • 6.5.2. Market size and forecast, by region
      • 6.5.3. Market share analysis by country
    • 6.6. Industrial
      • 6.6.1. Key market trends, growth factors and opportunities
      • 6.6.2. Market size and forecast, by region
      • 6.6.3. Market share analysis by country
    • 6.7. High-tech
      • 6.7.1. Key market trends, growth factors and opportunities
      • 6.7.2. Market size and forecast, by region
      • 6.7.3. Market share analysis by country
    • 6.8. Pharma and healthcare
      • 6.8.1. Key market trends, growth factors and opportunities
      • 6.8.2. Market size and forecast, by region
      • 6.8.3. Market share analysis by country
    • 6.9. Others
      • 6.9.1. Key market trends, growth factors and opportunities
      • 6.9.2. Market size and forecast, by region
      • 6.9.3. Market share analysis by country
  • CHAPTER 7: CONTRACT LOGISTICS MARKET, BY MODE OF TRANSPORTATION
    • 7.1. Overview
      • 7.1.1. Market size and forecast
    • 7.2. Railways
      • 7.2.1. Key market trends, growth factors and opportunities
      • 7.2.2. Market size and forecast, by region
      • 7.2.3. Market share analysis by country
    • 7.3. Airways
      • 7.3.1. Key market trends, growth factors and opportunities
      • 7.3.2. Market size and forecast, by region
      • 7.3.3. Market share analysis by country
    • 7.4. Roadways
      • 7.4.1. Key market trends, growth factors and opportunities
      • 7.4.2. Market size and forecast, by region
      • 7.4.3. Market share analysis by country
    • 7.5. Waterways
      • 7.5.1. Key market trends, growth factors and opportunities
      • 7.5.2. Market size and forecast, by region
      • 7.5.3. Market share analysis by country
  • CHAPTER 8: CONTRACT LOGISTICS MARKET, BY REGION
    • 8.1. Overview
      • 8.1.1. Market size and forecast By Region
    • 8.2. North America
      • 8.2.1. Key trends and opportunities
      • 8.2.2. Market size and forecast, by Service
      • 8.2.3. Market size and forecast, by Type
      • 8.2.4. Market size and forecast, by Industry Vertical
      • 8.2.5. Market size and forecast, by Mode of Transportation
      • 8.2.6. Market size and forecast, by country
        • 8.2.6.1. U.S.
          • 8.2.6.1.1. Key market trends, growth factors and opportunities
          • 8.2.6.1.2. Market size and forecast, by Service
          • 8.2.6.1.3. Market size and forecast, by Type
          • 8.2.6.1.4. Market size and forecast, by Industry Vertical
          • 8.2.6.1.5. Market size and forecast, by Mode of Transportation
        • 8.2.6.2. Canada
          • 8.2.6.2.1. Key market trends, growth factors and opportunities
          • 8.2.6.2.2. Market size and forecast, by Service
          • 8.2.6.2.3. Market size and forecast, by Type
          • 8.2.6.2.4. Market size and forecast, by Industry Vertical
          • 8.2.6.2.5. Market size and forecast, by Mode of Transportation
        • 8.2.6.3. Mexico
          • 8.2.6.3.1. Key market trends, growth factors and opportunities
          • 8.2.6.3.2. Market size and forecast, by Service
          • 8.2.6.3.3. Market size and forecast, by Type
          • 8.2.6.3.4. Market size and forecast, by Industry Vertical
          • 8.2.6.3.5. Market size and forecast, by Mode of Transportation
    • 8.3. Europe
      • 8.3.1. Key trends and opportunities
      • 8.3.2. Market size and forecast, by Service
      • 8.3.3. Market size and forecast, by Type
      • 8.3.4. Market size and forecast, by Industry Vertical
      • 8.3.5. Market size and forecast, by Mode of Transportation
      • 8.3.6. Market size and forecast, by country
        • 8.3.6.1. UK
          • 8.3.6.1.1. Key market trends, growth factors and opportunities
          • 8.3.6.1.2. Market size and forecast, by Service
          • 8.3.6.1.3. Market size and forecast, by Type
          • 8.3.6.1.4. Market size and forecast, by Industry Vertical
          • 8.3.6.1.5. Market size and forecast, by Mode of Transportation
        • 8.3.6.2. Germany
          • 8.3.6.2.1. Key market trends, growth factors and opportunities
          • 8.3.6.2.2. Market size and forecast, by Service
          • 8.3.6.2.3. Market size and forecast, by Type
          • 8.3.6.2.4. Market size and forecast, by Industry Vertical
          • 8.3.6.2.5. Market size and forecast, by Mode of Transportation
        • 8.3.6.3. France
          • 8.3.6.3.1. Key market trends, growth factors and opportunities
          • 8.3.6.3.2. Market size and forecast, by Service
          • 8.3.6.3.3. Market size and forecast, by Type
          • 8.3.6.3.4. Market size and forecast, by Industry Vertical
          • 8.3.6.3.5. Market size and forecast, by Mode of Transportation
        • 8.3.6.4. Italy
          • 8.3.6.4.1. Key market trends, growth factors and opportunities
          • 8.3.6.4.2. Market size and forecast, by Service
          • 8.3.6.4.3. Market size and forecast, by Type
          • 8.3.6.4.4. Market size and forecast, by Industry Vertical
          • 8.3.6.4.5. Market size and forecast, by Mode of Transportation
        • 8.3.6.5. Spain
          • 8.3.6.5.1. Key market trends, growth factors and opportunities
          • 8.3.6.5.2. Market size and forecast, by Service
          • 8.3.6.5.3. Market size and forecast, by Type
          • 8.3.6.5.4. Market size and forecast, by Industry Vertical
          • 8.3.6.5.5. Market size and forecast, by Mode of Transportation
        • 8.3.6.6. Rest of Europe
          • 8.3.6.6.1. Key market trends, growth factors and opportunities
          • 8.3.6.6.2. Market size and forecast, by Service
          • 8.3.6.6.3. Market size and forecast, by Type
          • 8.3.6.6.4. Market size and forecast, by Industry Vertical
          • 8.3.6.6.5. Market size and forecast, by Mode of Transportation
    • 8.4. Asia-Pacific
      • 8.4.1. Key trends and opportunities
      • 8.4.2. Market size and forecast, by Service
      • 8.4.3. Market size and forecast, by Type
      • 8.4.4. Market size and forecast, by Industry Vertical
      • 8.4.5. Market size and forecast, by Mode of Transportation
      • 8.4.6. Market size and forecast, by country
        • 8.4.6.1. China
          • 8.4.6.1.1. Key market trends, growth factors and opportunities
          • 8.4.6.1.2. Market size and forecast, by Service
          • 8.4.6.1.3. Market size and forecast, by Type
          • 8.4.6.1.4. Market size and forecast, by Industry Vertical
          • 8.4.6.1.5. Market size and forecast, by Mode of Transportation
        • 8.4.6.2. Japan
          • 8.4.6.2.1. Key market trends, growth factors and opportunities
          • 8.4.6.2.2. Market size and forecast, by Service
          • 8.4.6.2.3. Market size and forecast, by Type
          • 8.4.6.2.4. Market size and forecast, by Industry Vertical
          • 8.4.6.2.5. Market size and forecast, by Mode of Transportation
        • 8.4.6.3. India
          • 8.4.6.3.1. Key market trends, growth factors and opportunities
          • 8.4.6.3.2. Market size and forecast, by Service
          • 8.4.6.3.3. Market size and forecast, by Type
          • 8.4.6.3.4. Market size and forecast, by Industry Vertical
          • 8.4.6.3.5. Market size and forecast, by Mode of Transportation
        • 8.4.6.4. Australia
          • 8.4.6.4.1. Key market trends, growth factors and opportunities
          • 8.4.6.4.2. Market size and forecast, by Service
          • 8.4.6.4.3. Market size and forecast, by Type
          • 8.4.6.4.4. Market size and forecast, by Industry Vertical
          • 8.4.6.4.5. Market size and forecast, by Mode of Transportation
        • 8.4.6.5. Rest of Asia-Pacific
          • 8.4.6.5.1. Key market trends, growth factors and opportunities
          • 8.4.6.5.2. Market size and forecast, by Service
          • 8.4.6.5.3. Market size and forecast, by Type
          • 8.4.6.5.4. Market size and forecast, by Industry Vertical
          • 8.4.6.5.5. Market size and forecast, by Mode of Transportation
    • 8.5. LAMEA
      • 8.5.1. Key trends and opportunities
      • 8.5.2. Market size and forecast, by Service
      • 8.5.3. Market size and forecast, by Type
      • 8.5.4. Market size and forecast, by Industry Vertical
      • 8.5.5. Market size and forecast, by Mode of Transportation
      • 8.5.6. Market size and forecast, by country
        • 8.5.6.1. Latin America
          • 8.5.6.1.1. Key market trends, growth factors and opportunities
          • 8.5.6.1.2. Market size and forecast, by Service
          • 8.5.6.1.3. Market size and forecast, by Type
          • 8.5.6.1.4. Market size and forecast, by Industry Vertical
          • 8.5.6.1.5. Market size and forecast, by Mode of Transportation
        • 8.5.6.2. Middle East
          • 8.5.6.2.1. Key market trends, growth factors and opportunities
          • 8.5.6.2.2. Market size and forecast, by Service
          • 8.5.6.2.3. Market size and forecast, by Type
          • 8.5.6.2.4. Market size and forecast, by Industry Vertical
          • 8.5.6.2.5. Market size and forecast, by Mode of Transportation
        • 8.5.6.3. Africa
          • 8.5.6.3.1. Key market trends, growth factors and opportunities
          • 8.5.6.3.2. Market size and forecast, by Service
          • 8.5.6.3.3. Market size and forecast, by Type
          • 8.5.6.3.4. Market size and forecast, by Industry Vertical
          • 8.5.6.3.5. Market size and forecast, by Mode of Transportation
  • CHAPTER 9: COMPETITIVE LANDSCAPE
    • 9.1. Introduction
    • 9.2. Top winning strategies
    • 9.3. Product Mapping of Top 10 Player
    • 9.4. Competitive Dashboard
    • 9.5. Competitive Heatmap
    • 9.6. Top player positioning, 2021
  • CHAPTER 10: COMPANY PROFILES
    • 10.1. A.P. Moller - Maersk
      • 10.1.1. Company overview
      • 10.1.2. Key Executives
      • 10.1.3. Company snapshot
      • 10.1.4. Operating business segments
      • 10.1.5. Product portfolio
      • 10.1.6. Business performance
      • 10.1.7. Key strategic moves and developments
    • 10.2. Agility
      • 10.2.1. Company overview
      • 10.2.2. Key Executives
      • 10.2.3. Company snapshot
      • 10.2.4. Operating business segments
      • 10.2.5. Product portfolio
      • 10.2.6. Business performance
      • 10.2.7. Key strategic moves and developments
    • 10.3. CEVA LOGISTICS
      • 10.3.1. Company overview
      • 10.3.2. Key Executives
      • 10.3.3. Company snapshot
      • 10.3.4. Operating business segments
      • 10.3.5. Product portfolio
      • 10.3.6. Business performance
      • 10.3.7. Key strategic moves and developments
    • 10.4. DB Schenker
      • 10.4.1. Company overview
      • 10.4.2. Key Executives
      • 10.4.3. Company snapshot
      • 10.4.4. Operating business segments
      • 10.4.5. Product portfolio
      • 10.4.6. Business performance
      • 10.4.7. Key strategic moves and developments
    • 10.5. Deutsche Post AG
      • 10.5.1. Company overview
      • 10.5.2. Key Executives
      • 10.5.3. Company snapshot
      • 10.5.4. Operating business segments
      • 10.5.5. Product portfolio
      • 10.5.6. Business performance
      • 10.5.7. Key strategic moves and developments
    • 10.6. DSV
      • 10.6.1. Company overview
      • 10.6.2. Key Executives
      • 10.6.3. Company snapshot
      • 10.6.4. Operating business segments
      • 10.6.5. Product portfolio
      • 10.6.6. Business performance
      • 10.6.7. Key strategic moves and developments
    • 10.7. GEODIS
      • 10.7.1. Company overview
      • 10.7.2. Key Executives
      • 10.7.3. Company snapshot
      • 10.7.4. Operating business segments
      • 10.7.5. Product portfolio
      • 10.7.6. Business performance
      • 10.7.7. Key strategic moves and developments
    • 10.8. Hellmann Worldwide Logistics
      • 10.8.1. Company overview
      • 10.8.2. Key Executives
      • 10.8.3. Company snapshot
      • 10.8.4. Operating business segments
      • 10.8.5. Product portfolio
      • 10.8.6. Business performance
      • 10.8.7. Key strategic moves and developments
    • 10.9. LOGISTEED, Ltd.
      • 10.9.1. Company overview
      • 10.9.2. Key Executives
      • 10.9.3. Company snapshot
      • 10.9.4. Operating business segments
      • 10.9.5. Product portfolio
      • 10.9.6. Business performance
      • 10.9.7. Key strategic moves and developments
    • 10.10. Kuehne Nagel
      • 10.10.1. Company overview
      • 10.10.2. Key Executives
      • 10.10.3. Company snapshot
      • 10.10.4. Operating business segments
      • 10.10.5. Product portfolio
      • 10.10.6. Business performance
      • 10.10.7. Key strategic moves and developments
    • 10.11. Neovia Logistics Services, LLC.
      • 10.11.1. Company overview
      • 10.11.2. Key Executives
      • 10.11.3. Company snapshot
      • 10.11.4. Operating business segments
      • 10.11.5. Product portfolio
    • 10.12. Penske
      • 10.12.1. Company overview
      • 10.12.2. Key Executives
      • 10.12.3. Company snapshot
      • 10.12.4. Operating business segments
      • 10.12.5. Product portfolio
      • 10.12.6. Key strategic moves and developments
    • 10.13. Ryder System, Inc.
      • 10.13.1. Company overview
      • 10.13.2. Key Executives
      • 10.13.3. Company snapshot
      • 10.13.4. Operating business segments
      • 10.13.5. Product portfolio
      • 10.13.6. Business performance
      • 10.13.7. Key strategic moves and developments
    • 10.14. United Parcel Service of America, Inc.
      • 10.14.1. Company overview
      • 10.14.2. Key Executives
      • 10.14.3. Company snapshot
      • 10.14.4. Operating business segments
      • 10.14.5. Product portfolio
      • 10.14.6. Business performance
      • 10.14.7. Key strategic moves and developments
    • 10.15. XPO Logistics Inc.
      • 10.15.1. Company overview
      • 10.15.2. Key Executives
      • 10.15.3. Company snapshot
      • 10.15.4. Operating business segments
      • 10.15.5. Product portfolio
      • 10.15.6. Business performance
    • 10.16. YUSEN LOGISTICS CO., LTD.
      • 10.16.1. Company overview
      • 10.16.2. Key Executives
      • 10.16.3. Company snapshot
      • 10.16.4. Operating business segments
      • 10.16.5. Product portfolio
      • 10.16.6. Business performance
      • 10.16.7. Key strategic moves and developments
    • 10.17. CJ Logistics Corporation
      • 10.17.1. Company overview
      • 10.17.2. Key Executives
      • 10.17.3. Company snapshot
      • 10.17.4. Operating business segments
      • 10.17.5. Product portfolio
      • 10.17.6. Business performance
      • 10.17.7. Key strategic moves and developments
  • LIST OF TABLES
  • TABLE 01. GLOBAL CONTRACT LOGISTICS MARKET, BY SERVICE, 2021-2031 ($BILLION)
    TABLE 02. CONTRACT LOGISTICS MARKET FOR TRANSPORTATION, BY REGION, 2021-2031 ($BILLION)
    TABLE 03. CONTRACT LOGISTICS MARKET FOR WAREHOUSING, BY REGION, 2021-2031 ($BILLION)
    TABLE 04. CONTRACT LOGISTICS MARKET FOR DISTRIBUTION, BY REGION, 2021-2031 ($BILLION)
    TABLE 05. CONTRACT LOGISTICS MARKET FOR AFTERMARKET LOGISTICS, BY REGION, 2021-2031 ($BILLION)
    TABLE 06. GLOBAL CONTRACT LOGISTICS MARKET, BY TYPE, 2021-2031 ($BILLION)
    TABLE 07. CONTRACT LOGISTICS MARKET FOR INSOURCING, BY REGION, 2021-2031 ($BILLION)
    TABLE 08. CONTRACT LOGISTICS MARKET FOR OUTSOURCING, BY REGION, 2021-2031 ($BILLION)
    TABLE 09. GLOBAL CONTRACT LOGISTICS MARKET, BY INDUSTRY VERTICAL, 2021-2031 ($BILLION)
    TABLE 10. CONTRACT LOGISTICS MARKET FOR RETAIL, BY REGION, 2021-2031 ($BILLION)
    TABLE 11. CONTRACT LOGISTICS MARKET FOR E-COMMERCE, BY REGION, 2021-2031 ($BILLION)
    TABLE 12. CONTRACT LOGISTICS MARKET FOR AEROSPACE, BY REGION, 2021-2031 ($BILLION)
    TABLE 13. CONTRACT LOGISTICS MARKET FOR AUTOMOTIVE, BY REGION, 2021-2031 ($BILLION)
    TABLE 14. CONTRACT LOGISTICS MARKET FOR INDUSTRIAL, BY REGION, 2021-2031 ($BILLION)
    TABLE 15. CONTRACT LOGISTICS MARKET FOR HIGH-TECH, BY REGION, 2021-2031 ($BILLION)
    TABLE 16. CONTRACT LOGISTICS MARKET FOR PHARMA AND HEALTHCARE, BY REGION, 2021-2031 ($BILLION)
    TABLE 17. CONTRACT LOGISTICS MARKET FOR OTHERS, BY REGION, 2021-2031 ($BILLION)
    TABLE 18. GLOBAL CONTRACT LOGISTICS MARKET, BY MODE OF TRANSPORTATION, 2021-2031 ($BILLION)
    TABLE 19. CONTRACT LOGISTICS MARKET FOR RAILWAYS, BY REGION, 2021-2031 ($BILLION)
    TABLE 20. CONTRACT LOGISTICS MARKET FOR AIRWAYS, BY REGION, 2021-2031 ($BILLION)
    TABLE 21. CONTRACT LOGISTICS MARKET FOR ROADWAYS, BY REGION, 2021-2031 ($BILLION)
    TABLE 22. CONTRACT LOGISTICS MARKET FOR WATERWAYS, BY REGION, 2021-2031 ($BILLION)
    TABLE 23. CONTRACT LOGISTICS MARKET, BY REGION, 2021-2031 ($BILLION)
    TABLE 24. NORTH AMERICA CONTRACT LOGISTICS MARKET, BY SERVICE, 2021-2031 ($BILLION)
    TABLE 25. NORTH AMERICA CONTRACT LOGISTICS MARKET, BY TYPE, 2021-2031 ($BILLION)
    TABLE 26. NORTH AMERICA CONTRACT LOGISTICS MARKET, BY INDUSTRY VERTICAL, 2021-2031 ($BILLION)
    TABLE 27. NORTH AMERICA CONTRACT LOGISTICS MARKET, BY MODE OF TRANSPORTATION, 2021-2031 ($BILLION)
    TABLE 28. NORTH AMERICA CONTRACT LOGISTICS MARKET, BY COUNTRY, 2021-2031 ($BILLION)
    TABLE 29. U.S. CONTRACT LOGISTICS MARKET, BY SERVICE, 2021-2031 ($BILLION)
    TABLE 30. U.S. CONTRACT LOGISTICS MARKET, BY TYPE, 2021-2031 ($BILLION)
    TABLE 31. U.S. CONTRACT LOGISTICS MARKET, BY INDUSTRY VERTICAL, 2021-2031 ($BILLION)
    TABLE 32. U.S. CONTRACT LOGISTICS MARKET, BY MODE OF TRANSPORTATION, 2021-2031 ($BILLION)
    TABLE 33. CANADA CONTRACT LOGISTICS MARKET, BY SERVICE, 2021-2031 ($BILLION)
    TABLE 34. CANADA CONTRACT LOGISTICS MARKET, BY TYPE, 2021-2031 ($BILLION)
    TABLE 35. CANADA CONTRACT LOGISTICS MARKET, BY INDUSTRY VERTICAL, 2021-2031 ($BILLION)
    TABLE 36. CANADA CONTRACT LOGISTICS MARKET, BY MODE OF TRANSPORTATION, 2021-2031 ($BILLION)
    TABLE 37. MEXICO CONTRACT LOGISTICS MARKET, BY SERVICE, 2021-2031 ($BILLION)
    TABLE 38. MEXICO CONTRACT LOGISTICS MARKET, BY TYPE, 2021-2031 ($BILLION)
    TABLE 39. MEXICO CONTRACT LOGISTICS MARKET, BY INDUSTRY VERTICAL, 2021-2031 ($BILLION)
    TABLE 40. MEXICO CONTRACT LOGISTICS MARKET, BY MODE OF TRANSPORTATION, 2021-2031 ($BILLION)
    TABLE 41. EUROPE CONTRACT LOGISTICS MARKET, BY SERVICE, 2021-2031 ($BILLION)
    TABLE 42. EUROPE CONTRACT LOGISTICS MARKET, BY TYPE, 2021-2031 ($BILLION)
    TABLE 43. EUROPE CONTRACT LOGISTICS MARKET, BY INDUSTRY VERTICAL, 2021-2031 ($BILLION)
    TABLE 44. EUROPE CONTRACT LOGISTICS MARKET, BY MODE OF TRANSPORTATION, 2021-2031 ($BILLION)
    TABLE 45. EUROPE CONTRACT LOGISTICS MARKET, BY COUNTRY, 2021-2031 ($BILLION)
    TABLE 46. UK CONTRACT LOGISTICS MARKET, BY SERVICE, 2021-2031 ($BILLION)
    TABLE 47. UK CONTRACT LOGISTICS MARKET, BY TYPE, 2021-2031 ($BILLION)
    TABLE 48. UK CONTRACT LOGISTICS MARKET, BY INDUSTRY VERTICAL, 2021-2031 ($BILLION)
    TABLE 49. UK CONTRACT LOGISTICS MARKET, BY MODE OF TRANSPORTATION, 2021-2031 ($BILLION)
    TABLE 50. GERMANY CONTRACT LOGISTICS MARKET, BY SERVICE, 2021-2031 ($BILLION)
    TABLE 51. GERMANY CONTRACT LOGISTICS MARKET, BY TYPE, 2021-2031 ($BILLION)
    TABLE 52. GERMANY CONTRACT LOGISTICS MARKET, BY INDUSTRY VERTICAL, 2021-2031 ($BILLION)
    TABLE 53. GERMANY CONTRACT LOGISTICS MARKET, BY MODE OF TRANSPORTATION, 2021-2031 ($BILLION)
    TABLE 54. FRANCE CONTRACT LOGISTICS MARKET, BY SERVICE, 2021-2031 ($BILLION)
    TABLE 55. FRANCE CONTRACT LOGISTICS MARKET, BY TYPE, 2021-2031 ($BILLION)
    TABLE 56. FRANCE CONTRACT LOGISTICS MARKET, BY INDUSTRY VERTICAL, 2021-2031 ($BILLION)
    TABLE 57. FRANCE CONTRACT LOGISTICS MARKET, BY MODE OF TRANSPORTATION, 2021-2031 ($BILLION)
    TABLE 58. ITALY CONTRACT LOGISTICS MARKET, BY SERVICE, 2021-2031 ($BILLION)
    TABLE 59. ITALY CONTRACT LOGISTICS MARKET, BY TYPE, 2021-2031 ($BILLION)
    TABLE 60. ITALY CONTRACT LOGISTICS MARKET, BY INDUSTRY VERTICAL, 2021-2031 ($BILLION)
    TABLE 61. ITALY CONTRACT LOGISTICS MARKET, BY MODE OF TRANSPORTATION, 2021-2031 ($BILLION)
    TABLE 62. SPAIN CONTRACT LOGISTICS MARKET, BY SERVICE, 2021-2031 ($BILLION)
    TABLE 63. SPAIN CONTRACT LOGISTICS MARKET, BY TYPE, 2021-2031 ($BILLION)
    TABLE 64. SPAIN CONTRACT LOGISTICS MARKET, BY INDUSTRY VERTICAL, 2021-2031 ($BILLION)
    TABLE 65. SPAIN CONTRACT LOGISTICS MARKET, BY MODE OF TRANSPORTATION, 2021-2031 ($BILLION)
    TABLE 66. REST OF EUROPE CONTRACT LOGISTICS MARKET, BY SERVICE, 2021-2031 ($BILLION)
    TABLE 67. REST OF EUROPE CONTRACT LOGISTICS MARKET, BY TYPE, 2021-2031 ($BILLION)
    TABLE 68. REST OF EUROPE CONTRACT LOGISTICS MARKET, BY INDUSTRY VERTICAL, 2021-2031 ($BILLION)
    TABLE 69. REST OF EUROPE CONTRACT LOGISTICS MARKET, BY MODE OF TRANSPORTATION, 2021-2031 ($BILLION)
    TABLE 70. ASIA-PACIFIC CONTRACT LOGISTICS MARKET, BY SERVICE, 2021-2031 ($BILLION)
    TABLE 71. ASIA-PACIFIC CONTRACT LOGISTICS MARKET, BY TYPE, 2021-2031 ($BILLION)
    TABLE 72. ASIA-PACIFIC CONTRACT LOGISTICS MARKET, BY INDUSTRY VERTICAL, 2021-2031 ($BILLION)
    TABLE 73. ASIA-PACIFIC CONTRACT LOGISTICS MARKET, BY MODE OF TRANSPORTATION, 2021-2031 ($BILLION)
    TABLE 74. ASIA-PACIFIC CONTRACT LOGISTICS MARKET, BY COUNTRY, 2021-2031 ($BILLION)
    TABLE 75. CHINA CONTRACT LOGISTICS MARKET, BY SERVICE, 2021-2031 ($BILLION)
    TABLE 76. CHINA CONTRACT LOGISTICS MARKET, BY TYPE, 2021-2031 ($BILLION)
    TABLE 77. CHINA CONTRACT LOGISTICS MARKET, BY INDUSTRY VERTICAL, 2021-2031 ($BILLION)
    TABLE 78. CHINA CONTRACT LOGISTICS MARKET, BY MODE OF TRANSPORTATION, 2021-2031 ($BILLION)
    TABLE 79. JAPAN CONTRACT LOGISTICS MARKET, BY SERVICE, 2021-2031 ($BILLION)
    TABLE 80. JAPAN CONTRACT LOGISTICS MARKET, BY TYPE, 2021-2031 ($BILLION)
    TABLE 81. JAPAN CONTRACT LOGISTICS MARKET, BY INDUSTRY VERTICAL, 2021-2031 ($BILLION)
    TABLE 82. JAPAN CONTRACT LOGISTICS MARKET, BY MODE OF TRANSPORTATION, 2021-2031 ($BILLION)
    TABLE 83. INDIA CONTRACT LOGISTICS MARKET, BY SERVICE, 2021-2031 ($BILLION)
    TABLE 84. INDIA CONTRACT LOGISTICS MARKET, BY TYPE, 2021-2031 ($BILLION)
    TABLE 85. INDIA CONTRACT LOGISTICS MARKET, BY INDUSTRY VERTICAL, 2021-2031 ($BILLION)
    TABLE 86. INDIA CONTRACT LOGISTICS MARKET, BY MODE OF TRANSPORTATION, 2021-2031 ($BILLION)
    TABLE 87. AUSTRALIA CONTRACT LOGISTICS MARKET, BY SERVICE, 2021-2031 ($BILLION)
    TABLE 88. AUSTRALIA CONTRACT LOGISTICS MARKET, BY TYPE, 2021-2031 ($BILLION)
    TABLE 89. AUSTRALIA CONTRACT LOGISTICS MARKET, BY INDUSTRY VERTICAL, 2021-2031 ($BILLION)
    TABLE 90. AUSTRALIA CONTRACT LOGISTICS MARKET, BY MODE OF TRANSPORTATION, 2021-2031 ($BILLION)
    TABLE 91. REST OF ASIA-PACIFIC CONTRACT LOGISTICS MARKET, BY SERVICE, 2021-2031 ($BILLION)
    TABLE 92. REST OF ASIA-PACIFIC CONTRACT LOGISTICS MARKET, BY TYPE, 2021-2031 ($BILLION)
    TABLE 93. REST OF ASIA-PACIFIC CONTRACT LOGISTICS MARKET, BY INDUSTRY VERTICAL, 2021-2031 ($BILLION)
    TABLE 94. REST OF ASIA-PACIFIC CONTRACT LOGISTICS MARKET, BY MODE OF TRANSPORTATION, 2021-2031 ($BILLION)
    TABLE 95. LAMEA CONTRACT LOGISTICS MARKET, BY SERVICE, 2021-2031 ($BILLION)
    TABLE 96. LAMEA CONTRACT LOGISTICS MARKET, BY TYPE, 2021-2031 ($BILLION)
    TABLE 97. LAMEA CONTRACT LOGISTICS MARKET, BY INDUSTRY VERTICAL, 2021-2031 ($BILLION)
    TABLE 98. LAMEA CONTRACT LOGISTICS MARKET, BY MODE OF TRANSPORTATION, 2021-2031 ($BILLION)
    TABLE 99. LAMEA CONTRACT LOGISTICS MARKET, BY COUNTRY, 2021-2031 ($BILLION)
    TABLE 100. LATIN AMERICA CONTRACT LOGISTICS MARKET, BY SERVICE, 2021-2031 ($BILLION)
    TABLE 101. LATIN AMERICA CONTRACT LOGISTICS MARKET, BY TYPE, 2021-2031 ($BILLION)
    TABLE 102. LATIN AMERICA CONTRACT LOGISTICS MARKET, BY INDUSTRY VERTICAL, 2021-2031 ($BILLION)
    TABLE 103. LATIN AMERICA CONTRACT LOGISTICS MARKET, BY MODE OF TRANSPORTATION, 2021-2031 ($BILLION)
    TABLE 104. MIDDLE EAST CONTRACT LOGISTICS MARKET, BY SERVICE, 2021-2031 ($BILLION)
    TABLE 105. MIDDLE EAST CONTRACT LOGISTICS MARKET, BY TYPE, 2021-2031 ($BILLION)
    TABLE 106. MIDDLE EAST CONTRACT LOGISTICS MARKET, BY INDUSTRY VERTICAL, 2021-2031 ($BILLION)
    TABLE 107. MIDDLE EAST CONTRACT LOGISTICS MARKET, BY MODE OF TRANSPORTATION, 2021-2031 ($BILLION)
    TABLE 108. AFRICA CONTRACT LOGISTICS MARKET, BY SERVICE, 2021-2031 ($BILLION)
    TABLE 109. AFRICA CONTRACT LOGISTICS MARKET, BY TYPE, 2021-2031 ($BILLION)
    TABLE 110. AFRICA CONTRACT LOGISTICS MARKET, BY INDUSTRY VERTICAL, 2021-2031 ($BILLION)
    TABLE 111. AFRICA CONTRACT LOGISTICS MARKET, BY MODE OF TRANSPORTATION, 2021-2031 ($BILLION)
    TABLE 112. A.P. MOLLER - MAERSK: KEY EXECUTIVES
    TABLE 113. A.P. MOLLER - MAERSK: COMPANY SNAPSHOT
    TABLE 114. A.P. MOLLER - MAERSK: SERVICE SEGMENTS
    TABLE 115. A.P. MOLLER - MAERSK: PRODUCT PORTFOLIO
    TABLE 116. A.P. MOLLER - MAERSK: KEY STRATERGIES
    TABLE 117. AGILITY: KEY EXECUTIVES
    TABLE 118. AGILITY: COMPANY SNAPSHOT
    TABLE 119. AGILITY: SERVICE SEGMENTS
    TABLE 120. AGILITY: PRODUCT PORTFOLIO
    TABLE 121. AGILITY: KEY STRATERGIES
    TABLE 122. CEVA LOGISTICS: KEY EXECUTIVES
    TABLE 123. CEVA LOGISTICS: COMPANY SNAPSHOT
    TABLE 124. CEVA LOGISTICS: PRODUCT SEGMENTS
    TABLE 125. CEVA LOGISTICS: PRODUCT PORTFOLIO
    TABLE 126. CEVA LOGISTICS: KEY STRATERGIES
    TABLE 127. DB SCHENKER: KEY EXECUTIVES
    TABLE 128. DB SCHENKER: COMPANY SNAPSHOT
    TABLE 129. DB SCHENKER: SERVICE SEGMENTS
    TABLE 130. DB SCHENKER: PRODUCT PORTFOLIO
    TABLE 131. DB SCHENKER: KEY STRATERGIES
    TABLE 132. DEUTSCHE POST AG: KEY EXECUTIVES
    TABLE 133. DEUTSCHE POST AG: COMPANY SNAPSHOT
    TABLE 134. DEUTSCHE POST AG: SERVICE SEGMENTS
    TABLE 135. DEUTSCHE POST AG: PRODUCT PORTFOLIO
    TABLE 136. DEUTSCHE POST AG: KEY STRATERGIES
    TABLE 137. DSV: KEY EXECUTIVES
    TABLE 138. DSV: COMPANY SNAPSHOT
    TABLE 139. DSV: SERVICE SEGMENTS
    TABLE 140. DSV: PRODUCT PORTFOLIO
    TABLE 141. DSV: KEY STRATERGIES
    TABLE 142. GEODIS: KEY EXECUTIVES
    TABLE 143. GEODIS: COMPANY SNAPSHOT
    TABLE 144. GEODIS: SERVICE SEGMENTS
    TABLE 145. GEODIS: PRODUCT PORTFOLIO
    TABLE 146. GEODIS: KEY STRATERGIES
    TABLE 147. HELLMANN WORLDWIDE LOGISTICS: KEY EXECUTIVES
    TABLE 148. HELLMANN WORLDWIDE LOGISTICS: COMPANY SNAPSHOT
    TABLE 149. HELLMANN WORLDWIDE LOGISTICS: PRODUCT SEGMENTS
    TABLE 150. HELLMANN WORLDWIDE LOGISTICS: PRODUCT PORTFOLIO
    TABLE 151. HELLMANN WORLDWIDE LOGISTICS: KEY STRATERGIES
    TABLE 152. LOGISTEED, LTD.: KEY EXECUTIVES
    TABLE 153. LOGISTEED, LTD.: COMPANY SNAPSHOT
    TABLE 154. LOGISTEED, LTD.: PRODUCT SEGMENTS
    TABLE 155. LOGISTEED, LTD.: PRODUCT PORTFOLIO
    TABLE 156. LOGISTEED, LTD.: KEY STRATERGIES
    TABLE 157. KUEHNE NAGEL: KEY EXECUTIVES
    TABLE 158. KUEHNE NAGEL: COMPANY SNAPSHOT
    TABLE 159. KUEHNE NAGEL: PRODUCT SEGMENTS
    TABLE 160. KUEHNE NAGEL: PRODUCT PORTFOLIO
    TABLE 161. KUEHNE NAGEL: KEY STRATERGIES
    TABLE 162. NEOVIA LOGISTICS SERVICES, LLC.: KEY EXECUTIVES
    TABLE 163. NEOVIA LOGISTICS SERVICES, LLC.: COMPANY SNAPSHOT
    TABLE 164. NEOVIA LOGISTICS SERVICES, LLC.: PRODUCT SEGMENTS
    TABLE 165. NEOVIA LOGISTICS SERVICES, LLC.: PRODUCT PORTFOLIO
    TABLE 166. PENSKE: KEY EXECUTIVES
    TABLE 167. PENSKE: COMPANY SNAPSHOT
    TABLE 168. PENSKE: PRODUCT SEGMENTS
    TABLE 169. PENSKE: PRODUCT PORTFOLIO
    TABLE 170. PENSKE: KEY STRATERGIES
    TABLE 171. RYDER SYSTEM, INC.: KEY EXECUTIVES
    TABLE 172. RYDER SYSTEM, INC.: COMPANY SNAPSHOT
    TABLE 173. RYDER SYSTEM, INC.: PRODUCT SEGMENTS
    TABLE 174. RYDER SYSTEM, INC.: PRODUCT PORTFOLIO
    TABLE 175. RYDER SYSTEM, INC.: KEY STRATERGIES
    TABLE 176. UNITED PARCEL SERVICE OF AMERICA, INC.: KEY EXECUTIVES
    TABLE 177. UNITED PARCEL SERVICE OF AMERICA, INC.: COMPANY SNAPSHOT
    TABLE 178. UNITED PARCEL SERVICE OF AMERICA, INC.: PRODUCT SEGMENTS
    TABLE 179. UNITED PARCEL SERVICE OF AMERICA, INC.: PRODUCT PORTFOLIO
    TABLE 180. UNITED PARCEL SERVICE OF AMERICA, INC.: KEY STRATERGIES
    TABLE 181. XPO LOGISTICS INC.: KEY EXECUTIVES
    TABLE 182. XPO LOGISTICS INC.: COMPANY SNAPSHOT
    TABLE 183. XPO LOGISTICS INC.: SERVICE SEGMENTS
    TABLE 184. XPO LOGISTICS INC.: PRODUCT PORTFOLIO
    TABLE 185. YUSEN LOGISTICS CO., LTD.: KEY EXECUTIVES
    TABLE 186. YUSEN LOGISTICS CO., LTD.: COMPANY SNAPSHOT
    TABLE 187. YUSEN LOGISTICS CO., LTD.: PRODUCT SEGMENTS
    TABLE 188. YUSEN LOGISTICS CO., LTD.: PRODUCT PORTFOLIO
    TABLE 189. YUSEN LOGISTICS CO., LTD.: KEY STRATERGIES
    TABLE 190. CJ LOGISTICS CORPORATION: KEY EXECUTIVES
    TABLE 191. CJ LOGISTICS CORPORATION: COMPANY SNAPSHOT
    TABLE 192. CJ LOGISTICS CORPORATION: PRODUCT SEGMENTS
    TABLE 193. CJ LOGISTICS CORPORATION: PRODUCT PORTFOLIO
    TABLE 194. CJ LOGISTICS CORPORATION: KEY STRATERGIES
  • LIST OF FIGURES
  • FIGURE 1.CONTRACT LOGISTICS MARKET SEGMENTATION
    FIGURE 2.CONTRACT LOGISTICS MARKET,2021-2031
    FIGURE 3.CONTRACT LOGISTICS MARKET,2021-2031
    FIGURE 4. TOP INVESTMENT POCKETS, BY REGION
    FIGURE 5.PORTER FIVE-1
    FIGURE 6.PORTER FIVE-2
    FIGURE 7.PORTER FIVE-3
    FIGURE 8.PORTER FIVE-4
    FIGURE 9.PORTER FIVE-5
    FIGURE 10.TOP PLAYER POSITIONING
    FIGURE 11.CONTRACT LOGISTICS MARKET:DRIVERS, RESTRAINTS AND OPPORTUNITIES
    FIGURE 12.CONTRACT LOGISTICS MARKET,BY SERVICE,2021(%)
    FIGURE 13.COMPARATIVE SHARE ANALYSIS OF TRANSPORTATION CONTRACT LOGISTICS MARKET,2021-2031(%)
    FIGURE 14.COMPARATIVE SHARE ANALYSIS OF WAREHOUSING CONTRACT LOGISTICS MARKET,2021-2031(%)
    FIGURE 15.COMPARATIVE SHARE ANALYSIS OF DISTRIBUTION CONTRACT LOGISTICS MARKET,2021-2031(%)
    FIGURE 16.COMPARATIVE SHARE ANALYSIS OF AFTERMARKET LOGISTICS CONTRACT LOGISTICS MARKET,2021-2031(%)
    FIGURE 17.CONTRACT LOGISTICS MARKET,BY TYPE,2021(%)
    FIGURE 18.COMPARATIVE SHARE ANALYSIS OF INSOURCING CONTRACT LOGISTICS MARKET,2021-2031(%)
    FIGURE 19.COMPARATIVE SHARE ANALYSIS OF OUTSOURCING CONTRACT LOGISTICS MARKET,2021-2031(%)
    FIGURE 20.CONTRACT LOGISTICS MARKET,BY INDUSTRY VERTICAL,2021(%)
    FIGURE 21.COMPARATIVE SHARE ANALYSIS OF RETAIL CONTRACT LOGISTICS MARKET,2021-2031(%)
    FIGURE 22.COMPARATIVE SHARE ANALYSIS OF E-COMMERCE CONTRACT LOGISTICS MARKET,2021-2031(%)
    FIGURE 23.COMPARATIVE SHARE ANALYSIS OF MANUFACTURING CONTRACT LOGISTICS MARKET,2021-2031(%)
    FIGURE 24.COMPARATIVE SHARE ANALYSIS OF OTHERS CONTRACT LOGISTICS MARKET,2021-2031(%)
    FIGURE 25.CONTRACT LOGISTICS MARKET,BY MODE OF TRANSPORTATION,2021(%)
    FIGURE 26.COMPARATIVE SHARE ANALYSIS OF RAILWAYS CONTRACT LOGISTICS MARKET,2021-2031(%)
    FIGURE 27.COMPARATIVE SHARE ANALYSIS OF AIRWAYS CONTRACT LOGISTICS MARKET,2021-2031(%)
    FIGURE 28.COMPARATIVE SHARE ANALYSIS OF ROADWAYS CONTRACT LOGISTICS MARKET,2021-2031(%)
    FIGURE 29.COMPARATIVE SHARE ANALYSIS OF WATERWAYS CONTRACT LOGISTICS MARKET,2021-2031(%)
    FIGURE 30.CONTRACT LOGISTICS MARKET BY REGION,2021
    FIGURE 31.U.S. CONTRACT LOGISTICS MARKET,2021-2031($BILLION)
    FIGURE 32.CANADA CONTRACT LOGISTICS MARKET,2021-2031($BILLION)
    FIGURE 33.MEXICO CONTRACT LOGISTICS MARKET,2021-2031($BILLION)
    FIGURE 34.UK CONTRACT LOGISTICS MARKET,2021-2031($BILLION)
    FIGURE 35.GERMANY CONTRACT LOGISTICS MARKET,2021-2031($BILLION)
    FIGURE 36.FRANCE CONTRACT LOGISTICS MARKET,2021-2031($BILLION)
    FIGURE 37.ITALY CONTRACT LOGISTICS MARKET,2021-2031($BILLION)
    FIGURE 38.SPAIN CONTRACT LOGISTICS MARKET,2021-2031($BILLION)
    FIGURE 39.REST OF EUROPE CONTRACT LOGISTICS MARKET,2021-2031($BILLION)
    FIGURE 40.CHINA CONTRACT LOGISTICS MARKET,2021-2031($BILLION)
    FIGURE 41.JAPAN CONTRACT LOGISTICS MARKET,2021-2031($BILLION)
    FIGURE 42.INDIA CONTRACT LOGISTICS MARKET,2021-2031($BILLION)
    FIGURE 43.AUSTRALIA CONTRACT LOGISTICS MARKET,2021-2031($BILLION)
    FIGURE 44.REST OF ASIA-PACIFIC CONTRACT LOGISTICS MARKET,2021-2031($BILLION)
    FIGURE 45.LATIN AMERICA CONTRACT LOGISTICS MARKET,2021-2031($BILLION)
    FIGURE 46.MIDDLE EAST CONTRACT LOGISTICS MARKET,2021-2031($BILLION)
    FIGURE 47.AFRICA CONTRACT LOGISTICS MARKET,2021-2031($BILLION)
    FIGURE 48. TOP WINNING STRATEGIES, BY YEAR
    FIGURE 49. TOP WINNING STRATEGIES, BY DEVELOPMENT
    FIGURE 50. TOP WINNING STRATEGIES, BY COMPANY
    FIGURE 51.PRODUCT MAPPING OF TOP 10 PLAYERS
    FIGURE 52.COMPETITIVE DASHBOARD
    FIGURE 53.COMPETITIVE HEATMAP OF TOP 10 KEY PLAYERS
    FIGURE 54.A.P. MOLLER - MAERSK.: NET SALES ,($BILLION)
    FIGURE 55.AGILITY.: NET SALES ,($BILLION)
    FIGURE 56.CEVA LOGISTICS.: NET SALES ,($BILLION)
    FIGURE 57.DB SCHENKER.: NET SALES ,($BILLION)
    FIGURE 58.DEUTSCHE POST AG.: NET SALES ,($BILLION)
    FIGURE 59.DSV.: NET SALES ,($BILLION)
    FIGURE 60.GEODIS.: NET SALES ,($BILLION)
    FIGURE 61.HELLMANN WORLDWIDE LOGISTICS.: NET SALES ,($BILLION)
    FIGURE 62.HITACHI TRANSPORT SYSTEM, LTD..: NET SALES ,($BILLION)
    FIGURE 63.KUEHNE+NAGEL INTERNATIONAL AG.: NET SALES ,($BILLION)
    FIGURE 64.NEOVIA LOGISTICS SERVICES, LLC.: NET SALES ,($BILLION)
    FIGURE 65.PENSKE.: NET SALES ,($BILLION)
    FIGURE 66.RYDER SYSTEM INC..: NET SALES ,($BILLION)
    FIGURE 67.UNITED PARCEL SERVICE, INC..: NET SALES ,($BILLION)
    FIGURE 68.XPO LOGISTICS INC..: NET SALES ,($BILLION)
    FIGURE 69.YUSEN LOGISTICS CO., LTD..: NET SALES ,($BILLION)
    FIGURE 70.CJ LOGISTICS CORPORATION.: NET SALES ,($BILLION)


SELECT A FORMAT
Added to Cart
Electronic (PDF)

$5730

This license allows only one user to access the PDF.
Electronic (PDF)

$9600

This license allows users/teams in a same Enterprise to use this report, various departments within an enterpise can use this report
Add to Cart
Buy Now (15% Discount)

OUR CUSTOMER

Strategic Venue Partners

SIMILAR REPORTS


RELATED REPORTS

Global Anti-counterfeit Wrap Market Research Report 2024

120 Pages
Type: Report
Code: QYRE-Auto-16R8438
Wed Apr 17 00:00:00 UTC 2024

Add to Cart

Global Retort Wrap Market Research Report 2024

120 Pages
Type: Report
Code: QYRE-Auto-2H8753
Wed Apr 17 00:00:00 UTC 2024

Add to Cart

Global Intermodal Transportation Service Market Research Report 2024

120 Pages
Type: Report
Code: QYRE-Auto-34K5671
Wed Apr 17 00:00:00 UTC 2024

Add to Cart

Global BOPP Wrap Market Research Report 2024

120 Pages
Type: Report
Code: QYRE-Auto-17B8559
Wed Apr 17 00:00:00 UTC 2024

Add to Cart