0
U.S. (TOLL FREE)
+1 (315) 215-3225
Automative

0
U.S. (TOLL FREE)
+1 (315) 215-3225
Global IT Spending in Transportation Market Insights, Forecast to 2030
Published Date: December 2024
|
Report Code: QYRE-Auto-27T5751
Home | Market Reports | Internet & Telecom
Global IT Spending in Transportation Market Insights and Forecast to 2028
BUY CHAPTERS

Global IT Spending in Transportation Market Insights, Forecast to 2030

Code: QYRE-Auto-27T5751
Report
December 2024
Pages:127
QYResearch
Buy Now with 15% Discount
DESCRIPTION
TABLE OF CONTENT
TABLES & FIGURES

IT Spending in Transportation Market Size

The global IT Spending in Transportation market is projected to grow from US$ 35460 million in 2024 to US$ 49180 million by 2030, at a Compound Annual Growth Rate (CAGR) of 5.6% during the forecast period.

IT Spending in Transportation Market

IT Spending in Transportation Market

IT spending in transportation refers to Transportation IT Spending, increased traffic congestion and road accidents have forced governments worldwide to spend heavily on transportation IT systems.
Market Analysis and Insights: Global IT Spending in Transportation Market
The US & Canada market for IT Spending in Transportation is estimated to increase from $ million in 2024 to reach $ million by 2030, at a CAGR of % during the forecast period of 2025 through 2030.
The China market for IT Spending in Transportation is estimated to increase from $ million in 2024 to reach $ million by 2030, at a CAGR of % during the forecast period of 2025 through 2030.
The Europe market for IT Spending in Transportation is estimated to increase from $ million in 2024 to reach $ million by 2030, at a CAGR of % during the forecast period of 2025 through 2030.
The global key companies of IT Spending in Transportation include Accenture, Cisco Systems, GE Transportation Systems, IBM, Siemens, Amadeus, Alstom, Atos and Bass Software, etc. In 2023, the global top five players had a share approximately % in terms of revenue.
IT Spending in Transportation is widely used in various fields, such as Airlines, Waterways, Railways and Road Transport, etc. Airlines provides greatest supports to the IT Spending in Transportation industry development. In 2023, global % revenue of IT Spending in Transportation went into Airlines filed and the proportion will reach to % in 2030.
Report Covers:
This report presents an overview of global market for IT Spending in Transportation market size. Analyses of the global market trends, with historic market revenue data for 2019 - 2023, estimates for 2024, and projections of CAGR through 2030.
This report researches the key producers of IT Spending in Transportation, also provides the revenue of main regions and countries. Highlights of the upcoming market potential for IT Spending in Transportation, and key regions/countries of focus to forecast this market into various segments and sub-segments. Country specific data and market value analysis for the U.S., Canada, Mexico, Brazil, China, Japan, South Korea, Southeast Asia, India, Germany, the U.K., Italy, Middle East, Africa, and Other Countries.
This report focuses on the IT Spending in Transportation revenue, market share and industry ranking of main companies, data from 2019 to 2024. Identification of the major stakeholders in the global IT Spending in Transportation market, and analysis of their competitive landscape and market positioning based on recent developments and segmental revenues. This report will help stakeholders to understand the competitive landscape and gain more insights and position their businesses and market strategies in a better way.
This report analyzes the segments data by Type and by Application, revenue, and growth rate, from 2019 to 2030. Evaluation and forecast the market size for IT Spending in Transportation revenue, projected growth trends, production technology, application and end-user industry.
Market Segmentation

Scope of IT Spending in Transportation Market Report

Report Metric Details
Report Name IT Spending in Transportation Market
Accounted market size in 2024 US$ 35460 in million
Forecasted market size in 2030 US$ 49180 million
CAGR 5.6
Base Year 2024
Forecasted years 2025 - 2030
Segment by Type
  • Hardware
  • Software and Solutions
  • IT Services
Segment by Application
  • Airlines
  • Waterways
  • Railways
  • Road Transport
By Region
  • North America (United States, Canada)
  • Europe (Germany, France, UK, Italy, Russia) Rest of Europe
  • Nordic Countries
  • Asia-Pacific (China, Japan, South Korea)
  • Southeast Asia (India, Australia)
  • Rest of Asia
  • Latin America (Mexico, Brazil)
  • Rest of Latin America
  • Middle East & Africa (Turkey, Saudi Arabia, UAE, Rest of MEA)
By Company Accenture, Cisco Systems, GE Transportation Systems, IBM, Siemens, Amadeus, Alstom, Atos, Bass Software, Capgemini, Cognizant, Cubic, Damarel, Descarts Systems, DNV GL, Ikusi, Indra Sistemas, KAPSCH, LG CNS, Mindfire Solutions, NEC, Northrop Grumman, Wayne RESA, Rockwell Collins, SAP, TCS, Thales Group, Veson Nautical, Wipro
Forecast units USD million in value
Report coverage Revenue and volume forecast, company share, competitive landscape, growth factors and trends

Chapter Outline

  • Chapter 1: Introduces the report scope of the report, executive summary of different market segments (product type, application, etc), including the market size of each market segment, future development potential, and so on. It offers a high-level view of the current state of the market and its likely evolution in the short to mid-term, and long term.
  • Chapter 2: Revenue of IT Spending in Transportation in global and regional level. It provides a quantitative analysis of the market size and development potential of each region and its main countries and introduces the market development, future development prospects, market space, and capacity of each country in the world. This section also introduces the market dynamics, latest developments of the market, the driving factors and restrictive factors of the market, the challenges and risks faced by companies in the industry, and the analysis of relevant policies in the industry.
  • Chapter 3: Detailed analysis of IT Spending in Transportation companies’ competitive landscape, revenue, market share and industry ranking, latest development plan, merger, and acquisition information, etc.
  • Chapter 4: Provides the analysis of various market segments by Type, covering the revenue, and development potential of each market segment, to help readers find the blue ocean market in different market segments.
  • Chapter 5: Provides the analysis of various market segments by Application, covering the revenue, and development potential of each market segment, to help readers find the blue ocean market in different downstream markets.
  • Chapter 6: North America (US & Canada) by Type, by Application and by country, revenue for each segment.
  • Chapter 7: Europe by Type, by Application and by country, revenue for each segment.
  • Chapter 8: China by Type, and by Application, revenue for each segment.
  • Chapter 9: Asia (excluding China) by Type, by Application and by region, revenue for each segment.
  • Chapter 10: Middle East, Africa, and Latin America by Type, by Application and by country, revenue for each segment.
  • Chapter 11: Provides profiles of key companies, introducing the basic situation of the main companies in the market in detail, including product descriptions and specifications, IT Spending in Transportation revenue, gross margin, and recent development, etc.
  • Chapter 12: Analyst's Viewpoints/Conclusions

FAQ for this report

How fast is IT Spending in Transportation Market growing?

Ans: The IT Spending in Transportation Market witnessing a CAGR of 5.6 during the forecast period 2025-2030.

What is the IT Spending in Transportation Market size in 2030?

Ans: The IT Spending in Transportation Market size in 2030 will be US$ 49180 million.

Who are the main players in the IT Spending in Transportation Market report?

Ans: The main players in the IT Spending in Transportation Market are Accenture, Cisco Systems, GE Transportation Systems, IBM, Siemens, Amadeus, Alstom, Atos, Bass Software, Capgemini, Cognizant, Cubic, Damarel, Descarts Systems, DNV GL, Ikusi, Indra Sistemas, KAPSCH, LG CNS, Mindfire Solutions, NEC, Northrop Grumman, Wayne RESA, Rockwell Collins, SAP, TCS, Thales Group, Veson Nautical, Wipro

What are the Application segmentation covered in the IT Spending in Transportation Market report?

Ans: The Applications covered in the IT Spending in Transportation Market report are Airlines, Waterways, Railways, Road Transport

What are the Type segmentation covered in the IT Spending in Transportation Market report?

Ans: The Types covered in the IT Spending in Transportation Market report are Hardware, Software and Solutions, IT Services

Recommended Reports

Transportation IT & Analytics

Mobility Services Market

Transport Infrastructure Systems

1 Report Overview
1.1 Study Scope
1.2 Market Analysis by Type
1.2.1 Global IT Spending in Transportation Market Size Growth Rate by Type, 2019 VS 2023 VS 2030
1.2.2 Hardware
1.2.3 Software and Solutions
1.2.4 IT Services
1.3 Market by Application
1.3.1 Global IT Spending in Transportation Market Size Growth Rate by Application, 2019 VS 2023 VS 2030
1.3.2 Airlines
1.3.3 Waterways
1.3.4 Railways
1.3.5 Road Transport
1.4 Assumptions and Limitations
1.5 Study Objectives
1.6 Years Considered
2 Global Growth Trends
2.1 Global IT Spending in Transportation Market Perspective (2019-2030)
2.2 Global IT Spending in Transportation Growth Trends by Region
2.2.1 IT Spending in Transportation Market Size by Region: 2019 VS 2023 VS 2030
2.2.2 IT Spending in Transportation Historic Market Size by Region (2019-2024)
2.2.3 IT Spending in Transportation Forecasted Market Size by Region (2025-2030)
2.3 IT Spending in Transportation Market Dynamics
2.3.1 IT Spending in Transportation Industry Trends
2.3.2 IT Spending in Transportation Market Drivers
2.3.3 IT Spending in Transportation Market Challenges
2.3.4 IT Spending in Transportation Market Restraints
3 Competition Landscape by Key Players
3.1 Global Revenue IT Spending in Transportation by Players
3.1.1 Global IT Spending in Transportation Revenue by Players (2019-2024)
3.1.2 Global IT Spending in Transportation Revenue Market Share by Players (2019-2024)
3.2 Global IT Spending in Transportation Market Share by Company Type (Tier 1, Tier 2, and Tier 3)
3.3 Global Key Players of IT Spending in Transportation, Ranking by Revenue, 2022 VS 2023 VS 2024
3.4 Global IT Spending in Transportation Market Concentration Ratio
3.4.1 Global IT Spending in Transportation Market Concentration Ratio (CR5 and HHI)
3.4.2 Global Top 10 and Top 5 Companies by IT Spending in Transportation Revenue in 2023
3.5 Global Key Players of IT Spending in Transportation Head office and Area Served
3.6 Global Key Players of IT Spending in Transportation, Product and Application
3.7 Global Key Players of IT Spending in Transportation, Date of Enter into This Industry
3.8 Mergers & Acquisitions, Expansion Plans
4 IT Spending in Transportation Breakdown Data by Type
4.1 Global IT Spending in Transportation Historic Market Size by Type (2019-2024)
4.2 Global IT Spending in Transportation Forecasted Market Size by Type (2025-2030)
5 IT Spending in Transportation Breakdown Data by Application
5.1 Global IT Spending in Transportation Historic Market Size by Application (2019-2024)
5.2 Global IT Spending in Transportation Forecasted Market Size by Application (2025-2030)
6 North America
6.1 North America IT Spending in Transportation Market Size (2019-2030)
6.2 North America IT Spending in Transportation Market Size by Type
6.2.1 North America IT Spending in Transportation Market Size by Type (2019-2024)
6.2.2 North America IT Spending in Transportation Market Size by Type (2025-2030)
6.2.3 North America IT Spending in Transportation Market Share by Type (2019-2030)
6.3 North America IT Spending in Transportation Market Size by Application
6.3.1 North America IT Spending in Transportation Market Size by Application (2019-2024)
6.3.2 North America IT Spending in Transportation Market Size by Application (2025-2030)
6.3.3 North America IT Spending in Transportation Market Share by Application (2019-2030)
6.4 North America IT Spending in Transportation Market Size by Country
6.4.1 North America IT Spending in Transportation Market Size by Country: 2019 VS 2023 VS 2030
6.4.2 North America IT Spending in Transportation Market Size by Country (2019-2024)
6.4.3 North America IT Spending in Transportation Market Size by Country (2025-2030)
6.4.4 U.S.
6.4.5 Canada
7 Europe
7.1 Europe IT Spending in Transportation Market Size (2019-2030)
7.2 Europe IT Spending in Transportation Market Size by Type
7.2.1 Europe IT Spending in Transportation Market Size by Type (2019-2024)
7.2.2 Europe IT Spending in Transportation Market Size by Type (2025-2030)
7.2.3 Europe IT Spending in Transportation Market Share by Type (2019-2030)
7.3 Europe IT Spending in Transportation Market Size by Application
7.3.1 Europe IT Spending in Transportation Market Size by Application (2019-2024)
7.3.2 Europe IT Spending in Transportation Market Size by Application (2025-2030)
7.3.3 Europe IT Spending in Transportation Market Share by Application (2019-2030)
7.4 Europe IT Spending in Transportation Market Size by Country
7.4.1 Europe IT Spending in Transportation Market Size by Country: 2019 VS 2023 VS 2030
7.4.2 Europe IT Spending in Transportation Market Size by Country (2019-2024)
7.4.3 Europe IT Spending in Transportation Market Size by Country (2025-2030)
7.4.3 Germany
7.4.4 France
7.4.5 U.K.
7.4.6 Italy
7.4.7 Russia
7.4.8 Nordic Countries
8 China
8.1 China IT Spending in Transportation Market Size (2019-2030)
8.2 China IT Spending in Transportation Market Size by Type
8.2.1 China IT Spending in Transportation Market Size by Type (2019-2024)
8.2.2 China IT Spending in Transportation Market Size by Type (2025-2030)
8.2.3 China IT Spending in Transportation Market Share by Type (2019-2030)
8.3 China IT Spending in Transportation Market Size by Application
8.3.1 China IT Spending in Transportation Market Size by Application (2019-2024)
8.3.2 China IT Spending in Transportation Market Size by Application (2025-2030)
8.3.3 China IT Spending in Transportation Market Share by Application (2019-2030)
9 Asia (excluding China)
9.1 Asia IT Spending in Transportation Market Size (2019-2030)
9.2 Asia IT Spending in Transportation Market Size by Type
9.2.1 Asia IT Spending in Transportation Market Size by Type (2019-2024)
9.2.2 Asia IT Spending in Transportation Market Size by Type (2025-2030)
9.2.3 Asia IT Spending in Transportation Market Share by Type (2019-2030)
9.3 Asia IT Spending in Transportation Market Size by Application
9.3.1 Asia IT Spending in Transportation Market Size by Application (2019-2024)
9.3.2 Asia IT Spending in Transportation Market Size by Application (2025-2030)
9.3.3 Asia IT Spending in Transportation Market Share by Application (2019-2030)
9.4 Asia IT Spending in Transportation Market Size by Region
9.4.1 Asia IT Spending in Transportation Market Size by Region: 2019 VS 2023 VS 2030
9.4.2 Asia IT Spending in Transportation Market Size by Region (2019-2024)
9.4.3 Asia IT Spending in Transportation Market Size by Region (2025-2030)
9.4.4 Japan
9.4.5 South Korea
9.4.6 China Taiwan
9.4.7 Southeast Asia
9.4.8 India
9.4.9 Australia
10 Middle East, Africa, and Latin America
10.1 Middle East, Africa, and Latin America IT Spending in Transportation Market Size (2019-2030)
10.2 Middle East, Africa, and Latin America IT Spending in Transportation Market Size by Type
10.2.1 Middle East, Africa, and Latin America IT Spending in Transportation Market Size by Type (2019-2024)
10.2.2 Middle East, Africa, and Latin America IT Spending in Transportation Market Size by Type (2025-2030)
10.2.3 Middle East, Africa, and Latin America IT Spending in Transportation Market Share by Type (2019-2030)
10.3 Middle East, Africa, and Latin America IT Spending in Transportation Market Size by Application
10.3.1 Middle East, Africa, and Latin America IT Spending in Transportation Market Size by Application (2019-2024)
10.3.2 Middle East, Africa, and Latin America IT Spending in Transportation Market Size by Application (2025-2030)
10.3.3 Middle East, Africa, and Latin America IT Spending in Transportation Market Share by Application (2019-2030)
10.4 Middle East, Africa, and Latin America IT Spending in Transportation Market Size by Country
10.4.1 Middle East, Africa, and Latin America IT Spending in Transportation Market Size by Country: 2019 VS 2023 VS 2030
10.4.2 Middle East, Africa, and Latin America IT Spending in Transportation Market Size by Country (2019-2024)
10.4.3 Middle East, Africa, and Latin America IT Spending in Transportation Market Size by Country (2025-2030)
10.4.4 Brazil
10.4.5 Mexico
10.4.6 Turkey
10.4.7 Saudi Arabia
10.4.8 Israel
10.4.9 GCC Countries
11 Key Players Profiles
11.1 Accenture
11.1.1 Accenture Company Details
11.1.2 Accenture Business Overview
11.1.3 Accenture IT Spending in Transportation Introduction
11.1.4 Accenture Revenue in IT Spending in Transportation Business (2019-2024)
11.1.5 Accenture Recent Developments
11.2 Cisco Systems
11.2.1 Cisco Systems Company Details
11.2.2 Cisco Systems Business Overview
11.2.3 Cisco Systems IT Spending in Transportation Introduction
11.2.4 Cisco Systems Revenue in IT Spending in Transportation Business (2019-2024)
11.2.5 Cisco Systems Recent Developments
11.3 GE Transportation Systems
11.3.1 GE Transportation Systems Company Details
11.3.2 GE Transportation Systems Business Overview
11.3.3 GE Transportation Systems IT Spending in Transportation Introduction
11.3.4 GE Transportation Systems Revenue in IT Spending in Transportation Business (2019-2024)
11.3.5 GE Transportation Systems Recent Developments
11.4 IBM
11.4.1 IBM Company Details
11.4.2 IBM Business Overview
11.4.3 IBM IT Spending in Transportation Introduction
11.4.4 IBM Revenue in IT Spending in Transportation Business (2019-2024)
11.4.5 IBM Recent Developments
11.5 Siemens
11.5.1 Siemens Company Details
11.5.2 Siemens Business Overview
11.5.3 Siemens IT Spending in Transportation Introduction
11.5.4 Siemens Revenue in IT Spending in Transportation Business (2019-2024)
11.5.5 Siemens Recent Developments
11.6 Amadeus
11.6.1 Amadeus Company Details
11.6.2 Amadeus Business Overview
11.6.3 Amadeus IT Spending in Transportation Introduction
11.6.4 Amadeus Revenue in IT Spending in Transportation Business (2019-2024)
11.6.5 Amadeus Recent Developments
11.7 Alstom
11.7.1 Alstom Company Details
11.7.2 Alstom Business Overview
11.7.3 Alstom IT Spending in Transportation Introduction
11.7.4 Alstom Revenue in IT Spending in Transportation Business (2019-2024)
11.7.5 Alstom Recent Developments
11.8 Atos
11.8.1 Atos Company Details
11.8.2 Atos Business Overview
11.8.3 Atos IT Spending in Transportation Introduction
11.8.4 Atos Revenue in IT Spending in Transportation Business (2019-2024)
11.8.5 Atos Recent Developments
11.9 Bass Software
11.9.1 Bass Software Company Details
11.9.2 Bass Software Business Overview
11.9.3 Bass Software IT Spending in Transportation Introduction
11.9.4 Bass Software Revenue in IT Spending in Transportation Business (2019-2024)
11.9.5 Bass Software Recent Developments
11.10 Capgemini
11.10.1 Capgemini Company Details
11.10.2 Capgemini Business Overview
11.10.3 Capgemini IT Spending in Transportation Introduction
11.10.4 Capgemini Revenue in IT Spending in Transportation Business (2019-2024)
11.10.5 Capgemini Recent Developments
11.11 Cognizant
11.11.1 Cognizant Company Details
11.11.2 Cognizant Business Overview
11.11.3 Cognizant IT Spending in Transportation Introduction
11.11.4 Cognizant Revenue in IT Spending in Transportation Business (2019-2024)
11.11.5 Cognizant Recent Developments
11.12 Cubic
11.12.1 Cubic Company Details
11.12.2 Cubic Business Overview
11.12.3 Cubic IT Spending in Transportation Introduction
11.12.4 Cubic Revenue in IT Spending in Transportation Business (2019-2024)
11.12.5 Cubic Recent Developments
11.13 Damarel
11.13.1 Damarel Company Details
11.13.2 Damarel Business Overview
11.13.3 Damarel IT Spending in Transportation Introduction
11.13.4 Damarel Revenue in IT Spending in Transportation Business (2019-2024)
11.13.5 Damarel Recent Developments
11.14 Descarts Systems
11.14.1 Descarts Systems Company Details
11.14.2 Descarts Systems Business Overview
11.14.3 Descarts Systems IT Spending in Transportation Introduction
11.14.4 Descarts Systems Revenue in IT Spending in Transportation Business (2019-2024)
11.14.5 Descarts Systems Recent Developments
11.15 DNV GL
11.15.1 DNV GL Company Details
11.15.2 DNV GL Business Overview
11.15.3 DNV GL IT Spending in Transportation Introduction
11.15.4 DNV GL Revenue in IT Spending in Transportation Business (2019-2024)
11.15.5 DNV GL Recent Developments
11.16 Ikusi
11.16.1 Ikusi Company Details
11.16.2 Ikusi Business Overview
11.16.3 Ikusi IT Spending in Transportation Introduction
11.16.4 Ikusi Revenue in IT Spending in Transportation Business (2019-2024)
11.16.5 Ikusi Recent Developments
11.17 Indra Sistemas
11.17.1 Indra Sistemas Company Details
11.17.2 Indra Sistemas Business Overview
11.17.3 Indra Sistemas IT Spending in Transportation Introduction
11.17.4 Indra Sistemas Revenue in IT Spending in Transportation Business (2019-2024)
11.17.5 Indra Sistemas Recent Developments
11.18 KAPSCH
11.18.1 KAPSCH Company Details
11.18.2 KAPSCH Business Overview
11.18.3 KAPSCH IT Spending in Transportation Introduction
11.18.4 KAPSCH Revenue in IT Spending in Transportation Business (2019-2024)
11.18.5 KAPSCH Recent Developments
11.19 LG CNS
11.19.1 LG CNS Company Details
11.19.2 LG CNS Business Overview
11.19.3 LG CNS IT Spending in Transportation Introduction
11.19.4 LG CNS Revenue in IT Spending in Transportation Business (2019-2024)
11.19.5 LG CNS Recent Developments
11.20 Mindfire Solutions
11.20.1 Mindfire Solutions Company Details
11.20.2 Mindfire Solutions Business Overview
11.20.3 Mindfire Solutions IT Spending in Transportation Introduction
11.20.4 Mindfire Solutions Revenue in IT Spending in Transportation Business (2019-2024)
11.20.5 Mindfire Solutions Recent Developments
11.21 NEC
11.21.1 NEC Company Details
11.21.2 NEC Business Overview
11.21.3 NEC IT Spending in Transportation Introduction
11.21.4 NEC Revenue in IT Spending in Transportation Business (2019-2024)
11.21.5 NEC Recent Developments
11.22 Northrop Grumman
11.22.1 Northrop Grumman Company Details
11.22.2 Northrop Grumman Business Overview
11.22.3 Northrop Grumman IT Spending in Transportation Introduction
11.22.4 Northrop Grumman Revenue in IT Spending in Transportation Business (2019-2024)
11.22.5 Northrop Grumman Recent Developments
11.23 Wayne RESA
11.23.1 Wayne RESA Company Details
11.23.2 Wayne RESA Business Overview
11.23.3 Wayne RESA IT Spending in Transportation Introduction
11.23.4 Wayne RESA Revenue in IT Spending in Transportation Business (2019-2024)
11.23.5 Wayne RESA Recent Developments
11.24 Rockwell Collins
11.24.1 Rockwell Collins Company Details
11.24.2 Rockwell Collins Business Overview
11.24.3 Rockwell Collins IT Spending in Transportation Introduction
11.24.4 Rockwell Collins Revenue in IT Spending in Transportation Business (2019-2024)
11.24.5 Rockwell Collins Recent Developments
11.25 SAP
11.25.1 SAP Company Details
11.25.2 SAP Business Overview
11.25.3 SAP IT Spending in Transportation Introduction
11.25.4 SAP Revenue in IT Spending in Transportation Business (2019-2024)
11.25.5 SAP Recent Developments
11.26 TCS
11.26.1 TCS Company Details
11.26.2 TCS Business Overview
11.26.3 TCS IT Spending in Transportation Introduction
11.26.4 TCS Revenue in IT Spending in Transportation Business (2019-2024)
11.26.5 TCS Recent Developments
11.27 Thales Group
11.27.1 Thales Group Company Details
11.27.2 Thales Group Business Overview
11.27.3 Thales Group IT Spending in Transportation Introduction
11.27.4 Thales Group Revenue in IT Spending in Transportation Business (2019-2024)
11.27.5 Thales Group Recent Developments
11.28 Veson Nautical
11.28.1 Veson Nautical Company Details
11.28.2 Veson Nautical Business Overview
11.28.3 Veson Nautical IT Spending in Transportation Introduction
11.28.4 Veson Nautical Revenue in IT Spending in Transportation Business (2019-2024)
11.28.5 Veson Nautical Recent Developments
11.29 Wipro
11.29.1 Wipro Company Details
11.29.2 Wipro Business Overview
11.29.3 Wipro IT Spending in Transportation Introduction
11.29.4 Wipro Revenue in IT Spending in Transportation Business (2019-2024)
11.29.5 Wipro Recent Developments
12 Analyst's Viewpoints/Conclusions
13 Appendix
13.1 Research Methodology
13.1.1 Methodology/Research Approach
13.1.2 Data Source
13.2 Disclaimer
13.3 Author Details
List of Tables
    Table 1. Global IT Spending in Transportation Market Size Growth Rate by Type (US$ Million), 2019 VS 2023 VS 2030
    Table 2. Key Players of Hardware
    Table 3. Key Players of Software and Solutions
    Table 4. Key Players of IT Services
    Table 5. Global IT Spending in Transportation Market Size Growth Rate by Application (US$ Million), 2019 VS 2023 VS 2030
    Table 6. Global IT Spending in Transportation Market Size Growth Rate (CAGR) by Region (US$ Million): 2019 VS 2023 VS 2030
    Table 7. Global IT Spending in Transportation Market Size by Region (2019-2024) & (US$ Million)
    Table 8. Global IT Spending in Transportation Market Share by Region (2019-2024)
    Table 9. Global IT Spending in Transportation Forecasted Market Size by Region (2025-2030) & (US$ Million)
    Table 10. Global IT Spending in Transportation Market Share by Region (2025-2030)
    Table 11. IT Spending in Transportation Market Trends
    Table 12. IT Spending in Transportation Market Drivers
    Table 13. IT Spending in Transportation Market Challenges
    Table 14. IT Spending in Transportation Market Restraints
    Table 15. Global IT Spending in Transportation Revenue by Players (2019-2024) & (US$ Million)
    Table 16. Global IT Spending in Transportation Revenue Share by Players (2019-2024)
    Table 17. Global Top IT Spending in Transportation by Company Type (Tier 1, Tier 2, and Tier 3) & (based on the Revenue in IT Spending in Transportation as of 2023)
    Table 18. Global IT Spending in Transportation Industry Ranking 2022 VS 2023 VS 2024
    Table 19. Global 5 Largest Players Market Share by IT Spending in Transportation Revenue (CR5 and HHI) & (2019-2024)
    Table 20. Global Key Players of IT Spending in Transportation, Headquarters and Area Served
    Table 21. Global Key Players of IT Spending in Transportation, Product and Application
    Table 22. Global Key Players of IT Spending in Transportation, Product and Application
    Table 23. Mergers & Acquisitions, Expansion Plans
    Table 24. Global IT Spending in Transportation Market Size by Type (2019-2024) & (US$ Million)
    Table 25. Global IT Spending in Transportation Revenue Market Share by Type (2019-2024)
    Table 26. Global IT Spending in Transportation Forecasted Market Size by Type (2025-2030) & (US$ Million)
    Table 27. Global IT Spending in Transportation Revenue Market Share by Type (2025-2030)
    Table 28. Global IT Spending in Transportation Market Size by Application (2019-2024) & (US$ Million)
    Table 29. Global IT Spending in Transportation Revenue Share by Application (2019-2024)
    Table 30. Global IT Spending in Transportation Forecasted Market Size by Application (2025-2030) & (US$ Million)
    Table 31. Global IT Spending in Transportation Revenue Share by Application (2025-2030)
    Table 32. North America IT Spending in Transportation Market Size by Type (2019-2024) & (US$ Million)
    Table 33. North America IT Spending in Transportation Market Size by Type (2025-2030) & (US$ Million)
    Table 34. North America IT Spending in Transportation Market Size by Application (2019-2024) & (US$ Million)
    Table 35. North America IT Spending in Transportation Market Size by Application (2025-2030) & (US$ Million)
    Table 36. North America IT Spending in Transportation Growth Rate (CAGR) by Country (US$ Million): 2019 VS 2023 VS 2030
    Table 37. North America IT Spending in Transportation Market Size by Country (2019-2024) & (US$ Million)
    Table 38. North America IT Spending in Transportation Market Size by Country (2025-2030) & (US$ Million)
    Table 39. Europe IT Spending in Transportation Market Size by Type (2019-2024) & (US$ Million)
    Table 40. Europe IT Spending in Transportation Market Size by Type (2025-2030) & (US$ Million)
    Table 41. Europe IT Spending in Transportation Market Size by Application (2019-2024) & (US$ Million)
    Table 42. Europe IT Spending in Transportation Market Size by Application (2025-2030) & (US$ Million)
    Table 43. Europe IT Spending in Transportation Growth Rate (CAGR) by Country (US$ Million): 2019 VS 2023 VS 2030
    Table 44. Europe IT Spending in Transportation Market Size by Country (2019-2024) & (US$ Million)
    Table 45. Europe IT Spending in Transportation Market Size by Country (2025-2030) & (US$ Million)
    Table 46. China IT Spending in Transportation Market Size by Type (2019-2024) & (US$ Million)
    Table 47. China IT Spending in Transportation Market Size by Type (2025-2030) & (US$ Million)
    Table 48. China IT Spending in Transportation Market Size by Application (2019-2024) & (US$ Million)
    Table 49. China IT Spending in Transportation Market Size by Application (2025-2030) & (US$ Million)
    Table 50. Asia IT Spending in Transportation Market Size by Type (2019-2024) & (US$ Million)
    Table 51. Asia IT Spending in Transportation Market Size by Type (2025-2030) & (US$ Million)
    Table 52. Asia IT Spending in Transportation Market Size by Application (2019-2024) & (US$ Million)
    Table 53. Asia IT Spending in Transportation Market Size by Application (2025-2030) & (US$ Million)
    Table 54. Asia IT Spending in Transportation Growth Rate (CAGR) by Region (US$ Million): 2019 VS 2023 VS 2030
    Table 55. Asia IT Spending in Transportation Market Size by Region (2019-2024) & (US$ Million)
    Table 56. Asia IT Spending in Transportation Market Size by Region (2025-2030) & (US$ Million)
    Table 57. Middle East, Africa, and Latin America IT Spending in Transportation Market Size by Type (2019-2024) & (US$ Million)
    Table 58. Middle East, Africa, and Latin America IT Spending in Transportation Market Size by Type (2025-2030) & (US$ Million)
    Table 59. Middle East, Africa, and Latin America IT Spending in Transportation Market Size by Application (2019-2024) & (US$ Million)
    Table 60. Middle East, Africa, and Latin America IT Spending in Transportation Market Size by Application (2025-2030) & (US$ Million)
    Table 61. Middle East, Africa, and Latin America IT Spending in Transportation Growth Rate (CAGR) by Country (US$ Million): 2019 VS 2023 VS 2030
    Table 62. Middle East, Africa, and Latin America IT Spending in Transportation Market Size by Country (2019-2024) & (US$ Million)
    Table 63. Middle East, Africa, and Latin America IT Spending in Transportation Market Size by Country (2025-2030) & (US$ Million)
    Table 64. Accenture Company Details
    Table 65. Accenture Business Overview
    Table 66. Accenture IT Spending in Transportation Product
    Table 67. Accenture Revenue in IT Spending in Transportation Business (2019-2024) & (US$ Million)
    Table 68. Accenture Recent Developments
    Table 69. Cisco Systems Company Details
    Table 70. Cisco Systems Business Overview
    Table 71. Cisco Systems IT Spending in Transportation Product
    Table 72. Cisco Systems Revenue in IT Spending in Transportation Business (2019-2024) & (US$ Million)
    Table 73. Cisco Systems Recent Developments
    Table 74. GE Transportation Systems Company Details
    Table 75. GE Transportation Systems Business Overview
    Table 76. GE Transportation Systems IT Spending in Transportation Product
    Table 77. GE Transportation Systems Revenue in IT Spending in Transportation Business (2019-2024) & (US$ Million)
    Table 78. GE Transportation Systems Recent Developments
    Table 79. IBM Company Details
    Table 80. IBM Business Overview
    Table 81. IBM IT Spending in Transportation Product
    Table 82. IBM Revenue in IT Spending in Transportation Business (2019-2024) & (US$ Million)
    Table 83. IBM Recent Developments
    Table 84. Siemens Company Details
    Table 85. Siemens Business Overview
    Table 86. Siemens IT Spending in Transportation Product
    Table 87. Siemens Revenue in IT Spending in Transportation Business (2019-2024) & (US$ Million)
    Table 88. Siemens Recent Developments
    Table 89. Amadeus Company Details
    Table 90. Amadeus Business Overview
    Table 91. Amadeus IT Spending in Transportation Product
    Table 92. Amadeus Revenue in IT Spending in Transportation Business (2019-2024) & (US$ Million)
    Table 93. Amadeus Recent Developments
    Table 94. Alstom Company Details
    Table 95. Alstom Business Overview
    Table 96. Alstom IT Spending in Transportation Product
    Table 97. Alstom Revenue in IT Spending in Transportation Business (2019-2024) & (US$ Million)
    Table 98. Alstom Recent Developments
    Table 99. Atos Company Details
    Table 100. Atos Business Overview
    Table 101. Atos IT Spending in Transportation Product
    Table 102. Atos Revenue in IT Spending in Transportation Business (2019-2024) & (US$ Million)
    Table 103. Atos Recent Developments
    Table 104. Bass Software Company Details
    Table 105. Bass Software Business Overview
    Table 106. Bass Software IT Spending in Transportation Product
    Table 107. Bass Software Revenue in IT Spending in Transportation Business (2019-2024) & (US$ Million)
    Table 108. Bass Software Recent Developments
    Table 109. Capgemini Company Details
    Table 110. Capgemini Business Overview
    Table 111. Capgemini IT Spending in Transportation Product
    Table 112. Capgemini Revenue in IT Spending in Transportation Business (2019-2024) & (US$ Million)
    Table 113. Capgemini Recent Developments
    Table 114. Cognizant Company Details
    Table 115. Cognizant Business Overview
    Table 116. Cognizant IT Spending in Transportation Product
    Table 117. Cognizant Revenue in IT Spending in Transportation Business (2019-2024) & (US$ Million)
    Table 118. Cognizant Recent Developments
    Table 119. Cubic Company Details
    Table 120. Cubic Business Overview
    Table 121. Cubic IT Spending in Transportation Product
    Table 122. Cubic Revenue in IT Spending in Transportation Business (2019-2024) & (US$ Million)
    Table 123. Cubic Recent Developments
    Table 124. Damarel Company Details
    Table 125. Damarel Business Overview
    Table 126. Damarel IT Spending in Transportation Product
    Table 127. Damarel Revenue in IT Spending in Transportation Business (2019-2024) & (US$ Million)
    Table 128. Damarel Recent Developments
    Table 129. Descarts Systems Company Details
    Table 130. Descarts Systems Business Overview
    Table 131. Descarts Systems IT Spending in Transportation Product
    Table 132. Descarts Systems Revenue in IT Spending in Transportation Business (2019-2024) & (US$ Million)
    Table 133. Descarts Systems Recent Developments
    Table 134. DNV GL Company Details
    Table 135. DNV GL Business Overview
    Table 136. DNV GL IT Spending in Transportation Product
    Table 137. DNV GL Revenue in IT Spending in Transportation Business (2019-2024) & (US$ Million)
    Table 138. DNV GL Recent Developments
    Table 139. Ikusi Company Details
    Table 140. Ikusi Business Overview
    Table 141. Ikusi IT Spending in Transportation Product
    Table 142. Ikusi Revenue in IT Spending in Transportation Business (2019-2024) & (US$ Million)
    Table 143. Ikusi Recent Developments
    Table 144. Indra Sistemas Company Details
    Table 145. Indra Sistemas Business Overview
    Table 146. Indra Sistemas IT Spending in Transportation Product
    Table 147. Indra Sistemas Revenue in IT Spending in Transportation Business (2019-2024) & (US$ Million)
    Table 148. Indra Sistemas Recent Developments
    Table 149. KAPSCH Company Details
    Table 150. KAPSCH Business Overview
    Table 151. KAPSCH IT Spending in Transportation Product
    Table 152. KAPSCH Revenue in IT Spending in Transportation Business (2019-2024) & (US$ Million)
    Table 153. KAPSCH Recent Developments
    Table 154. LG CNS Company Details
    Table 155. LG CNS Business Overview
    Table 156. LG CNS IT Spending in Transportation Product
    Table 157. LG CNS Revenue in IT Spending in Transportation Business (2019-2024) & (US$ Million)
    Table 158. LG CNS Recent Developments
    Table 159. Mindfire Solutions Company Details
    Table 160. Mindfire Solutions Business Overview
    Table 161. Mindfire Solutions IT Spending in Transportation Product
    Table 162. Mindfire Solutions Revenue in IT Spending in Transportation Business (2019-2024) & (US$ Million)
    Table 163. Mindfire Solutions Recent Developments
    Table 164. NEC Company Details
    Table 165. NEC Business Overview
    Table 166. NEC IT Spending in Transportation Product
    Table 167. NEC Revenue in IT Spending in Transportation Business (2019-2024) & (US$ Million)
    Table 168. NEC Recent Developments
    Table 169. Northrop Grumman Company Details
    Table 170. Northrop Grumman Business Overview
    Table 171. Northrop Grumman IT Spending in Transportation Product
    Table 172. Northrop Grumman Revenue in IT Spending in Transportation Business (2019-2024) & (US$ Million)
    Table 173. Northrop Grumman Recent Developments
    Table 174. Wayne RESA Company Details
    Table 175. Wayne RESA Business Overview
    Table 176. Wayne RESA IT Spending in Transportation Product
    Table 177. Wayne RESA Revenue in IT Spending in Transportation Business (2019-2024) & (US$ Million)
    Table 178. Wayne RESA Recent Developments
    Table 179. Rockwell Collins Company Details
    Table 180. Rockwell Collins Business Overview
    Table 181. Rockwell Collins IT Spending in Transportation Product
    Table 182. Rockwell Collins Revenue in IT Spending in Transportation Business (2019-2024) & (US$ Million)
    Table 183. Rockwell Collins Recent Developments
    Table 184. SAP Company Details
    Table 185. SAP Business Overview
    Table 186. SAP IT Spending in Transportation Product
    Table 187. SAP Revenue in IT Spending in Transportation Business (2019-2024) & (US$ Million)
    Table 188. SAP Recent Developments
    Table 189. TCS Company Details
    Table 190. TCS Business Overview
    Table 191. TCS IT Spending in Transportation Product
    Table 192. TCS Revenue in IT Spending in Transportation Business (2019-2024) & (US$ Million)
    Table 193. TCS Recent Developments
    Table 194. Thales Group Company Details
    Table 195. Thales Group Business Overview
    Table 196. Thales Group IT Spending in Transportation Product
    Table 197. Thales Group Revenue in IT Spending in Transportation Business (2019-2024) & (US$ Million)
    Table 198. Thales Group Recent Developments
    Table 199. Veson Nautical Company Details
    Table 200. Veson Nautical Business Overview
    Table 201. Veson Nautical IT Spending in Transportation Product
    Table 202. Veson Nautical Revenue in IT Spending in Transportation Business (2019-2024) & (US$ Million)
    Table 203. Veson Nautical Recent Developments
    Table 204. Wipro Company Details
    Table 205. Wipro Business Overview
    Table 206. Wipro IT Spending in Transportation Product
    Table 207. Wipro Revenue in IT Spending in Transportation Business (2019-2024) & (US$ Million)
    Table 208. Wipro Recent Developments
    Table 209. Research Programs/Design for This Report
    Table 210. Key Data Information from Secondary Sources
    Table 211. Key Data Information from Primary Sources
List of Figures
    Figure 1. Global IT Spending in Transportation Market Size Growth Rate by Type, 2019 VS 2023 VS 2030 (US$ Million)
    Figure 2. Global IT Spending in Transportation Market Share by Type: 2023 VS 2030
    Figure 3. Hardware Features
    Figure 4. Software and Solutions Features
    Figure 5. IT Services Features
    Figure 6. Global IT Spending in Transportation Market Size Growth Rate by Application, 2019 VS 2023 VS 2030 (US$ Million)
    Figure 7. Global IT Spending in Transportation Market Share by Application: 2023 VS 2030
    Figure 8. Airlines Case Studies
    Figure 9. Waterways Case Studies
    Figure 10. Railways Case Studies
    Figure 11. Road Transport Case Studies
    Figure 12. IT Spending in Transportation Report Years Considered
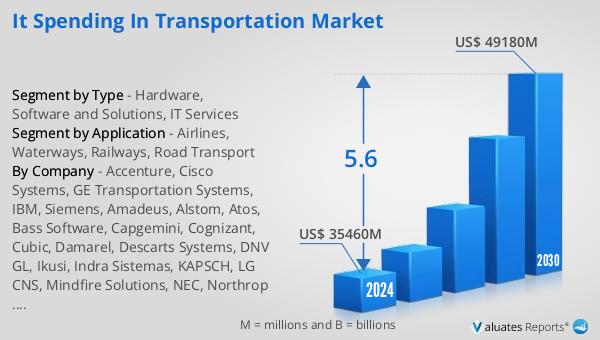
    Figure 13. Global IT Spending in Transportation Market Size (US$ Million), Year-over-Year: 2019-2030
    Figure 14. Global IT Spending in Transportation Market Size, (US$ Million), 2019 VS 2023 VS 2030
    Figure 15. Global IT Spending in Transportation Market Share by Region: 2023 VS 2030
    Figure 16. Global IT Spending in Transportation Market Share by Players in 2023
    Figure 17. Global Top IT Spending in Transportation Players by Company Type (Tier 1, Tier 2, and Tier 3) & (based on the Revenue in IT Spending in Transportation as of 2023)
    Figure 18. The Top 10 and 5 Players Market Share by IT Spending in Transportation Revenue in 2023
    Figure 19. North America IT Spending in Transportation Market Size YoY Growth (2019-2030) & (US$ Million)
    Figure 20. North America IT Spending in Transportation Market Share by Type (2019-2030)
    Figure 21. North America IT Spending in Transportation Market Share by Application (2019-2030)
    Figure 22. North America IT Spending in Transportation Market Share by Country (2019-2030)
    Figure 23. United States IT Spending in Transportation Market Size YoY Growth (2019-2030) & (US$ Million)
    Figure 24. Canada IT Spending in Transportation Market Size YoY Growth (2019-2030) & (US$ Million)
    Figure 25. Europe IT Spending in Transportation Market Size YoY (2019-2030) & (US$ Million)
    Figure 26. Europe IT Spending in Transportation Market Share by Type (2019-2030)
    Figure 27. Europe IT Spending in Transportation Market Share by Application (2019-2030)
    Figure 28. Europe IT Spending in Transportation Market Share by Country (2019-2030)
    Figure 29. Germany IT Spending in Transportation Market Size YoY Growth (2019-2030) & (US$ Million)
    Figure 30. France IT Spending in Transportation Market Size YoY Growth (2019-2030) & (US$ Million)
    Figure 31. U.K. IT Spending in Transportation Market Size YoY Growth (2019-2030) & (US$ Million)
    Figure 32. Italy IT Spending in Transportation Market Size YoY Growth (2019-2030) & (US$ Million)
    Figure 33. Russia IT Spending in Transportation Market Size YoY Growth (2019-2030) & (US$ Million)
    Figure 34. Nordic Countries IT Spending in Transportation Market Size YoY Growth (2019-2030) & (US$ Million)
    Figure 35. China IT Spending in Transportation Market Size YoY (2019-2030) & (US$ Million)
    Figure 36. China IT Spending in Transportation Market Share by Type (2019-2030)
    Figure 37. China IT Spending in Transportation Market Share by Application (2019-2030)
    Figure 38. Asia IT Spending in Transportation Market Size YoY (2019-2030) & (US$ Million)
    Figure 39. Asia IT Spending in Transportation Market Share by Type (2019-2030)
    Figure 40. Asia IT Spending in Transportation Market Share by Application (2019-2030)
    Figure 41. Asia IT Spending in Transportation Market Share by Region (2019-2030)
    Figure 42. Japan IT Spending in Transportation Market Size YoY Growth (2019-2030) & (US$ Million)
    Figure 43. South Korea IT Spending in Transportation Market Size YoY Growth (2019-2030) & (US$ Million)
    Figure 44. China Taiwan IT Spending in Transportation Market Size YoY Growth (2019-2030) & (US$ Million)
    Figure 45. Southeast Asia IT Spending in Transportation Market Size YoY Growth (2019-2030) & (US$ Million)
    Figure 46. India IT Spending in Transportation Market Size YoY Growth (2019-2030) & (US$ Million)
    Figure 47. Australia IT Spending in Transportation Market Size YoY Growth (2019-2030) & (US$ Million)
    Figure 48. Middle East, Africa, and Latin America IT Spending in Transportation Market Size YoY (2019-2030) & (US$ Million)
    Figure 49. Middle East, Africa, and Latin America IT Spending in Transportation Market Share by Type (2019-2030)
    Figure 50. Middle East, Africa, and Latin America IT Spending in Transportation Market Share by Application (2019-2030)
    Figure 51. Middle East, Africa, and Latin America IT Spending in Transportation Market Share by Country (2019-2030)
    Figure 52. Brazil IT Spending in Transportation Market Size YoY Growth (2019-2030) & (US$ Million)
    Figure 53. Mexico IT Spending in Transportation Market Size YoY Growth (2019-2030) & (US$ Million)
    Figure 54. Turkey IT Spending in Transportation Market Size YoY Growth (2019-2030) & (US$ Million)
    Figure 55. Saudi Arabia IT Spending in Transportation Market Size YoY Growth (2019-2030) & (US$ Million)
    Figure 56. Israel IT Spending in Transportation Market Size YoY Growth (2019-2030) & (US$ Million)
    Figure 57. GCC Countries IT Spending in Transportation Market Size YoY Growth (2019-2030) & (US$ Million)
    Figure 58. Accenture Revenue Growth Rate in IT Spending in Transportation Business (2019-2024)
    Figure 59. Cisco Systems Revenue Growth Rate in IT Spending in Transportation Business (2019-2024)
    Figure 60. GE Transportation Systems Revenue Growth Rate in IT Spending in Transportation Business (2019-2024)
    Figure 61. IBM Revenue Growth Rate in IT Spending in Transportation Business (2019-2024)
    Figure 62. Siemens Revenue Growth Rate in IT Spending in Transportation Business (2019-2024)
    Figure 63. Amadeus Revenue Growth Rate in IT Spending in Transportation Business (2019-2024)
    Figure 64. Alstom Revenue Growth Rate in IT Spending in Transportation Business (2019-2024)
    Figure 65. Atos Revenue Growth Rate in IT Spending in Transportation Business (2019-2024)
    Figure 66. Bass Software Revenue Growth Rate in IT Spending in Transportation Business (2019-2024)
    Figure 67. Capgemini Revenue Growth Rate in IT Spending in Transportation Business (2019-2024)
    Figure 68. Cognizant Revenue Growth Rate in IT Spending in Transportation Business (2019-2024)
    Figure 69. Cubic Revenue Growth Rate in IT Spending in Transportation Business (2019-2024)
    Figure 70. Damarel Revenue Growth Rate in IT Spending in Transportation Business (2019-2024)
    Figure 71. Descarts Systems Revenue Growth Rate in IT Spending in Transportation Business (2019-2024)
    Figure 72. DNV GL Revenue Growth Rate in IT Spending in Transportation Business (2019-2024)
    Figure 73. Ikusi Revenue Growth Rate in IT Spending in Transportation Business (2019-2024)
    Figure 74. Indra Sistemas Revenue Growth Rate in IT Spending in Transportation Business (2019-2024)
    Figure 75. KAPSCH Revenue Growth Rate in IT Spending in Transportation Business (2019-2024)
    Figure 76. LG CNS Revenue Growth Rate in IT Spending in Transportation Business (2019-2024)
    Figure 77. Mindfire Solutions Revenue Growth Rate in IT Spending in Transportation Business (2019-2024)
    Figure 78. NEC Revenue Growth Rate in IT Spending in Transportation Business (2019-2024)
    Figure 79. Northrop Grumman Revenue Growth Rate in IT Spending in Transportation Business (2019-2024)
    Figure 80. Wayne RESA Revenue Growth Rate in IT Spending in Transportation Business (2019-2024)
    Figure 81. Rockwell Collins Revenue Growth Rate in IT Spending in Transportation Business (2019-2024)
    Figure 82. SAP Revenue Growth Rate in IT Spending in Transportation Business (2019-2024)
    Figure 83. TCS Revenue Growth Rate in IT Spending in Transportation Business (2019-2024)
    Figure 84. Thales Group Revenue Growth Rate in IT Spending in Transportation Business (2019-2024)
    Figure 85. Veson Nautical Revenue Growth Rate in IT Spending in Transportation Business (2019-2024)
    Figure 86. Wipro Revenue Growth Rate in IT Spending in Transportation Business (2019-2024)
    Figure 87. Bottom-up and Top-down Approaches for This Report
    Figure 88. Data Triangulation
    Figure 89. Key Executives Interviewed
SELECT A FORMAT
Added to Cart
Electronic (PDF)

$4900

This license allows only one user to access the PDF.
Electronic (PDF)

$7350

This license allows 1 - 5 user to access the PDF, license is suitable for small groups of 5 users working together
Electronic (PDF)

$9800

This license allows users/teams in a same Enterprise to use this report, various departments within an enterpise can use this report
Add to Cart
Buy Now (15% Discount)

OUR CUSTOMER

Lukasiewicz Research Network

RELATED REPORTS

Global Cloud Based Storage Market Research Report 2025

120 Pages
Type: Report
Code: QYRE-Auto-2K6435
Fri Sep 12 00:00:00 UTC 2025

Add to Cart

Global Storage Services Market Research Report 2025

120 Pages
Type: Report
Code: QYRE-Auto-20H6045
Fri Sep 12 00:00:00 UTC 2025

Add to Cart

Global A2P and P2A Messaging Market Research Report 2025

120 Pages
Type: Report
Code: QYRE-Auto-0L8997
Fri Sep 12 00:00:00 UTC 2025

Add to Cart

Global Public Cloud Platform as a Service (PaaS) Market Research Report 2025

120 Pages
Type: Report
Code: QYRE-Auto-2K2573
Fri Sep 12 00:00:00 UTC 2025

Add to Cart